
PUBLISHER: MTN Consulting, LLC | PRODUCT CODE: 1340752

PUBLISHER: MTN Consulting, LLC | PRODUCT CODE: 1340752
Operators Fail to Break Energy Addiction in 2022: Network Operator Energy Consumption Grew 7% while Revenues Flattened, Worsening Energy Intensity, Efficiency Efforts Key to Reversing this Trend
This brief examines energy consumption in the network operator industry, spanning telcos, webscalers, and carrier-neutral operators (CNNOs). The report assesses energy consumption trends alongside revenues and other metrics, and highlights energy efficiency tactics being implemented by key operators. The analysis is based on a bottoms-up review of sustainability-related data and reports from 101 operators, accounting for nearly 90% (by revenues) of the entire industry of network operators: 17 webscalers, 29 carrier-neutral operators (CNNOs), and 55 telecom operators (telcos). Coverage timeframe is 2019-22. Energy consumption is defined to include both electricity and fuels such as diesel and natural gas.
VISUALS
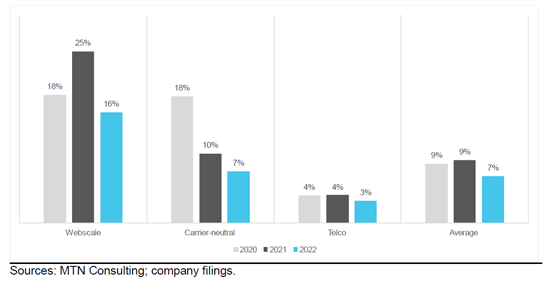
Total energy consumption, YoY growth rate
Network operators of all stripes are under pressure to reduce their carbon emissions and progress rapidly towards net zero. They are also concerned with reducing their energy spending. As such, there is a lot of well-deserved attention paid to energy consumption patterns in the network operator industry. Operators across segment lines are exploring a range of tactics to reduce their energy consumption or slow its rate of growth.
For 2022, we estimate that network operators consumed the equivalent of 543.6 terawatt hours (TWh) of energy, up 7% YoY; 88% of total energy consumed was derived from electricity. The 7% annual growth in 2022 is a bit slower than the 9% growth achieved in both 2020 and 2021. Webscale energy consumption grew the fastest in 2022, up 16% YoY, pushing up the sector's share of total energy consumption by network operators to 25.1%. Telco energy consumption grew the slowest, up just 3% from 2021, pushing down the sector's share to 60.5%. Carrier-neutral operators are by far the most energy intensive, but overall the CNNO segment consumed just 7% more energy in 2022 than the prior year, keeping the sector's share of total energy flat at a bit over 14%.
Energy consumption per unit of revenue, or energy intensity, is one useful metric. Across operator segments, energy intensity averaged out to 127 MWh consumed per US$1 million in revenues in 2022, a bit higher than 2021; the uptick is due largely to telcos. Telcos consumed an average of 186MWh per $1M in revenue in 2022, up from 169 MWh/$M in 2021. That trend is a bit worrisome, as: telcos need to cut opex anywhere they can, including energy; they have low rates of renewable energy use, and high emissions; and, energy intensity should be flat to down over time, especially for telcos slimming down their asset base. Many telcos prefer to focus on traffic intensity, i.e. energy consumed per unit of traffic, which is going down steadily over time for the whole industry - but that doesn't tell the whole story.
Energy intensity varies widely across our database. Within the telco sector, the most energy intensive was LG Uplus, which consumed 782MWh per $1M in revenue in 2022, while the least energy intensive was Swisscom at 45MWh. Swisscom is widely regarded as a top performer among telcos in its sustainability practices and reporting; its energy intensity has hovered around 45 steadily since 2016. In the webscale sector, Yandex's 121MWh/$M was highest in 2022, followed closely by Meta's 101 MWh/$M; Cognizant consumed just 9MWh. Changes over time in energy intensity among webscalers have come from deployment of cloud services, and a greater or lesser reliance on owned data centers. In the carrier-neutral segment, China's two emerging data center-focused players are by far the most energy intensive: ChinData and GDS consumed 4,586MWh and 3,528 MWh per $1M of revenue in 2022. Digital Realty, a more established CNNO focused on data centers, is also high; it recorded 2,255MWh of energy consumption per US$1M in revenues. Tower-focused CNNOs consume relatively little: US-based Crown Castle and SBA Communications consumed just 32 and 27 MWh per $1M in revenue in 2022.
COVERAGE:
Operators covered:
|
|
Table of Contents
- Summary
- Energy consumption includes more than electricity
- Energy consumption driven by networks, but networks differ
- Operator energy consumption grows 7% YoY in 2022
- Top 15 operators account for 46% of industry energy consumption
- Operator revenues flat at ~$4.1 trillion in 2022, pushing up energy intensity
- Energy intensity variations across three key segments
- Biggest improvements in energy intensity
- Energy consumption is closely connected to physical asset base
- Snapshot of energy efficiency projects
- Conclusion
- Appendix
List of Tables and Figures
- Figure 1: Electricity as a % of total energy consumption by operator type
- Figure 2: Total energy consumption by operator type, GWh
- Figure 3: Total energy consumption by segment, YoY growth rate
- Figure 4: Breakdown of 2022 energy consumption by key operator
- Figure 5: Energy intensity by operator type (MWH per US$M revenue)
- Figure 6: Energy intensity (MWh per $M in revenue) in 2022: top 5 results for each segment
- Figure 7: Biggest improvements (i.e. reductions) in energy intensity, 2019-22
- Figure 8: Energy intensity time series for three sample telcos, 2016-22 (MWh/$1M in revenue)
- Figure 9: Energy consumption in MWh per US$M of Net PP&E on the books (MWh/$M)
- Table 1: Energy efficiency tactics cited by operators with declining energy intensity for 2019-22

