
PUBLISHER: MTN Consulting, LLC | PRODUCT CODE: 1347333

PUBLISHER: MTN Consulting, LLC | PRODUCT CODE: 1347333
Carrier-neutrals Hope to Ride the GenAI Wave - 1H23 Update: CNNO Revenues on Track to Hit $100B in 2023, Capital Intensity >35% as Sector Attacks Opportunities in Generative AI and 5G Densification
This brief is focused on the carrier-neutral network operator (CNNO) sector. CNNOs sell independent, carrier-neutral access to network infrastructure, including bandwidth (fiber), data center and tower/small cell assets. The biggest CNNOs by revenues are China Tower, American Tower, Equinix, Crown Castle, Level 3 (a Lumen subsidiary), Digital Realty, Cellnex, NBN Australia, Indus Towers (ex-Bharti Infratel), and Zayo. In the most recent 12 months (3Q22-2Q23), the CNNO market represented $96.7 billion in revenues (+2.7% YoY), $34.8B in capex (+9.4% YoY), $8.8B in M&A spend (-68.9% YoY), and $251.1B of net plant (+2.3% YoY). CNNOs employed about 113.7K people at the end of June 2023, up 4.8% YoY.
VISUALS
After a weak second half 2022 (2H22), the CNNO sector has begun to improve in 2023 with 3% and 5% revenue growth rates in the first two quarters, respectively. Higher interest rates have slowed M&A and forced CNNOs to manage debt more carefully, but capex outlays remain high at over 35% of revenues. CNNOs continue to optimize their footprint and scale, spinning off and buying or building assets accordingly. One example: Cogent bought a portfolio of old switching centers from Sprint in late 2022 and is converting some to small colocation centers. CNNOs are increasing their focus on minimizing power costs - or at least limiting the impact of price rises - and gearing up their sustainability efforts.
For growth, we expect CNNOs to attack two important opportunities. First: support the telco need to densify their mobile networks; that means more small cell/DAS and metro fiber infra, but also more macro tower sites. Densification was required with 4G, but 5G requires even more in order to achieve its latency and speed goals. China Tower, as an example, expanded its in-building DAS coverage to 8,820 million square meters in 2Q23, up by 48% YoY. Second: support the tech sector's explosion of interest in generative AI ("GenAI"), by building facilities and offering services that match these new needs. DigitalBridge, for example, argues that AI is a "cloud-scale opportunity" and that "access to digital infra...at the lowest total cost, is a key success factor." CNNOs specialize in "access to digital infra" so this is a big opportunity for data center CNNOs. The big webscalers investing in GenAI will surely also want to build their own facilities, especially for model training, but CNNOs like Digital Realty and Equinix have roles to play with model implementation (i.e. inference).
COVERAGE:
Operators covered:
|
|
Table of Contents
- Summary
- Revenues up 4%, Capex up 15% YoY in the 1H23 period
- Free cash flow margin slides over the last few quarters; net margin is negative
- Generative AI opens up new opportunities for data center players
- 5G requires densification in the mobile RAN, creating CNNO opportunities
- Outlook
- Appendix
List of Figures and Tables
- Figure 1: YoY growth rates for single quarter revenues and capex, CNNOs
- Figure 2: CNNOs' net PP&E on the books alongside capex and M&A spending
- Figure 3: Annualized revenues ($B) and capital intensity for CNNO sector
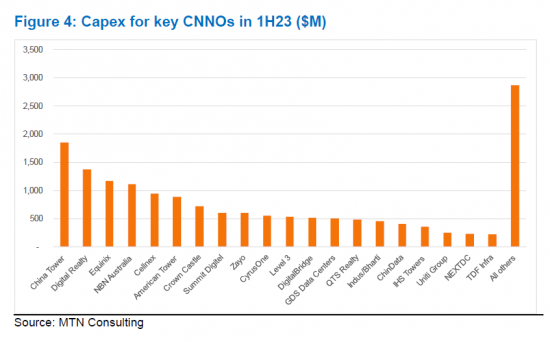
- Figure 4: Capex for key CNNOs in 1H23 ($M)
- Figure 5: Recent profitability margins for CNNO sector, annualized
- Figure 6: Top and bottom CNNOs based on annualized FCF margin in 2Q23
- Figure 7: Implications of GenAI for data center requirements in CNNO market
- Figure 8: Densification solutions for improved coverage, per American Tower
- Figure 9: China Tower's in-building DAS coverage, millions of square meters

