
PUBLISHER: Roots Analysis | PRODUCT CODE: 1682712

PUBLISHER: Roots Analysis | PRODUCT CODE: 1682712
Bioavailability Enhancement Technologies and Services Market by Type of Drug Class, Type of BCS Classification, Type of Bioavailability Enhancement Approach, Type of Dosage Form, Key Geographical Regions : Industry Trends and Global Forecasts, Till 2035
BIOAVAILABILITY ENHANCEMENT TECHNOLOGIES AND SERVICES MARKET: OVERVIEW
As per Roots Analysis, the global bioavailability enhancement technologies and services market is estimated to grow from USD 3.2 billion in the current year to USD 10.22 billion by 2035, at a CAGR of 11.11% during the forecast period, till 2035.
The market sizing and opportunity analysis has been segmented across the following parameters:
Type of Drug Class
- New Drug Approvals
- Generics
Type of BCS Classification
- BCS II Drugs
- BCS IV Drugs
Type of Bioavailability Enhancement Approach
- Solid Dispersion
- Size Reduction
- Lipid-based
- Other Approaches
Type of Dosage Form
- Liquids
- Solids
- Semi-Solids
- Fine Particles
Key Geographical Regions
- North America
- Europe
- Asia
- Latin America
- Middle East and North Africa
- Rest of the World
BIOAVAILABILITY ENHANCEMENT TECHNOLOGIES AND SERVICES MARKET: GROWTH AND TRENDS
In recent years, the focus of drug developers has shifted towards development of lipophilic drug compounds due to the increasing issues with aqueous solubility of drugs. According to a recent study, around 90% of NCEs belong to BCS class II and IV, which are known to be associated with low permeability. Given that a large number of drugs fail to reach the market due to poor bioavailability, the industry is looking for various tools / methods to mitigate this challenge. Moreover, as many companies seek to re-formulate existing product candidates that exhibit poor bioavailability, the demand for novel bioavailability enhancement methods has grown significantly.
It is worth mentioning that since 2000, more than 55 players offering bioavailability enhancement technologies and services have been established. Amidst the growing competition, the availability of cutting-edge tools and technologies has emerged as a differentiating factor. This has led many service / technology providers to actively expand their portfolios, either through strategic acquisitions / mergers or entering into service alliances with other bioavailability enhancement companies. As drug developers continue to evaluate novel drug targets and classes, the bioavailability enhancement domain is expected to grow at a steady pace over the next decade.
BIOAVAILABILITY ENHANCEMENT TECHNOLOGIES AND SERVICES MARKET: KEY INSIGHTS
The report delves into the current state of the bioavailability enhancement technologies and services market and identifies potential growth opportunities within the industry. Some key findings from the report include:
- Outsourcing has emerged as a popular model for improving drug bioavailability, with nearly 115 companies offering a wide range of services based on different bioavailability enhancement principles.
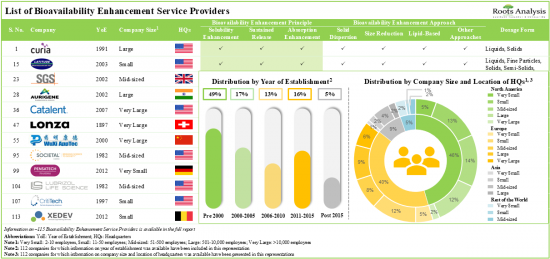
- At present, more than 80% of the players are offering bioavailability enhancement services focused on improving the drug solubility, primarily by adopting the solid dispersion approach.
- Advances in bioavailability enhancement technologies have enabled the development of novel formulations with improved pharmacokinetic properties, resulting in lucrative business opportunities for technology providers.
- Over 50% of the technologies are focused on enhancing the bioavailability of small molecules, specifically those intended for delivery via the oral route.
- A rise in partnerships focused on bioavailability enhancement services and technology platforms validates the growing interest in this domain; ~40% of such deals were instances of mergers and acquisitions.
- In the past decade, several clinical trials have been registered for evaluating novel therapeutic interventions with improved bioavailability, across different geographical regions.
- 5,800+ articles discussing various bioavailability enhancement techniques have been published in different scientific journals, thereby indicating the rapid pace of research activity within this domain.
- Bioavailability enhancement domain is characterized by extensive R&D activity, leading to the development of multiple high value technologies and a strong intellectual property portfolio.
- With the market evolving at a steady pace, emerging players need to incorporate innovative bioavailability enhancement technologies to augment their service portfolio and surpass the competition.
- Considering the concerns related to low solubility / permeability of certain marketed drugs and a large number of NCEs, the demand for bioavailability enhancement technologies and services is anticipated to rise in the future.
- Driven by the increase in number of BCS II and BCS IV molecules being evaluated in early phases of development, the bioavailability enhancement domain is likely to grow at CAGR of ~11%, till 2035.
BIOAVAILABILITY ENHANCEMENT TECHNOLOGIES AND SERVICES MARKET: KEY SEGMENTS
New Drug Approvals Occupy the Largest Share of the Bioavailability Enhancement Technologies and Services Market
Based on the type of drug class, the market is segmented into new drug approvals and generics. At present, new drug approvals hold the maximum share of the bioavailability enhancement technologies and services market. This trend is unlikely to change in the near future.
BCS II Drug Class is Likely to Dominate the Bioavailability Enhancement Technologies and Services Market During the Forecast Period
Based on the type of BCS classification, the market is segmented into BCS II drugs and BCS IV drugs. Currently, BCS II drug class holds the maximum share of the bioavailability enhancement technologies and services market. This trend is likely to remain the same in the coming decade.
Size Reduction Approach is the Fastest Growing Segment of the Bioavailability Enhancement Technologies and Services Market During the Forecast Period
Based on the type of bioavailability enhancement approach, the market is segmented into solid dispersion, size reduction, lipid-based and other approaches. It is worth highlighting that, lipid-based approach holds a larger share of the bioavailability enhancement technologies and services market. However, the bioavailability enhancement technologies and services market for size reduction approach is likely to grow at a relatively higher CAGR.
Liquid Dosage Form is Likely to Dominate the Bioavailability Enhancement Technologies and Services Market
Based on the type of dosage form, the market is segmented into liquids, solids, semi-solids and fine particles dosage form. Currently, liquid dosage form holds the maximum share of the bioavailability enhancement technologies and services market. This trend is unlikely to change in the foreseeable future.
North America Accounts for the Largest Share of the Market
Based on key geographical regions, the market is segmented into North America, Europe, Asia, Middle East and North Africa, Latin America, and Rest of the World. Majority share is expected to be captured by players based in North America. It is worth highlighting that, over the years, the market in Asia is expected to grow at a higher CAGR.
Example Players in the Bioavailability Enhancement Technologies and Services Market
- Adare Pharma Solutions
- Ascendia Pharmaceuticals
- Catalent
- Lonza
- Lubrizol Life Science Health
- Pace Life Sciences
- Quotient Sciences
- WuXi STA
BIOAVAILABILITY ENHANCEMENT TECHNOLOGIES AND SERVICES MARKET: RESEARCH COVERAGE
- Market Sizing and Opportunity Analysis: The report features an in-depth analysis of the bioavailability enhancement technologies and services market, focusing on key market segments, including [A] type of drug class, [B] type of BCS classification, [C] type of bioavailability enhancement approach, [D] type of dosage form, and [J] key geographical regions.
- Market Landscape 1: A comprehensive evaluation of bioavailability enhancement service providers, considering various parameters, such as [A] year of establishment, [B] company size (in terms of number of employees), [C] location of headquarters, [D] bioavailability enhancement principle supported, [E] bioavailability enhancement approach employed, [F] type of dosage form supported, and [G] route of administration of drug product.
- Market Landscape 2: A comprehensive evaluation of bioavailability enhancement technology providers, considering various parameters, such as [A] year of establishment, [B] company size (in terms of employee count), [C] location of headquarters, [D] bioavailability enhancement principle supported, [E] bioavailability enhancement approach employed, [F] type of molecule, [G] type of dosage form supported, [H] route of administration, [I] availability for license and [J] associated intellectual property rights.
- Key Insights: A detailed analysis, encompassing the contemporary market trends, using six schematic representations, including [A] a world map representation depicting the region-wise distribution of various stakeholders engaged in offering bioavailability enhancement services, on the basis of their company size, [B] a waffle chart representation, highlighting the regional distribution of bioavailability enhancement service providers, based on various types of bioavailability enhancement approaches employed by them, [C] a heat map representation of bioavailability enhancement service providers, based on bioavailability enhancement approaches and type of dosage form, [D] a horizontally grouped bar chart, highlighting the distribution of bioavailability enhancement service providers based on their company size and type of bioavailability enhancement principles, [E] an insightful tree map representation of bioavailability enhancement service providers (in terms of bioavailability enhancement principles employed and bioavailability enhancement approaches offered), as well as [F] a 3D bubble analysis comparing the key players engaged in drug bioavailability enhancement market, based on several relevant parameters (such as year of establishment, company size, number of bioavailability enhancement approaches offered and region).
- Company Profiles: In-depth profiles of key industry players offering bioavailability enhancement technologies and services, focusing on [A] company overviews, [B] financial information (if available), [C] bioavailability enhancement services portfolio, [D] recent developments and [E] an informed future outlook.
- Competitive Benchmarking Analysis: A competitive benchmarking analysis that emphasizes the primary focus areas of various players engaged in the drug bioavailability enhancement market. This analysis compares their existing capabilities within and beyond their respective peer groups based in North America, Europe, Asia-Pacific, and other regions. It offers stakeholders insights into potential strategies for achieving a competitive edge in the industry.
- Partnerships and Collaborations: An analysis of partnerships established in this sector, since 2013, covering mergers and acquisitions, licensing agreements, alliances, product development and manufacturing agreements, research and development agreements, product development and commercialization agreements, service agreements, and other agreements.
- Publication Analysis: A detailed review of peer-reviewed, scientific articles related to research on bioavailability enhancement of drug compounds and / or drug candidates, based on parameters, such as [A] year of publication, [B] type of publication, [C] popular keywords, [D] top journals, [E] top publishers and [F] top copyright holders (in terms of number of articles published).
- Patent Analysis: Detailed analysis of various patents filed / granted related to bioavailability enhancement approaches and technologies based on [A] type of patent, [B] patent application year, [C] patent publication year, [D] bioavailability enhancement approach, [E] CPC symbols, [F] geography, [G] emerging focus area, [H] type of organization, [I] leading industry and non-industry players (in terms of number of patents filed/granted), and [J] individual patent assignees (in terms of size of intellectual property portfolio). It also includes a patent benchmarking analysis and a detailed valuation analysis.
- Clinical Trial Analysis: Examination of completed, ongoing, and planned clinical studies of various bioavailability enhancement of various drug compounds and / or candidates based on parameters like [A] trial registration year, [B] trial phase, [C] current recruitment status, [D] enrolled patient population, [E] study design, [F] type of sponsor / collaborator, [G] leading industry and non-industry players (in terms of number of registered trials conducted), [H] type of molecule and [I] key geographies.
- Technology Evaluation Framework: An insightful framework evaluating the bioavailability enhancement approaches based on various parameters, such as number of technologies, number of approved drugs, trends highlighted in published literature and patents, and business models adopted by industry stakeholders. It also provides a value addition matrix for respective bioavailability enhancement approaches currently employed by stakeholders.
KEY QUESTIONS ANSWERED IN THIS REPORT
- How many companies are currently engaged in this market?
- Which are the leading companies in this market?
- What kind of partnership models are commonly adopted by industry stakeholders?
- What are the factors that are likely to influence the evolution of this market?
- What is the current and future market size?
- What is the CAGR of this market?
- How is the current and future market opportunity likely to be distributed across key market segments?
REASONS TO BUY THIS REPORT
- The report provides a comprehensive market analysis, offering detailed revenue projections of the overall market and its specific sub-segments. This information is valuable to both established market leaders and emerging entrants.
- Stakeholders can leverage the report to gain a deeper understanding of the competitive dynamics within the market. By analyzing the competitive landscape, businesses can make informed decisions to optimize their market positioning and develop effective go-to-market strategies.
- The report offers stakeholders a comprehensive overview of the market, including key drivers, barriers, opportunities, and challenges. This information empowers stakeholders to stay abreast of market trends and make data-driven decisions to capitalize on growth prospects.
ADDITIONAL BENEFITS
- Complimentary PPT Insights Packs
- Complimentary Excel Data Packs for all Analytical Modules in the Report
- 10% Free Content Customization
- Detailed Report Walkthrough Session with Research Team
- Free Updated report if the report is 6-12 months old or older
TABLE OF CONTENTS
1. PREFACE
- 1.1. Scope of the Report
- 1.2. Market Segmentation
- 1.3. Research Methodology
- 1.4. Key Questions Answered
- 1.5. Chapter Outlines
2. EXECUTIVE SUMMARY
3. INTRODUCTION
- 3.1. Chapter Overview
- 3.2. Historical Evolution of Bioavailability Enhancement Technologies
- 3.3. Assessment of Drug Bioavailability
- 3.3.1. Key Considerations for Bioavailability and Assessment Studies
- 3.3.1.1. Absolute Bioavailability
- 3.3.1.2. Relative Bioavailability
- 3.3.1.3. Single and Multiple Dose Studies
- 3.3.2. Studies in Healthy Subjects and Patients
- 3.3.2.1. Different Bioavailability Assessment methods
- 3.3.1. Key Considerations for Bioavailability and Assessment Studies
- 3.4. Need for Bioavailability Enhancement
- 3.5. Factors Affecting Bioavailability
- 3.5.1. Drug Related Factors
- 3.5.2. Patient Physiology Related Factors
- 3.6. Bioavailability Enhancement Technologies
- 3.6.1. Physical Technologies for Bioavailability Enhancement
- 3.6.1.1. Solid Dispersion
- 3.6.1.1.1. Classification of Solid Dispersion Approaches
- 3.6.1.1.2. Methodologies for Solid Dispersion Approaches
- 3.6.1.1.2.1. Hot Melt Extrusion
- 3.6.1.1.2.2. Melting / Fusion Methods
- 3.6.1.1.2.3. Solvent Evaporation
- 3.6.1.1.2.4. Spray-Dried Dispersion
- 3.6.1.1.2.5. Other Techniques Used for Solid Dispersion
- 3.6.1.2. Nanosuspension Technology
- 3.6.1.2.1. Top-Down Approach
- 3.6.1.2.2. Bottom-Up Approach
- 3.6.1.1. Solid Dispersion
- 3.6.2. Chemical Technologies for Bioavailability Enhancement
- 3.6.2.1. Lipid-Based Formulations
- 3.6.2.2. Non-Metal-Based Drug Delivery Systems
- 3.6.2.3. Polymer-Based Drug Delivery Systems
- 3.6.3. Biological Technologies for Bioavailability Enhancement
- 3.6.1. Physical Technologies for Bioavailability Enhancement
- 3.7. Concluding remarks
4. MARKET LANDSCAPE: BIOAVAILABILITY ENHANCEMENT SERVICE PROVIDERS
- 4.1. Chapter Overview
- 4.2. Bioavailability Enhancement Service Providers: Overall Market Landscape
- 4.2.1. Analysis by Year of Establishment
- 4.2.2. Analysis by Company Size
- 4.2.3. Analysis by Location of Headquarters
- 4.2.4. Analysis by Bioavailability Enhancement Principle
- 4.2.5. Analysis by Bioavailability Enhancement Approach
- 4.2.5.1. Analysis by Solid Dispersion Approaches
- 4.2.5.2. Analysis by Size Reduction Approaches
- 4.2.5.3. Analysis by Lipid-Based Approaches
- 4.2.5.4. Analysis by Other Bioavailability Enhancement Approaches
- 4.2.6. Analysis by Dosage Form
- 4.2.7. Analysis by Route of Administration
5. MARKET LANDSCAPE: BIOAVAILABILITY ENHANCEMENT TECHNOLOGY PROVIDERS
- 5.1. Chapter Overview
- 5.2. Bioavailability Enhancement Technologies: Technology Providers Landscape
- 5.2.1. Analysis by Year of Establishment
- 5.2.2. Analysis by Company Size
- 5.2.3. Analysis by Location of Headquarters
- 5.2.4. Analysis by Company Size and Location of Headquarters
- 5.2.5. Leading Players: Analysis by Number of Technologies
- 5.3. Bioavailability Enhancement Technologies: Market Landscape
- 5.3.1. Analysis by Bioavailability Enhancement Principle
- 5.3.2. Analysis by Bioavailability Enhancement Approach
- 5.3.3. Analysis by Bioavailability Enhancement Principle and Bioavailability Enhancement Approach
- 5.3.4. Analysis by Type of Molecule
- 5.3.5. Analysis by Bioavailability Enhancement Approach and Type of Molecule
- 5.3.6. Analysis by Dosage Form
- 5.3.7. Analysis by Route of Administration
- 5.3.8. Analysis by Availability for License
- 5.3.9. Analysis by Intellectual Property Rights
6. KEY INSIGHTS
- 6.1. Chapter Overview
- 6.1.1. Analysis by Company Size and Location of Headquarters (World Map Representation)
- 6.1.2. Analysis by Location of Headquarters and Bioavailability Enhancement Approach (Waffle Chart)
- 6.1.3. Analysis by Bioavailability Enhancement Approach and Dosage Form (Heatmap Representation)
- 6.1.4. Analysis by Company Size and Bioavailability Enhancement Principle (Horizontally Grouped Bar Chart)
- 6.1.5. Analysis by Bioavailability Enhancement Principle and Bioavailability Enhancement Approach (Tree map Representation)
- 6.1.6. Analysis by Year of Establishment, Company Size, Number of Bioavailability Enhancement Approaches Offered and Region (3D Bubble Chart)
7. COMPANY PROFILES
- 7.1. Chapter Overview
- 7.2. Adare Pharma Solutions
- 7.2.1. Company Overview
- 7.2.2. Financial Overview
- 7.2.3. Recent Developments and Future Outlook
- 7.3. Ascendia Pharmaceuticals
- 7.3.1. Company Overview
- 7.3.2. Financial Overview
- 7.3.3. Recent Developments and Future Outlook
- 7.4. Catalent
- 7.4.1. Company Overview
- 7.4.2. Financial Overview
- 7.4.3. Recent Developments and Future Outlook
- 7.5. Formulex Pharma Innovations (formerly SoluBest)
- 7.5.1. Company Overview
- 7.5.2. Financial Overview
- 7.5.3. Recent Developments and Future Outlook
- 7.6. Lonza
- 7.6.1. Company Overview
- 7.6.2. Financial Overview
- 7.6.3. Recent Developments and Future Outlook
- 7.7. Lubrizol Life Science Health
- 7.7.1. Company Overview
- 7.7.2. Financial Overview
- 7.7.3. Recent Developments and Future Outlook
- 7.8. Pace Analytical
- 7.8.1. Company Overview
- 7.8.2. Financial Overview
- 7.8.3. Recent Developments and Future Outlook
- 7.9. Quotient Sciences
- 7.9.1. Company Overview
- 7.9.2. Financial Overview
- 7.9.3. Recent Developments and Future Outlook
- 7.10. WuXi STA (A Subsidiary of WuXi AppTec)
- 7.10.1. Company Overview
- 7.10.2. Financial Overview
- 7.10.3. Recent Developments and Future Outlook
8. COMPANY BENCHMARK ANALYSIS
- 8.1. Chapter Overview
- 8.2. Company Benchmarking Analysis: Methodology
- 8.3. Company Benchmarking Analysis: Peer Groups
- 8.3.1. Benchmarking of Players based in North America, Established Pre 2000 (Peer Group I)
- 8.3.2. Benchmarking of Players based in North America, Established 2000-2010 (Peer Group II)
- 8.3.3. Benchmarking of Players based in North America, Established Post 2010 (Peer Group III)
- 8.3.4. Benchmarking of Players based in Europe, Established Pre 2000 (Peer Group IV)
- 8.3.5. Benchmarking of Players based in Europe, Established 2000-2010 (Peer Group V)
- 8.3.6. Benchmarking of Players based in Europe, Established Post 2010 (Peer Group VI)
- 8.3.7. Benchmarking of Players based in Asia and Rest of the World, Established Pre 2000 (Peer Group VII)
- 8.3.8. Benchmarking of Players based in Asia and Rest of the World, Established Post 2000 (Peer Group VIII)
9. PARTNERSHIPS AND COLLABORATIONS
- 9.1. Chapter Overview
- 9.2. Partnership Models
- 9.3. Bioavailability Enhancement: Partnerships and Collaborations
- 9.3.1. Analysis by Year of Partnership
- 9.3.2. Analysis by Type of Partnership
- 9.3.3. Analysis by Year and Type of Partnership
- 9.3.4. Analysis by Type of Partner
- 9.3.5. Analysis by Type of Partnership and Type of Partner
- 9.3.6. Most Active Players: Analysis by Number of Partnerships
- 9.4. Analysis by Geography
- 9.4.1. Analysis by Region
- 9.4.2. Analysis by Country
- 9.4.3. Analysis by Type of Partnership and Location of Partner Headquarters
10. PUBLICATION ANALYSIS
- 10.1. Chapter Overview
- 10.2. Scope and Methodology
- 10.3. Bioavailability Enhancement: Publication Analysis
- 10.3.1. Analysis by Year of Publication
- 10.3.2. Analysis by Type of Publication
- 10.3.3. Analysis by Bioavailability Enhancement Approach
- 10.3.4. Analysis by Year of Publication and Bioavailability Enhancement Approach
- 10.3.5. Most Popular Journals: Analysis by Number of Publications
- 10.3.6. Most Popular Journals: Analysis of Journal Impact Factor
- 10.3.7. Most Popular Publishers: Analysis by Number of Publications
- 10.3.8. Most Popular Copyright Holders: Analysis by Number of Publications
- 10.3.9. Analysis by Popular Keywords
11. PATENT ANALYSIS
- 11.1. Chapter Overview
- 11.2. Scope and Methodology
- 11.3. Bioavailability Enhancement: Patent Analysis
- 11.3.1. Analysis by Application Year
- 11.3.2. Analysis by Publication Year
- 11.3.3. Analysis by Bioavailability Enhancement Approach
- 11.3.4. Analysis by CPC Symbols
- 11.3.5. Analysis by Geography
- 11.3.6. Analysis by Emerging Focus Areas
- 11.3.7. Analysis by Type of Organization
- 11.3.8. Leading Players: Analysis by Number of Patents
- 11.4. Bioavailability Enhancement Market: Patent Benchmarking Analysis
- 11.4.1. Analysis by Patent Characteristics
- 11.5. Bioavailability Enhancement Market: Patent Valuation Analysis
- 11.6. Leading Patents: Analysis by Number of Citations
12. CLINICAL TRIAL ANALYSIS
- 12.1. Chapter Overview
- 12.2. Guidelines To Conduct Bioavailability Studies
- 12.3. Bioavailability Enhancement: Clinical Trials Analysis
- 12.3.1. Research Methodology
- 12.3.2. Analysis of Trials by Trial Registration Year
- 12.3.3. Analysis of Enrolled Patient Population by Trial Registration Year
- 12.3.4. Analysis of Trials by Study Design
- 12.3.5. Analysis of Trials by Trial Phase
- 12.3.6. Analysis of Trials by Trial Recruitment Status
- 12.3.7. Analysis of Trials by Type of Sponsor / Collaborator
- 12.3.8. Analysis by Type of Molecule and Trial Phase
- 12.3.9. Leading Industry Players: Analysis by Number of Registered Trials
- 12.3.10. Leading Non-Industry Players: Analysis by Number of Registered Trials
- 12.3.11. Analysis by Study Focus
- 12.3.12. Analysis of Trials by Geography
- 12.3.13. Analysis of Enrolled Patient Population by Geography
13. TECHNOLOGY EVALUATION FRAMEWORK
- 13.1. Chapter Overview
- 13.2. Key Assumptions and Methodology
- 13.3. Technologies based on Solid Dispersion Approaches
- 13.3.1. List of Approved Drugs
- 13.3.2. Trends in Intellectual Capital
- 13.3.3. Trends in Research Activity
- 13.3.4. Business Model Adopted by Developers
- 13.4. Technologies based on Size Reduction Approaches
- 13.4.1. List of Approved Drugs
- 13.4.2. Trends in Intellectual Property
- 13.4.3. Trends in Research Activity
- 13.4.4. Business Model Adopted by Developers
- 13.5. Technologies based on Lipid-based Approaches
- 13.5.1 List of Approved Drugs
- 13.5.2 Trends in Intellectual Property
- 13.5.3. Trends in Research Activity
- 13.5.4. Business Model Adopted by Developers
- 13.6. Technology Evaluation Framework: Wind Rose Representation
- 13.7. Results and Discussions
14. DEMAND ANALYSIS
- 14.1. Chapter Overview
- 14.2. Key Assumptions and Methodology
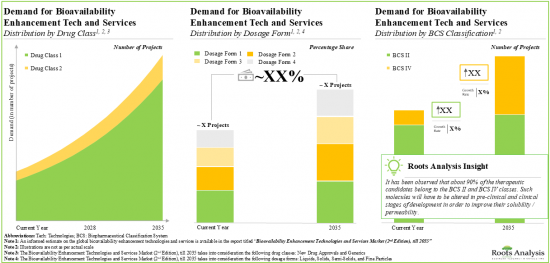
- 14.3. Global Demand for Bioavailability Enhancement Technologies and Services, till 2035
- 14.4. Analysis by Drug Class, Current Year and 2035
- 14.4.1. Demand for Bioavailability Enhancement Technologies and Services for New Drug Approvals, till 2035
- 14.4.2. Demand for Bioavailability Enhancement Technologies and Services for Generics, till 2035
- 14.5. Analysis by BCS Classification, Current Year and 2035
- 14.5.1. Demand for Bioavailability Enhancement Technologies and Services for BCS II Drugs, till 2035
- 14.5.2. Demand for Bioavailability Enhancement Technologies and Services for BCS IV Drugs, till 2035
- 14.6. Analysis by Dosage Form, Current Year and 2035
- 14.6.1. Demand for Bioavailability Enhancement Technologies and Services for Liquids, till 2035
- 14.6.2. Demand for Bioavailability Enhancement Technologies and Services for Solids, till 2035
- 14.6.3. Demand for Bioavailability Enhancement Technologies and Services for Semi- Solids, till 2035
- 14.6.4. Demand for Bioavailability Enhancement Technologies and Services for Fine Particles / Powders, till 2035
- 14.6.5. Demand for Bioavailability Enhancement Technologies and Services for Other Dosage Forms, till 2035
- 14.7. Concluding Remarks
15. MARKET FORECAST AND OPPURTUNITY ANALYSIS
- 15.1. Chapter Overview
- 15.2. Forecast Methodology and Key Assumptions
- 15.3. Global Bioavailability Enhancement Services Market, till 2035
- 15.4. Bioavailability Enhancement Services Market: Analysis by Drug Class, Current
Year and 2035
- 15.4.1. Bioavailability Enhancement Services Market for New Drug Approvals, till 2035
- 15.4.2. Bioavailability Enhancement Services Market for Generics, till 2035
- 15.5. Bioavailability Enhancement Services Market: Analysis by BCS Classification, Current Year and 2035
- 15.5.1. Bioavailability Enhancement Services Market for BCS II Drugs, till 2035
- 15.5.2. Bioavailability Enhancement Services Market for BCS IV Drugs, till 2035
- 15.6. Bioavailability Enhancement Services Market: Analysis by Bioavailability Enhancement Approach, Current Year and 2035
- 15.6.1. Bioavailability Enhancement Services Market for Lipid Based Approaches, till 2035
- 15.6.2. Bioavailability Enhancement Services Market for Size Reduction Based Approaches, till 2035
- 15.6.3. Bioavailability Enhancement Services Market for Solid Dispersion Based Approaches, till 2035
- 15.6.4. Bioavailability Enhancement Services Market for Other Bioavailability Enhancement Approaches, till 2035
- 15.7. Bioavailability Enhancement Services Market: Analysis by Dosage Form,
Current Year and 2035
- 15.7.1. Bioavailability Enhancement Services Market for Liquids, till 2035
- 15.7.2. Bioavailability Enhancement Services Market for Solids, till 2035
- 15.7.3. Bioavailability Enhancement Services Market for Semi-Solids, till 2035
- 15.7.4. Bioavailability Enhancement Services Market for Fine Particles / Powders, till 2035
- 15.7.5. Bioavailability Enhancement Services Market for Other Dosage Forms, till 2035
- 15.8. Bioavailability Enhancement Services Market: Analysis by Key Geographies, Current Year and 2035
- 15.8.1. Bioavailability Enhancement Services Market in North America, till 2035
- 15.8.2. Bioavailability Enhancement Services Market in Europe, till 2035
- 15.8.3. Bioavailability Enhancement Services Market in Asia, till 2035
- 15.8.4. Bioavailability Enhancement Services Market in Latin America, till 2035
- 15.8.5. Bioavailability Enhancement Services Market in Middle East and North Africa, till 2035
- 15.8.6. Bioavailability Enhancement Services Market in Rest of the World, till 2035
- 15.9. Concluding Remarks
16. CONCLUSION
17. APPENDIX I: LIST OF COMPANIES
18. APPENDIX II: TABULATED DATA
List of Tables
- Table 4.1 List of Bioavailability Enhancement Service Providers
- Table 4.2 Bioavailability Enhancement Service Providers: Information on Bioavailability Enhancement Principle
- Table 4.3 Bioavailability Enhancement Service Providers: Information on Bioavailability Enhancement Approach
- Table 4.4 Bioavailability Enhancement Service Providers: Information on Solid Dispersion Approaches
- Table 4.5 Bioavailability Enhancement Service Providers: Information on Size Reduction Approaches
- Table 4.6 Bioavailability Enhancement Service Providers: Information on Lipid-Based Approaches
- Table 4.7 Bioavailability Enhancement Service Providers: Information on Other Bioavailability Enhancement Approaches
- Table 4.8 Bioavailability Enhancement Service Providers: Information on Dosage Forms
- Table 4.9 Bioavailability Enhancement Service Providers: Information on Routes of Administration
- Table 5.1 List of Bioavailability Enhancement Technology Providers
- Table 5.2 Bioavailability Enhancement Technologies: Information on Bioavailability Enhancement Principles and Bioavailability Enhancement Approaches
- Table 5.3 Bioavailability Enhancement Technologies: Information on Type of Molecule
- Table 5.4 Bioavailability Enhancement Technologies: Information on Dosage Forms
- Table 5.5 Bioavailability Enhancement Technologies: Information on Routes of Administration
- Table 5.6 Bioavailability Enhancement Technologies: Information on Availability for License and Intellectual Property Rights
- Table 7.1 Adare Pharma Solutions: Company Snapshot
- Table 7.2 Adare Pharma Solutions: Recent Developments and Future Outlook
- Table 7.3 Ascendia Pharmaceuticals: Company Snapshot
- Table 7.4 Ascendia Pharmaceuticals: Recent Developments and Future Outlook
- Table 7.5 Catalent: Company Snapshot
- Table 7.6 Catalent: Recent Developments and Future Outlook
- Table 7.7 Formulex Pharma Innovations (formerly SoluBest): Company Snapshot
- Table 7.8 Formulex Pharma Innovations (formerly SoluBest): Recent Developments and Future Outlook
- Table 7.9 Lonza: Company Snapshot
- Table 7.10 Lonza: Recent Developments and Future Outlook
- Table 7.11 Lubrizol Life Science Health: Company Snapshot
- Table 7.12 Lubrizol Life Science Health: Recent Developments and Future Outlook
- Table 7.13 Pace Analytical: Company Snapshot
- Table 7.14 Pace Analytical: Recent Developments and Future Outlook
- Table 7.15 Quotient Sciences: Company Snapshot
- Table 7.16 Quotient Sciences: Recent Developments and Future Outlook
- Table 7.17 WuXi STA (A Subsidiary of WuXi AppTec): Company Snapshot
- Table 7.18 WuXi STA (A Subsidiary of WuXi AppTec): Recent Developments and Future Outlook
- Table 9.1 Bioavailability Enhancement: List of Partnerships and Collaborations, since 2013
- Table 9.2 Bioavailability Enhancement Focused Partnerships and Collaborations: Information on Type of Agreement (Region-wise and Geography-wise)
- Table 11.1 Patent Analysis: Prominent CPC Symbols
- Table 11.2 Patent Analysis: Most Popular CPC Symbols
- Table 11.3 Patent Analysis: List of Top CPC Symbols
- Table 11.4 Patent Analysis: Summary of Benchmarking Analysis
- Table 11.5 Patent Analysis: Categorization based on Weighted Valuation Scores
- Table 11.6 Patent Portfolio: List of Leading Patents (in terms of Highest Relative Valuation)
- Table 11.7 Patent Portfolio: List of Leading Patents (in terms of Number of Citations)
- Table 12.1 Bioavailability Studies: Regulatory Guidelines and Methodologies
- Table 15.1 Technologies based on Solid Dispersion Approaches: List of Approved Drugs
- Table 15.2 Technologies based on Size Reduction Approaches: List of Approved Drugs
- Table 15.3 Technologies based on Lipid-based Approaches: List of Approved Drugs
- Table 18.1 Bioavailability Enhancement Service Providers: Distribution by Year of Establishment
- Table 18.2 Bioavailability Enhancement Service Providers: Distribution by Company Size
- Table 18.3 Bioavailability Enhancement Service Providers: Distribution by Location of Headquarters (Region wise)
- Table 18.4 Bioavailability Enhancement Service Providers: Distribution by Location of Headquarters (Country-wise)
- Table 18.5 Bioavailability Enhancement Service Providers: Distribution by Bioavailability Enhancement Principle
- Table 18.6 Bioavailability Enhancement Service Providers: Distribution by Bioavailability Enhancement Approach
- Table 18.7 Bioavailability Enhancement Service Providers: Distribution by Solid Dispersion Approaches
- Table 18.8 Bioavailability Enhancement Service Providers: Distribution by Size Reduction Approaches
- Table 18.9 Bioavailability Enhancement Service Providers: Distribution by Lipid-based Approaches
- Table 18.10 Bioavailability Enhancement Service Providers: Distribution by Other Bioavailability Enhancement Approaches
- Table 18.11 Bioavailability Enhancement Service Providers: Distribution by Dosage Form
- Table 18.12 Bioavailability Enhancement Service Providers: Distribution by Route of Administration
- Table 18.13 Bioavailability Enhancement Technology Providers: Distribution by Year of Establishment
- Table 18.14 Bioavailability Enhancement Technology Providers: Distribution by Company Size
- Table 18.15 Bioavailability Enhancement Technology Providers: Distribution by Location of Headquarters (Region-wise)
- Table 18.16 Bioavailability Enhancement Technology Providers: Distribution by Location of Headquarters (Country-wise)
- Table 18.17 Bioavailability Enhancement Technology Providers: Distribution by Company Size and Location of Headquarters
- Table 18.18 Leading Players: Distribution by Number of Technologies
- Table 18.19 Bioavailability Enhancement Technologies: Distribution by Bioavailability Enhancement Principle
- Table 18.20 Bioavailability Enhancement Technologies: Distribution by Bioavailability Enhancement Approach
- Table 18.21 Bioavailability Enhancement Technologies: Distribution by Bioavailability Enhancement Principle and Bioavailability Enhancement Approach
- Table 18.22 Bioavailability Enhancement Technologies: Distribution by Type of Molecule
- Table 18.23 Bioavailability Enhancement Technologies: Distribution by Bioavailability Enhancement Approach and Type of Molecule
- Table 18.24 Bioavailability Enhancement Technologies: Distribution by Dosage Form
- Table 18.25 Bioavailability Enhancement Technologies: Distribution by Route of Administration
- Table 18.26 Bioavailability Enhancement Technologies: Distribution by Availability for License
- Table 18.27 Bioavailability Enhancement Technologies: Distribution by Intellectual Property Rights
- Table 18.28 Key Insights: Distribution by Company Size and Location of Headquarters
- Table 18.29 Key Insights: Distribution by Location of Headquarters and Bioavailability Enhancement Approach
- Table 18.30 Key Insights: Distribution by Bioavailability Enhancement Approach and Dosage Form
- Table 18.31 Key Insights: Distribution by Company Size and Bioavailability Enhancement Principle
- Table 18.32 Key Insights: Distribution by Bioavailability Enhancement Principle and Bioavailability Enhancement Approach
- Table 18.33 Catalent: Annual Revenues, FY 2017 Onwards (USD Billion)
- Table 18.34 Lonza: Annual Revenues, FY 2017 Onwards (CHF Billion)
- Table 18.35 WuXi STA (A Subsidiary of WuXi AppTec): Annual Revenues, FY 2017 Onwards (USD Billion)
- Table 18.36 Partnerships and Collaborations: Cumulative Year-Wise Trend, since 2013
- Table 18.37 Partnerships and Collaborations: Distribution by Type of Partnership
- Table 18.38 Partnerships and Collaborations: Distribution by Year and Type of Partnership
- Table 18.39 Partnerships and Collaborations: Distribution by Type of Partner
- Table 18.40 Partnerships and Collaborations: Distribution by Type of Partnership and Type of Partner
- Table 18.41 Most Active Players: Distribution by Number of Partnerships
- Table 18.42 Partnerships and Collaborations: Distribution by Location of Headquarters (Region-wise)
- Table 18.43 Partnerships and Collaborations: Distribution by Location of Headquarters (Country-wise)
- Table 18.44 Partnerships and Collaboration: Distribution by Type of Partnership and Location of Partner Headquarters
- Table 18.45 Publication Analysis: Cumulative Distribution by Publication Year, since 2017
- Table 18.46 Publication Analysis: Distribution by Type of Publication
- Table 18.47 Publication Analysis: Distribution by Bioavailability Enhancement Approach
- Table 18.48 Publication Analysis: Distribution by Year of Publication and Bioavailability Enhancement Approach
- Table 18.49 Most Popular Journals: Distribution by Number of Publications
- Table 18.50 Most Popular Journals: Distribution by Journal Impact Factor
- Table 18.51 Most Popular Publishers: Distribution by Number of Publications
- Table 18.52 Most Popular Copyright Holders: Distribution by Number of Publications
- Table 18.53 Patent Analysis: Distribution by Type of Patent
- Table 18.54 Patent Analysis: Cumulative Distribution by Application Year
- Table 18.55 Patent Analysis: Cumulative Distribution by Publication Year
- Table 18.56 Patent Analysis: Distribution by Year-wise Trend of Filed Patent Applications and Number of Granted Patents
- Table 18.57 Patent Analysis: Distribution by Bioavailability Enhancement Approach
- Table 18.58 Patent Analysis: Distribution by Publication Year and Bioavailability Enhancement Approach
- Table 18.59 Patent Analysis: Distribution by CPC Symbols
- Table 18.60 Patent Analysis: Distribution by Location of Patent Jurisdiction (Region-wise)
- Table 18.61 Patent Analysis: Distribution by Location of Patent Jurisdiction (Country-wise)
- Table 18.62 Patent Analysis: Cumulative Year-wise Distribution by Type of Organization
- Table 18.63 Leading Industry Players: Distribution by Number of Patents
- Table 18.64 Leading Non-Industry Players: Distribution by Number of Patents
- Table 18.65 Leading Patent Assignees: Distribution by Number of Patents
- Table 18.66 Patent Benchmarking Analysis: Distribution of Leading Industry Players by Patent Characteristics (CPC Symbols)
- Table 18.67 Patent Analysis: Distribution of Patents by Age
- Table 18.68 Bioavailability Enhancement: Patent Valuation
- Table 18.69 Leading Patents: Distribution by Number of Citations
- Table 18.70 Bioavailability Studies: Cumulative Distribution by Trial Registration Year
- Table 18.71 Bioavailability Studies: Distribution of Enrolled Patient Population by Trial Registration Year
- Table 18.72 Bioavailability Studies: Distribution of Trials by Study Design
- Table 18.73 Bioavailability Studies: Distribution of Trials by Trial Phase
- Table 18.74 Bioavailability Studies: Distribution of Trials by Recruitment Status
- Table 18.75 Bioavailability Studies: Distribution of Trials by Type of Sponsor /Collaborator
- Table 18.76 Bioavailability Studies: Distribution of Trials by Type of Molecule and Trial Phase
- Table 18.77 Leading Industry Players: Distribution by Number of Registered Trials
- Table 18.78 Leading Non-Industry Players: Distribution by Number of Registered Trials
- Table 18.79 Bioavailability Studies: Distribution by Study Focus
- Table 18.80 Bioavailability Studies: Geographical Distribution of Trials
- Table 18.81 Bioavailability Studies: Geographical Distribution of Enrolled Patient Population
- Table 18.82 Global Demand for Bioavailability Enhancement Technologies and Services, till 2035 (In Terms of Number of Projects)
- Table 18.83 Demand for Bioavailability Enhancement Technologies and Services: Distribution by Drug Class, Current Year and 2035
- Table 18.84 Demand for Bioavailability Enhancement Technologies and Services for New Drug Approvals, till 2035 (In Terms of Number of Projects)
- Table 18.85 Demand for Bioavailability Enhancement Technologies and Services for Generics, till 2035 (In Terms of Number of Projects)
- Table 18.86 Demand for Bioavailability Enhancement Technologies and Services: Distribution by BCS Classification, Current Year and 2035
- Table 18.87 Demand for Bioavailability Enhancement Technologies and Services for BCS II Drugs, till 2035 (In Terms of Number of Projects)
- Table 18.88 Demand for Bioavailability Enhancement Technologies and Services for BCS IV Drugs, till 2035 (In Terms of Number of Projects)
- Table 18.89 Demand for Bioavailability Enhancement Technologies and Services: Distribution by Dosage Form, Current Year and 2035
- Table 18.90 Demand for Bioavailability Enhancement Technologies and Services for Liquids, till 2035 (In Terms of Number of Projects)
- Table 18.91 Demand for Bioavailability Enhancement Technologies and Services for Solids, till 2035 (In Terms of Number of Projects)
- Table 18.92 Demand for Bioavailability Enhancement Technologies and Services for Semi-Solids, till 2035 (In Terms of Number of Projects)
- Table 18.93 Demand for Bioavailability Enhancement Technologies and Services for Fine Particles / Powders, till 2035 (In Terms of Number of Projects)
- Table 18.94 Demand for Bioavailability Enhancement Technologies and Services for Other Dosage Forms, till 2035 (In Terms of Number of Projects)
- Table 18.95 Global Bioavailability Enhancement Services Market, till 2035 (USD Billion)
- Table 18.96 Bioavailability Enhancement Services Market: Distribution by Drug Class, Current Year and 2035
- Table 18.97 Bioavailability Enhancement Services Market for New Drug Approvals, Conservative, Base and Optimistic Scenarios, till 2035 (USD Billion)
- Table 18.98 Bioavailability Enhancement Services Market for Generics, Conservative, Base and Optimistic Scenarios, till 2035 (USD Billion)
- Table 18.99 Bioavailability Enhancement Services Market, Current Year and 2035: Distribution by BCS Classification, Current Year and 2035
- Table 18.100 Bioavailability Enhancement Services Market for BCS II Drugs, Conservative, Base and Optimistic Scenarios, till 2035 (USD Billion)
- Table 18.101 Bioavailability Enhancement Services Market for BCS IV Drugs, Conservative, Base and Optimistic Scenarios, till 2035 (USD Billion)
- Table 18.102 Bioavailability Enhancement Services Market, Current Year and 2035: Distribution by Bioavailability Enhancement Approach, Current Year and 2035
- Table 18.103 Bioavailability Enhancement Services Market for Lipid Based Approaches, Conservative, Base and Optimistic Scenarios, till 2035 (USD Billion)
- Table 18.104 Bioavailability Enhancement Services Market for Size Reduction Based Approaches, Conservative, Base and Optimistic Scenarios, till 2035 (USD Billion)
- Table 18.105 Bioavailability Enhancement Services Market for Solid Dispersion Based Approaches, Conservative, Base and Optimistic Scenarios, till 2035 (USD Billion)
- Table 18.106 Bioavailability Enhancement Services Market for Other Bioavailability Enhancement Approaches, Conservative, Base and Optimistic Scenarios, till 2035 (USD Billion)
- Table 18.107 Bioavailability Enhancement Services Market: Distribution by Dosage Form, Current Year and 2035
- Table 18.108 Bioavailability Enhancement Services Market for Liquids, Conservative, Base and Optimistic Scenarios, till 2035 (USD Billion)
- Table 18.109 Bioavailability Enhancement Services Market for Solids, till 2035 (USD Billion)
- Table 18.110 Bioavailability Enhancement Services Market for Semi-Solids, Conservative, Base and Optimistic Scenarios, till 2035 (USD Billion)
- Table 18.111 Bioavailability Enhancement Services Market for Fine Particles / Powders, Conservative, Base and Optimistic Scenarios, till 2035 (USD Billion)
- Table 18.112 Bioavailability Enhancement Services Market for Other Dosage Forms, Conservative, Base and Optimistic Scenarios, till 2035 (USD Billion)
- Table 18.113 Bioavailability Enhancement Services Market: Distribution by Key Geographies, Current Year and 2035
- Table 18.114 Bioavailability Enhancement Services Market in North America, Conservative, Base and Optimistic Scenarios, till 2035 (USD Billion)
- Table 18.115 Bioavailability Enhancement Services Market in Europe, Conservative, Base and Optimistic Scenarios, till 2035 (USD Billion)
- Table 18.116 Bioavailability Enhancement Services Market in Asia, Conservative, Base and Optimistic Scenarios, till 2035 (USD Billion)
- Table 18.117 Bioavailability Enhancement Services Market in Latin America, Conservative, Base and Optimistic Scenarios, till 2035 (USD Billion)
- Table 18.118 Bioavailability Enhancement Services Market in Middle East and North Africa, Conservative, Base and Optimistic Scenarios, till 2035 (USD Billion)
- Table 18.119 Bioavailability Enhancement Services Market in Rest of the World, Conservative, Base and Optimistic Scenarios, till 2035 (USD Billion)
- Table 18.120 Bioavailability Enhancement Services Market: Conservative, Base and Optimistic Scenarios, 2022, 2027 and 2035 (USD Billion)
- Table 18.121 Technologies based on Solid Dispersion Approaches: Trends in Intellectual Capital
- Table 18.122 Technologies based on Solid Dispersion Approaches: Trends in Research Activity
- Table 18.123 Technologies based on Size Reduction Approaches: Trends in Intellectual Capital
- Table 18.124 Technologies based on Size Reduction Approaches: Trends in Research Activity
- Table 18.125 Technologies based on Lipid-based Approaches: Trends in Intellectual Capital
- Table 18.126 Technologies based on Lipid-based Approaches: Trends in Research Activity
- Table 18.127 Technology Evaluation Framework: Value Addition Matrix
- Table 18.128 Technology Evaluation Matrix
List of Figures
- Figure 2.1 Executive Summary: Overall Market Landscape of Bioavailability Enhancement Service Providers
- Figure 2.2 Executive Summary: Overall Market Landscape of Bioavailability Enhancement Technologies
- Figure 2.3 Executive Summary: Partnerships and Collaborations
- Figure 2.4 Executive Summary: Publication Analysis
- Figure 2.5 Executive Summary: Patent Analysis
- Figure 2.6 Executive Summary: Clinical Trial Analysis
- Figure 2.7 Executive Summary: Demand Analysis
- Figure 2.8 Executive Summary: Market Forecast
- Figure 3.1 Bioavailability Enhancement Technologies: Historical Evolution of Bioavailability Enhancement Technologies
- Figure 3.2 Single Dose Study: Drug Concentration-Time Curve
- Figure 3.3 Multiple Dose Study: Drug Concentration-Time Curve
- Figure 3.4 Different Bioavailability Assessment Methods
- Figure 3.5 Biopharmaceutical Classification System
- Figure 3.6 Factors Affecting Drug Bioavailability
- Figure 3.7 Solid Dispersion Formulations: Classification
- Figure 3.8 Solid Dispersion Formulations: Preparation Methodologies
- Figure 3.9 Solid Dispersion Formulations: Melt Agglomeration Technique
- Figure 3.10 Nanosuspension Formulations: Preparation Methodologies
- Figure 3.11 Lipid-based Formulations: Classification
- Figure 3.12 Biological Formulations: Classification
- Figure 4.1 Bioavailability Enhancement Service Providers: Distribution by Year of Establishment
- Figure 4.2 Bioavailability Enhancement Service Providers: Distribution by Company Size
- Figure 4.3 Bioavailability Enhancement Service Providers: Distribution by Location of Headquarters (Region wise)
- Figure 4.4 Bioavailability Enhancement Service Providers: Distribution by Location of Headquarters (Country-wise)
- Figure 4.5 Bioavailability Enhancement Service Providers: Distribution by Bioavailability Enhancement Principle
- Figure 4.6 Bioavailability Enhancement Service Providers: Distribution by Bioavailability Enhancement Approach
- Figure 4.7 Bioavailability Enhancement Service Providers: Distribution by Solid Dispersion Approaches
- Figure 4.8 Bioavailability Enhancement Service Providers: Distribution by Size Reduction Approaches
- Figure 4.9 Bioavailability Enhancement Service Providers: Distribution by Lipid-based Approaches
- Figure 4.10 Bioavailability Enhancement Service Providers: Distribution by Other Bioavailability Enhancement Approaches
- Figure 4.11 Bioavailability Enhancement Service Providers: Distribution by Dosage Form
- Figure 4.12 Bioavailability Enhancement Service Providers: Distribution by Route of Administration
- Figure 5.1 Bioavailability Enhancement Technology Providers: Distribution by Year of Establishment
- Figure 5.2 Bioavailability Enhancement Technology Providers: Distribution by Company Size
- Figure 5.3 Bioavailability Enhancement Technology Providers: Distribution by Location of Headquarters (Region-wise)
- Figure 5.4 Bioavailability Enhancement Technology Providers: Distribution by Location of Headquarters (Country-wise)
- Figure 5.5 Bioavailability Enhancement Technology Providers: Distribution by Company Size and Location of Headquarters
- Figure 5.6 Leading Players: Distribution by Number of Technologies
- Figure 5.7 Bioavailability Enhancement Technologies: Distribution by Bioavailability Enhancement Principle
- Figure 5.8 Bioavailability Enhancement Technologies: Distribution by Bioavailability Enhancement Approach
- Figure 5.9 Bioavailability Enhancement Technologies: Distribution by Bioavailability Enhancement Principle and Bioavailability Enhancement Approach
- Figure 5.10 Bioavailability Enhancement Technologies: Distribution by Type of Molecule
- Figure 5.11 Bioavailability Enhancement Technologies: Distribution by Bioavailability Enhancement Approach and Type of Molecule
- Figure 5.12 Bioavailability Enhancement Technologies: Distribution by Dosage Form
- Figure 5.13 Bioavailability Enhancement Technologies: Distribution by Route of Administration
- Figure 5.14 Bioavailability Enhancement Technologies: Distribution by Availability for License
- Figure 5.15 Bioavailability Enhancement Technologies: Distribution by Intellectual Property Rights
- Figure 6.1 Key Insights: Distribution by Company Size and Location of Headquarters
- Figure 6.2 Key Insights: Distribution by Location of Headquarters and Bioavailability Enhancement Approach
- Figure 6.3 Key Insights: Distribution by Bioavailability Enhancement Approach and Dosage Form
- Figure 6.4 Key Insights: Distribution by Company Size and Bioavailability Enhancement Principle
- Figure 6.5 Key Insights: Distribution by Bioavailability Enhancement Principle and Bioavailability Enhancement Approach
- Figure 6.6 Key Insights: Distribution by Year of Establishment, Company Size, Number of Bioavailability Enhancement Approaches Offered and Region
- Figure 7.1 Adare Pharma Solutions: Bioavailability Enhancement Services Portfolio
- Figure 7.2 Ascendia Pharmaceuticals: Bioavailability Enhancement Services Portfolio
- Figure 7.3 Catalent: Annual Revenues, FY 2017 Onwards (USD Billion)
- Figure 7.4 Catalent: Bioavailability Enhancement Services Portfolio
- Figure 7.5 Formulex Pharma Innovations (formerly SoluBest): Bioavailability Enhancement Services Portfolio
- Figure 7.6 Lonza: Annual Revenues, FY 2017 Onwards (CHF Billion)
- Figure 7.7 Lonza: Bioavailability Enhancement Services Portfolio
- Figure 7.8 Lubrizol Life Science Health: Bioavailability Enhancement Services Portfolio
- Figure 7.9 Pace Analytical: Bioavailability Enhancement Services Portfolio
- Figure 7.10 Quotient Sciences: Bioavailability Enhancement Services Portfolio
- Figure 7.11 WuXi STA (A Subsidiary of WuXi AppTec): Annual Revenues, FY 2017 Onwards (USD Billion)
- Figure 7.12 WuXi STA (A Subsidiary of WuXi AppTec): Bioavailability Enhancement Services Portfolio
- Figure 8.1 Company Benchmarking Analysis: Distribution by Year of Establishment and Location of Headquarters
- Figure 8.2 Benchmarking of Players based in North America, Established Pre-2000 (Peer Group I)
- Figure 8.3 Benchmarking of Players based in North America, Established 2000-2010 (Peer Group II)
- Figure 8.4 Benchmarking of Players based in North America, Established Post-2010 (Peer Group III)
- Figure 8.5 Benchmarking of Players based in Europe, Established Pre-2000 (Peer Group IV)
- Figure 8.6 Benchmarking of Players based in Europe, Established 2000-2010 (Peer Group V)
- Figure 8.7 Benchmarking of Players based in Europe, Established Post-2010 (Peer Group VI)
- Figure 8.8 Benchmarking of Players based in Asia and Rest of the World, Established Pre-2000 (Peer Group VII)
- Figure 8.9 Benchmarking of Players based in Asia and Rest of the World, Established Post-2000 (Peer Group VIII)
- Figure 9.1 Partnerships and Collaborations: Cumulative Year-Wise Trend, since 2013
- Figure 9.2 Partnerships and Collaborations: Distribution by Type of Partnership
- Figure 9.3 Partnerships and Collaborations: Distribution by Year and Type of Partnership
- Figure 9.4 Partnerships and Collaborations: Distribution by Type of Partner
- Figure 9.5 Partnerships and Collaborations: Distribution by Type of Partnership and Type of Partner
- Figure 9.6 Most Active Players: Distribution by Number of Partnerships
- Figure 9.7 Partnerships and Collaborations: Distribution by Location of Headquarters (Region-wise)
- Figure 9.8 Partnerships and Collaborations: Distribution by Location of Headquarters (Country-wise)
- Figure 9.9 Partnerships and Collaborations: Distribution by Type of Partnership and Location of Partner Headquarters
- Figure 10.1 Publication Analysis: Cumulative Distribution by Publication Year, since 2017
- Figure 10.2 Publication Analysis: Distribution by Type of Publication
- Figure 10.3 Publication Analysis: Distribution by Bioavailability Enhancement Approach
- Figure 10.4 Publication Analysis: Distribution by Year of Publication and Bioavailability Enhancement Approach
- Figure 10.5 Most Popular Journals: Distribution by Number of Publications
- Figure 10.6 Most Popular Journals: Distribution by Journal Impact Factor
- Figure 10.7 Most Popular Publishers: Distribution by Number of Publications
- Figure 10.8 Most Popular Copyright Holders: Distribution by Number of Publications
- Figure 10.9 Publication Analysis: Distribution by Popular Keywords
- Figure 11.1 Patent Analysis: Distribution by Type of Patent
- Figure 11.2 Patent Analysis: Cumulative Distribution by Application Year
- Figure 11.3 Patent Analysis: Cumulative Distribution by Publication Year
- Figure 11.4 Patent Analysis: Year-wise Distribution of Filed Patent Applications and Granted Patents
- Figure 11.5 Patent Analysis: Distribution by Bioavailability Enhancement Approach
- Figure 11.6 Patent Analysis: Distribution by Publication Year and Bioavailability Enhancement Approach
- Figure 11.7 Patent Analysis: Distribution by CPC Symbols
- Figure 11.8 Patent Analysis: Distribution by Location of Patent Jurisdiction (Region-wise)
- Figure 11.9 Patent Analysis: Distribution by Location of Patent Jurisdiction (Country-wise)
- Figure 11.10 Patent Analysis: Distribution by Emerging Focus Area
- Figure 11.11 Patent Analysis: Cumulative Year-wise Distribution by Type of Organization
- Figure 11.12 Leading Industry Players: Distribution by Number of Patents
- Figure 11.13 Leading Non-Industry Players: Distribution by Number of Patents
- Figure 11.14 Leading Patent Assignees: Distribution by Number of Patents
- Figure 11.15 Patent Benchmarking Analysis: Distribution of Leading Industry Players by Patent Characteristics (CPC Symbols)
- Figure 11.16 Patent Analysis: Distribution of Patents by Age
- Figure 11.17 Bioavailability Enhancement: Patent Valuation
- Figure 12.1 Clinical Trial Analysis: Scope and Methodology
- Figure 12.2 Bioavailability Studies: Cumulative Distribution by Trial Registration Year
- Figure 12.3 Bioavailability Studies: Distribution of Enrolled Patient Population by Trial Registration Year
- Figure 12.4 Bioavailability Studies: Distribution of Trials by Study Design
- Figure 12.5 Bioavailability Studies: Distribution of Trials by Trial Phase
- Figure 12.6 Bioavailability Studies: Distribution of Trials by Recruitment Status
- Figure 12.7 Bioavailability Studies: Distribution of Trials by Type of Sponsor / Collaborator
- Figure 12.8 Bioavailability Studies: Distribution of Trials by Type of Molecule and Trial Phase
- Figure 12.9 Leading Industry Players: Distribution by Number of Registered Trials
- Figure 12.10 Leading Non-Industry Players: Distribution by Number of Registered Trials
- Figure 12.11 Bioavailability Studies: Distribution by Study Focus
- Figure 12.12 Bioavailability Studies: Geographical Distribution of Trials
- Figure 12.13 Bioavailability Studies: Geographical Distribution of Enrolled Patient Population
- Figure 13.1 Global Demand for Bioavailability Enhancement Technologies and Services, till 2035 (In Terms of Number of Projects)
- Figure 13.2 Demand for Bioavailability Enhancement Technologies and Services: Distribution by Drug Class, Current Year and 2035
- Figure 13.3 Demand for Bioavailability Enhancement Technologies and Services for New Drug Approvals, till 2035 (In Terms of Number of Projects)
- Figure 13.4 Demand for Bioavailability Enhancement Technologies and Services for Generics, till 2035 (In Terms of Number of Projects)
- Figure 13.5 Demand for Bioavailability Enhancement Technologies and Services: Distribution by BCS Classification, Current Year and 2035
- Figure 13.6 Demand for Bioavailability Enhancement Technologies and Services for BCS II Drugs, till 2035 (In Terms of Number of Projects)
- Figure 13.7 Demand for Bioavailability Enhancement Technologies and Services for BCS IV Drugs, till 2035 (In Terms of Number of Projects)
- Figure 13.8 Demand for Bioavailability Enhancement Technologies and Services: Distribution by Dosage Form, Current Year and 2035
- Figure 13.9 Demand for Bioavailability Enhancement Technologies and Services for Liquids, till 2035 (In Terms of Number of Projects)
- Figure 13.10 Demand for Bioavailability Enhancement Technologies and Services for Solids, till 2035 (In Terms of Number of Projects)
- Figure 13.11 Demand for Bioavailability Enhancement Technologies and Services for Semi-Solids, till 2035 (In Terms of Number of Projects)
- Figure 13.12 Demand for Bioavailability Enhancement Technologies and Services for Fine Particles / Powders, till 2035 (In Terms of Number of Projects)
- Figure 13.13 Demand for Bioavailability Enhancement Technologies and Services for Other Dosage Forms, till 2035 (In Terms of Number of Projects)
- Figure 14.1 Global Bioavailability Enhancement Services Market, till 2035 (USD Billion)
- Figure 14.2 Bioavailability Enhancement Services Market: Distribution by Drug Class, Current Year and 2035
- Figure 14.3 Bioavailability Enhancement Services Market for New Drug Approvals, till 2035 (USD Billion)
- Figure 14.4 Bioavailability Enhancement Services Market for Generics, till 2035 (USD Billion)
- Figure 14.5 Bioavailability Enhancement Services Market, Current Year and 2035: Distribution by BCS Classification, Current Year and 2035
- Figure 14.6 Bioavailability Enhancement Services Market for BCS II Drugs, till 2035 (USD Billion)
- Figure 14.7 Bioavailability Enhancement Services Market for BCS IV Drugs, till 2035 (USD Billion)
- Figure 14.8 Bioavailability Enhancement Services Market, Current Year and 2035: Distribution by Bioavailability Enhancement Approach, Current Year and 2035
- Figure 14.9 Bioavailability Enhancement Services Market for Lipid Based Approaches, till 2035 (USD Billion)
- Figure 14.10 Bioavailability Enhancement Services Market for Size Reduction Based Approaches, till 2035 (USD Billion)
- Figure 14.11 Bioavailability Enhancement Services Market for Solid Dispersion Based Approaches, till 2035 (USD Billion)
- Figure 14.12 Bioavailability Enhancement Services Market for Other Bioavailability Enhancement Approaches, till 2035 (USD Billion)
- Figure 14.13 Bioavailability Enhancement Services Market: Distribution by Dosage Form, Current Year and 2035
- Figure 14.14 Bioavailability Enhancement Services Market for Liquids, till 2035 (USD Billion)
- Figure 14.15 Bioavailability Enhancement Services Market for Solids, till 2035 (USD Billion)
- Figure 14.16 Bioavailability Enhancement Services Market for Semi-Solids, till 2035 (USD Billion)
- Figure 14.17 Bioavailability Enhancement Services Market for Fine Particles / Powders, till 2035 (USD Billion)
- Figure 14.18 Bioavailability Enhancement Services Market for Other Dosage Forms, till 2035 (USD Billion)
- Figure 14.19 Bioavailability Enhancement Services Market: Distribution by Key Geographies, Current Year and 2035
- Figure 14.20 Bioavailability Enhancement Services Market in North America, till 2035 (USD Billion)
- Figure 14.21 Bioavailability Enhancement Services Market in Europe, till 2035 (USD Billion)
- Figure 14.22 Bioavailability Enhancement Services Market in Asia, till 2035 (USD Billion)
- Figure 14.23 Bioavailability Enhancement Services Market in Latin America, till 2035 (USD Billion)
- Figure 14.24 Bioavailability Enhancement Services Market in Middle East and North Africa, till 2035 (USD Billion)
- Figure 14.25 Bioavailability Enhancement Services Market in Rest of the World, till 2035 (USD Billion)
- Figure 14.26 Bioavailability Enhancement Services Market: Conservative, Base and Optimistic Scenarios (USD Billion)
- Figure 15.1 Technologies based on Solid Dispersion Approaches: Trends in Intellectual Capital
- Figure 15.2 Technologies based on Solid Dispersion Approaches: Trends in Research Activity
- Figure 15.3 Technologies based on Size Reduction Approaches: Trends in Intellectual Capital
- Figure 15.4 Technologies based on Size Reduction Approaches: Trends in Research Activity
- Figure 15.5 Technologies based on Lipid-based Approaches: Trends in Intellectual Capital
- Figure 15.6 Technologies based on Lipid-based Approaches: Trends in Research Activity
- Figure 15.7 Technology Evaluation Framework: Value Addition Matrix
- Figure 15.8 Technology Evaluation Matrix
- Figure 16.1 Concluding Remarks: Overall Market Landscape of Bioavailability Enhancement Service Providers
- Figure 16.2 Concluding Remarks: Overall Market Landscape of Bioavailability Enhancement Technologies
- Figure 16.3 Concluding Remarks: Partnerships and Collaborations
- Figure 16.4 Concluding Remarks: Publication Analysis
- Figure 16.5 Concluding Remarks: Patent Analysis
- Figure 16.6 Concluding Remarks: Clinical Trial Analysis
- Figure 16.7 Concluding Remarks: Demand Analysis
- Figure 16.8 Concluding Remarks: Market Forecast

