
PUBLISHER: Roots Analysis | PRODUCT CODE: 1682705

PUBLISHER: Roots Analysis | PRODUCT CODE: 1682705
Oral Solid Dosage Manufacturing Market by Type of Finished Dosage Form, Type of Packaging, Scale of Operation, Company Size, Therapeutic Area, and Key Geographical Regions : Industry Trends and Global Forecasts, Till 2035
ORAL SOLID DOSAGE CONTRACT MANUFACTURING MARKET: OVERVIEW
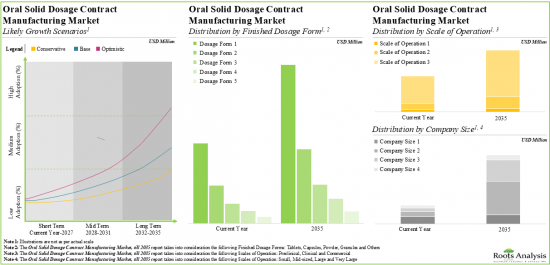
As per Roots Analysis, the global oral solid dosage contract manufacturing market is estimated to grow from USD 22.5 billion in the current year to USD 36.52 billion by 2035, at a CAGR of 4.49% during the forecast period, till 2035.
The market sizing and opportunity analysis has been segmented across the following parameters:
Type of Finished Dosage Form
- Tablets
- Capsules
- Powders
- Multi-particulates
- Others
Type of Packaging
- Bottles
- Blisters
- Sachets
- Inhalers
- Others
Scale of Operation
- Pre-commercial
- Commercial
Company Size
- Small
- Mid-sized
- Large
- Very Large
Therapeutic Area
- Oncological Disorders
- Infectious Diseases
- Cardiovascular Disorders
- Metabolic Disorders
- Neurological Disorders
- Genetic Disorders
- Respiratory Disorders
- Immunological Disorders
- Other Disorders
Key Geographical Regions
- North America
- Europe
- Asia-Pacific
- Latin America
- Middle East and North Africa
ORAL SOLID DOSAGE CONTRACT MANUFACTURING MARKET: GROWTH AND TRENDS
Despite several novel dosage forms being introduced into the pharmaceutical and nutraceutical sectors, oral solid drugs (OSD), particularly tablets and capsules, continue to be the most popular and widely used delivery forms. This is due to the fact that these formulations offer various advantages, including self-administration, stability, cost-effectiveness, convenience of handling, transportation and patient compliance. This mature yet high-value vertical of the overall pharmaceutical industry represents about 90% of the global market share of all formulations intended for human use.
However, OSD manufacturing operations is a complex process requiring specialized equipment and facilities, highly contained working environments and experts with multidisciplinary knowledge. Further, recent evolution to address the upstream bottlenecks associated with active pharmaceutical ingredients (API), such as poor bioavailability, low solubility, bitter taste and high potency, necessitate extensive technical expertise. As a result, drug developers are increasingly relying on contract service providers to leverage their capabilities and yield cost savings opportunities. Unlike drug developers, the capabilities of these third-party service providers are usually more focused on their respective service portfolios. They support pharmaceutical companies with specialized capabilities ranging from process and formulation development to drug substance characterization, analytical method development, and regulatory filings, as well as capacity for clinical and commercial manufacturing. Considering the growing trend of outsourcing and the ongoing efforts of service providers to improve / expand their offerings, it is anticipated that the oral solid dosage contract manufacturing market is likely to evolve at a steady pace, in the mid to long term.
ORAL SOLID DOSAGE CONTRACT MANUFACTURING MARKET: KEY INSIGHTS
The report delves into the current state of the oral solid dosage contract manufacturing market and identifies potential growth opportunities within the industry. Some key findings from the report include:
1. Presently, over 300 companies claim to have the required expertise to offer contract manufacturing services for a broad spectrum of oral solid dosage forms, including modified release formulations of tablets and capsules.
2. Nearly 30% of the players have established end-to-end capabilities, from early development to packaging of oral solids in a variety of containers; this simplifies supplier management activities for sponsor companies.
3. The current market landscape features the presence of both established and emerging players engaged in the manufacturing of oral solid dosages at various scales of operation, in compliance with the regulatory standards.
4. With more than 1,350 facilities, oral solid contract manufacturers have established global presence; majority of these players are based in the Asia-Pacific region, primarily in countries, such as China and India.
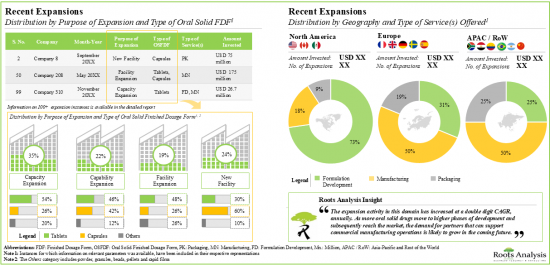
5. As part of their growth strategy, CMOs are investing in either expanding their existing facilities / capabilities or building facilities in other regions; majority of these initiatives were undertaken in North America.
6. The global installed oral solid dosage contract manufacturing capacity is spread across various geographies; over 30% of this capacity is dedicated to the manufacturing of tablets on a commercial scale.
7. The demand for oral solid dosage contract manufacturing is rising significantly owing to the growing complexity of APIs; by 2035, it is anticipated to reach over 35,000 metric tonnes, across clinical and commercial scales.
8. Driven by volume shifts from originators to generics and over-investments to create safety buffers, the contract manufacturing domain is currently witnessing an excess in capacity, thereby propelling consolidation efforts.
9. Over 65% of the market is expected to be captured by revenues from manufacturing anti-cancer drugs, including those based on HPAPIs; furthermore, North America based players are likely to contribute majorly to this domain.
ORAL SOLID DOSAGE CONTRACT MANUFACTURING MARKET: KEY SEGMENTS
Tablets Occupy the Largest Share of the Oral Solid Dosage Contract Manufacturing Market
Based on the type of finished dosage form, the market is segmented into tablets, capsules, powders, multi-particulates and others. At present, tablets hold the maximum share of the oral solid dosage contract manufacturing market. This trend is likely to remain the same in the forthcoming years.
Blisters Segment is the Fastest Growing Segment of the Oral Solid Dosage Contract Manufacturing Market During the Forecast Period
Based on the type of packaging, the market is segmented into blisters, sachets, inhalers, bottles and others. Currently, bottles capture the highest proportion of the oral solid dosage contract manufacturing market. It is worth highlighting that the oral solid dosage contract manufacturing market for blisters is likely to grow at a relatively higher CAGR.
By Scale of Operation, Commercial Scale is Likely to Dominate the Oral Solid Dosage Contract Manufacturing Market
Based on the scales of operation, the market is segmented into pre-commercial and commercial scale. Whilst commercial scale manufacturing is expected to be the primary driver of the overall market, it is worth highlighting that the oral solid dosage contract manufacturing market at pre-commercial scale is likely to grow at a relatively higher CAGR.
Very Large Companies Occupy the Largest Share of the Oral Solid Dosage Contract Manufacturing Market
Based on the company size, the market is segmented into small, mid-sized, large and very large companies. At present, very large companies hold the maximum share of the oral solid dosage contract manufacturing market. This trend is unlikely to change in the foreseeable future.
Oncological Disorders Account for the Largest Share of the Oral Solid Dosage Contract Manufacturing Market
Based on the therapeutic areas, the market is segmented into oncological disorders, neurological disorders, cardiovascular disorders, infectious diseases, metabolic disorders, respiratory disorders, immunological disorders, genetic disorders, gastrointestinal disorders, other disorders. Currently, oncological disorders hold the maximum share of the oral solid dosage contract manufacturing market. This trend is likely to remain the same in the coming decade.
North America Accounts for the Largest Share of the Market
Based on key geographical regions, the market is segmented into North America, Europe, Asia-Pacific, Latin America, and Middle East and North Africa. The majority share is expected to be captured by players based in North America and Asia-Pacific.
Example Players in the Oral Solid Dosage Contract Manufacturing Market
- Aenova
- Alcami
- Almac
- Cambrex
- Hetero Drugs
- Ind-Swift
- Laboratories
- Lonza
- Rubicon Research
ORAL SOLID DOSAGE CONTRACT MANUFACTURING MARKET: RESEARCH COVERAGE
- Market Sizing and Opportunity Analysis: The report features an in-depth analysis of the oral solid dosage contract manufacturing market, focusing on key market segments, including [A] type of finished dosage form, [B] type of packaging, [C] scale of operation, [D] company size, [E] therapeutic area and [F] key geographical regions.
- Market Landscape: A comprehensive evaluation of companies offering contract services for oral solid dosage form, considering various parameters, such as [A] year of establishment, [B] company size (in terms of the number of employees), [C] location of headquarters, [D] company ownership, [E] type of service(s) offered, [F] type of finished dosage form(s) manufactured, [G] type of packaging offered, [H] scale(s) of operation and [I] additional manufacturing capabilities.
- Company Competitiveness Analysis: A comprehensive competitive analysis of oral solid dosage contract manufacturing service providers, examining factors, such as [A] supplier strength and [B] service strength.
- Regional Capability Analysis: A comprehensive regional capability assessment framework the oral solid dosage contract manufacturers that evaluates key geographies by various parameters, including [A] type of service(s) offered, [B] type of finished dosage form(s) manufactured, [C] type of packaging offered, [D] scale(s) of operation and [E] location of manufacturing facilities of the service providers.
- Company Profiles: In-depth profiles of key oral solid dosage contract manufacturers, focusing on [A] company overviews, [B] financial information (if available), [C] oral solid dosage service portfolio, [D] manufacturing capabilities and facilities, [E] recent developments and [F] an informed future outlook.
- Make Versus Buy Decision Framework: An insightful framework that emphasizes the key indicators and factors that need to be considered by oral solid dosage drug developers to determine whether to manufacture their respective products in-house or outsource the manufacturing operation to contract service providers.
- Recent Expansions: An examination of the different expansion efforts made by service providers in this field to enhance their manufacturing capabilities. This analysis considers various factors, including the [A] year of expansion, [B] purpose of expansion, [C] type of an estimate of the global installed capacity (in terms of number of oral solid units and volume of API) for the manufacturing of oral solids, based on information provided by various industry stakeholders in the public domain. It also features the distribution of the available capacity on the basis of [D] company size, [E] scale of operation, [F] type of finished dosage form and [G] key geographical regions. Overall, the analysis represents a holistic view of the supply-side of the market, allowing us to present an informed opinion on whether the present capacity will be able to meet the likely future demand.
- Demand Analysis: Informed estimates of the annual commercial and clinical demand for oral solid doses based on several relevant parameters, such as [A] key geographical regions and [B] therapeutic areas.
- Total Cost of Ownership: A detailed analysis of the total cost of ownership for an oral solid dosage contract manufacturing service provider, highlighting the expenses associated with the establishment and maintenance of an oral solid dosage manufacturing facility, over a period of 20 years.
- Regulatory Landscape: A discussion on general regulatory guidelines laid down by major regulatory bodies, across different countries, featuring an elaborative assessment of several CMOs engaged in this domain, along with information on their operational approvals, certifications received, and relative popularity of the key regulatory body. Additionally, the chapter features an insightful multi-dimensional bubble analysis, presenting a comparison of the current regulatory scenario in key geographies.
- Case Study 1: A general discussion on taste masking service providers for oral solids, providing information on [A] scale of operation, [B] manufacturing scalability, other service(s) offered along with information on [C] type of formulation, [D] end users, [E] techniques used for taste masking, [F] branch of healthcare and [G] regional capability. Further, the chapter includes the current market landscape of taste masking technology providers, providing information on [H] technology name, [I] techniques used, [J] type of finished dosage form, [K] end users along with information on patent, availability of technology for partnerships and licensing. In addition, the chapter provides details on the [L] year of establishment, [M] company size and [N] location of headquarters.
- Case Study 2: A general discussion on drug bioavailability enhancement service providers for oral solids, based on several relevant parameters, such as [A] year of establishment, [B] company size (in terms of number of employees), [C] location of headquarters, [D] bioavailability enhancement principle supported, [E] bioavailability enhancement approach employed, including [E1] solid dispersion, [E2] size reduction, [E3] lipid-based, and [E4] other bioavailability enhancement approaches, [F] type of dosage form supported (solids, fine particles and semi-solids).
KEY QUESTIONS ANSWERED IN THIS REPORT
- How many companies are currently engaged in this market?
- Which are the leading companies in this market?
- What factors are likely to influence the evolution of this market?
- What is the current and future market size?
- What is the CAGR of this market?
- How is the current and future market opportunity likely to be distributed across key market segments?
REASONS TO BUY THIS REPORT
- The report provides a comprehensive market analysis, offering detailed revenue projections of the overall market and its specific sub-segments. This information is valuable to both established market leaders and emerging entrants.
- Stakeholders can leverage the report to gain a deeper understanding of the competitive dynamics within the market. By analyzing the competitive landscape, businesses can make informed decisions to optimize their market positioning and develop effective go-to-market strategies.
- The report offers stakeholders a comprehensive overview of the market, including key drivers, barriers, opportunities, and challenges. This information empowers stakeholders to stay abreast of market trends and make data-driven decisions to capitalize on growth prospects.
ADDITIONAL BENEFITS
- Complimentary PPT Insights Packs
- Complimentary Excel Data Packs for all Analytical Modules in the Report
- 10% Free Content Customization
- Detailed Report Walkthrough Session with Research Team
- Free Updated report if the report is 6-12 months old or older
TABLE OF CONTENTS
1. PREFACE
- 1.1. Introduction
- 1.2. Key Market Insights
- 1.3. Scope of the Report
- 1.4. Research Methodology
- 1.5. Frequently Asked Questions
- 1.6. Chapter Outlines
2. EXECUTIVE SUMMARY
3. INTRODUCTION
- 3.1. Chapter Overview
- 3.2. Type of Dosage Forms
- 3.3. Overview of Oral Solid Dosage Forms
- 3.3.1. Components of Oral Solid Dosage Forms
- 3.3.2. Classification of Oral Solid Dosage Forms
- 3.3.3. Manufacturing of Oral Solid Dosage Forms
- 3.3.4. Emerging Trends in Oral Solid Dosage Manufacturing
- 3.4. Overview of Oral Solid Contract Manufacturing
- 3.4.1. Services Offered by CMOs and CDMOs for Oral Solid Manufacturing
- 3.4.2. Key Considerations While Selecting a CDMO or CMO Partner
- 3.4.3.Risks and Challenges Associated with Outsourcing Pharmaceutical Manufacturing Operations
- 3.5. Future Perspectives
4. ORAL SOLID DOSAGE CONTRACT MANUFACTURING ORGANIZATIONS (CMOs): MARKET LANDSCAPE
- 4.1. Chapter Overview
- 4.2. Oral Solid Dosage CMOs: List of Companies
- 4.2.1. Analysis by Year of Establishment
- 4.2.2. Analysis by Company Size
- 4.2.3. Analysis by Location of Headquarters
- 4.2.4. Analysis by Company Ownership
- 4.2.5. Analysis by Type of Service(s) Offered
- 4.2.6. Analysis by Type of Finished Dosage Form
- 4.2.7. Analysis by Type of Tablet(S) Manufactured
- 4.2.8. Analysis by Type of Capsule(s) Manufactured
- 4.2.9. Analysis by Type of Multi-particulate(s) Manufactured
- 4.2.10. Analysis by Type of Primary Packaging Offered
- 4.2.11. Analysis by Scale of Operation
- 4.2.12. Analysis by High Potency Drug Manufacturing
- 4.2.13. Analysis by Availability of Continuous Manufacturing
- 4.2.14. Analysis by Regulatory Certifications / Accreditations
5. COMPANY COMPETITIVENESS ANALYSIS
- 5.1. Chapter Overview
- 5.2. Assumptions and Key Parameters
- 5.3. Methodology
- 5.4. Company Competitiveness Analysis: Oral Solid Dosage Contract Manufacturers in North America
- 5.4.1. Peer Group I: Companies in the US
- 5.4.2. Peer Group II: Companies in Canada
- 5.5. Company Competitiveness Analysis: Oral Solid Dosage Contract Manufacturers based in Europe
- 5.5.1. Peer Group III: Companies in EU5
- 5.5.2. Peer Group IV: Other European Countries
- 5.6. Company Competitiveness Analysis: Oral Solid Contract Manufacturers based in Asia-Pacific and Rest of the World
- 5.6.1. Peer Group V: Companies in India
- 5.6.2. Peer Group VI: Companies in China
- 5.6.3. Peer Group VII: Companies in Japan
- 5.6.4. Peer Group VIII: Companies in Other Asia-Pacific and rest of the World
- 5.7. Company Competitiveness Analysis of Oral Solid Dosage Contract Manufacturers: Competitiveness Score of Top Service Providers
6. REGIONAL CAPABILITY ANALYSIS
- 6.1. Chapter Overview
- 6.2. Key Assumptions and Methodology
- 6.3. Overall Landscape of Oral Solid Dosage Contract Manufacturing Facilities
- 6.4. Oral Solid Dosage Contract Manufacturers in North America
- 6.5. Oral Solid Dosage Contract Manufacturers in Europe
- 6.6. Oral Solid Dosage Contract Manufacturers in Asia-Pacific and Rest of the World
7. COMPANY PROFILES
- 7.1. Chapter Overview
- 7.2. Oral Solid Dosage Contract Manufacturing Service Providers: North America
- 7.2.1. Alcami
- 7.2.1.1. Company Overview
- 7.2.1.2. Service Portfolio
- 7.2.1.2.1. Manufacturing Capabilities and Facilities
- 7.2.1.3. Recent Developments and Future Outlook
- 7.2.2. Cambrex
- 7.2.2.1. Company Overview
- 7.2.2.2. Service Portfolio
- 7.2.2.2.1. Manufacturing Capabilities and Facilities
- 7.2.2.3. Recent Developments and Future Outlook
- 7.2.3. Catalent
- 7.2.3.1. Company Overview
- 7.2.3.2. Financial Information
- 7.2.3.3. Service Portfolio
- 7.2.3.3.1. Manufacturing Capabilities and Facilities
- 7.2.3.4. Recent Developments and Future Outlook
- 7.2.1. Alcami
- 7.3. Oral Solid Dosage Contract Manufacturing Service Providers: Europe
- 7.3.1. Aenova
- 7.3.1.1. Company Overview
- 7.3.1.2. Financial Information
- 7.3.1.3. Service Portfolio
- 7.3.1.3.1. Manufacturing Capabilities and Facilities
- 7.3.1.4. Recent Developments and Future Outlook
- 7.3.2. Almac
- 7.3.2.1. Company Overview
- 7.3.2.2. Financial Information
- 7.3.2.3. Service Portfolio
- 7.3.2.3.1. Manufacturing Capabilities and Facilities
- 7.3.2.4. Recent Developments and Future Outlook
- 7.3.3. Lonza
- 7.3.3.1. Company Overview
- 7.3.3.2. Financial Information
- 7.3.3.3. Service Portfolio
- 7.3.3.3.1. Manufacturing Capabilities and Facilities
- 7.3.3.4. Recent Developments and Future Outlook
- 7.3.1. Aenova
- 7.4. Oral Solid Dosage Contract Manufacturing Service Providers: Asia-Pacific and Rest of the World
- 7.4.1. Hetero Drugs
- 7.4.1.1. Company Overview
- 7.4.1.2. Service Portfolio
- 7.4.1.2.1. Manufacturing Capabilities and Facilities
- 7.4.1.3. Recent Developments and Future Outlook
- 7.4.2. Ind-Swift Laboratories
- 7.4.2.1. Company Overview
- 7.4.2.2. Financial Information
- 7.4.2.3. Service Portfolio
- 7.4.2.3.1. Manufacturing Capabilities and Facilities
- 7.4.2.4. Recent Developments and Future Outlook
- 7.4.3. Rubicon Research
- 7.4.3.1. Company Overview
- 7.4.3.2. Service Portfolio
- 7.4.3.2.1. Manufacturing Capabilities and Facilities
- 7.4.3.3. Recent Developments and Future Outlook
- 7.4.1. Hetero Drugs
8. MAKE VERSUS BUY DECISION FRAMEWORK
- 8.1. Chapter Overview
- 8.2. Assumptions and Key Parameters
- 8.3. Oral Solid Dosage Manufacturers: Make versus Buy Decision Making
- 8.3.1. Scenario 1
- 8.3.2. Scenario 2
- 8.3.3. Scenario 3
- 8.3.4. Scenario 4
- 8.4. Concluding Remarks
9. RECENT EXPANSIONS
- 9.1. Chapter Overview
- 9.2. Oral Solid Dosage Contract Manufacturers: Recent Expansions
- 9.2.1. Analysis by Year of Expansion
- 9.2.2. Analysis by Type of Expansion
- 9.2.3. Analysis by Year and Type of Expansion
- 9.2.4. Analysis by Type of Oral Solid Dosage Form(s) Involved
- 9.2.5. Analysis by Type of Expansion and Oral Solid Dosage Form(s) Involved
- 9.2.6. Analysis by Type of Service(s) Offered
- 9.2.7. Analysis by Scales of Operation
- 9.2.8. Analysis by Location of Facility
- 9.2.9. Expansions Focused on Highly Potent Compounds
10. CAPACITY ANALYSIS
- 10.1. Chapter Overview
- 10.2. Key Assumptions and Methodology
- 10.2.1. Oral Solid Dosage Contract Manufacturing: Annual Global Capacity (Number of Finished Dosages)
- 10.2.1.1. Analysis by Company Size
- 10.2.1.2. Analysis by Scale of Operation
- 10.2.1.3. Analysis by Type of Finished Dosage Form
- 10.2.1.4. Analysis by Location of Manufacturing Facility
- 10.2.1.5. Analysis by Company Size and Type of Finished Dosage Form
- 10.2.1.6. Analysis by Company Size and Location of Manufacturing Facility
- 10.2.1.7. Analysis by Scale of Operation and Location of Manufacturing Facility
- 10.2.2. Oral Solid Dosage Contract Manufacturing: Annual Global Capacity (Amount of API)
- 10.2.2.1. Analysis by Company Size
- 10.2.2.2. Analysis by Scale of Operation
- 10.2.2.3. Analysis by Type of Finished Dosage Form
- 10.2.2.4. Analysis by Company Size and Type of Finished Dosage Form
- 10.2.2.5. Analysis by Company Size and Location of Manufacturing Facility
- 10.2.2.6. Analysis by Scale of Operation and Location of Manufacturing Facility
- 10.2.1. Oral Solid Dosage Contract Manufacturing: Annual Global Capacity (Number of Finished Dosages)
11. DEMAND ANALYSIS
- 11.1. Chapter Overview
- 11.2. Key Assumptions and Methodology
- 11.3. Overall Annual Demand for Oral Solids, till 2035
- 11.4. Annual Outsourced Commercial Demand for Oral Solids, till 2035
- 11.4.1. Annual Outsourced Commercial Demand for Oral Solids: Distribution by Geography, Current Year and 2035
- 11.4.1.1. Annual Outsourced Commercial Demand for Oral Solids in North America, till 2035
- 11.4.1.2. Annual Outsourced Commercial Demand for Oral Solids in Europe, till 2035
- 11.4.1.3. Annual Outsourced Commercial Demand for Oral Solids in Asia-Pacific and Rest of the World, till 2035
- 11.4.2. Annual Outsourced Commercial Demand for Oral Solids: Distribution by Therapeutic Area, Current Year and 2035
- 11.4.2.1. Annual Outsourced Commercial Demand for Oral Solids for Oncological Disorders, till 2035
- 11.4.2.2. Annual Outsourced Commercial Demand for Oral Solids for Infectious Diseases, till 2035
- 11.4.2.3. Annual Outsourced Commercial Demand for Oral Solids for Cardiovascular Disorders, till 2035
- 11.4.2.4. Annual Outsourced Commercial Demand for Oral Solids for Metabolic Disorders, till 2035
- 11.4.2.5. Annual Outsourced Commercial Demand for Oral Solids for Neurological Disorders, till 2035
- 11.4.2.6. Annual Outsourced Commercial Demand for Oral Solids for Genetic Disorders, till 2035
- 11.4.2.7. Annual Outsourced Commercial Demand for Oral Solids for Respiratory Disorders, till 2035
- 11.4.2.8. Annual Outsourced Commercial Demand for Oral Solids for Immunological Disorders, till 2035
- 11.4.2.9. Annual Outsourced Commercial Demand for Oral Solids for Other Disorders, till 2035
- 11.4.1. Annual Outsourced Commercial Demand for Oral Solids: Distribution by Geography, Current Year and 2035
- 11.5. Annual Outsourced Clinical Demand for Oral Solids, till 2035
- 11.5.1. Annual Outsourced Clinical Demand for Oral Solids: Distribution by Trial Phase, till 2035
- 11.5.1.1. Annual Outsourced Clinical Demand for Oral Solids in Phase I Trials, till 2035
- 11.5.1.2. Annual Outsourced Clinical Demand for Oral Solids in Phase II Trials, till 2035
- 11.5.1.3. Annual Outsourced Clinical Demand for Oral Solids in Phase III Trials, till 2035
- 11.5.1. Annual Outsourced Clinical Demand for Oral Solids: Distribution by Trial Phase, till 2035
- 11.6. Correlation between Annual Demand and Capacity
12. TOTAL COST OF OWNERSHIP FOR ORAL SOLID DOSAGE CONTRACT MANUFACTURING ORGANIZATIONS
- 12.1. Chapter Overview
- 12.2. Key Parameters
- 12.3. Assumptions and Methodology
- 12.4. Sample Dataset for the Estimation of Total Cost of Ownership
- 12.5. Total Cost of Ownership for Oral Solid Dosage Contract Manufacturing Organizations, Y0-Y20
- 12.6. Total Cost of Ownership for Oral Solid Dosage Contract Manufacturing Organizations: Analysis by CapEx and OpEx, Y0 and Y20
- 12.6.1. Total Cost of Ownership for Oral Solid Contract Manufacturing Organizations: Analysis by CapEx, Y0
- 12.6.2. Total Cost of Ownership for Oral Solid Dosage Contract Manufacturing Organizations: Analysis by OpEx, Y0-Y20
- 12.7. Concluding Remarks
13. REGULATORY LANDSCAPE FOR ORAL SOLID DOSAGE CONTRACT MANUFACTURERS
- 13.1. Chapter Overview
- 13.2. Regulatory Guidelines in North America
- 13.2.1. The US Scenario
- 13.2.1. Canadian Scenario
- 13.3. Regulatory Guidelines in Europe
- 13.4. Regulatory Guidelines in Asia-Pacific and Rest of the World
- 13.4.1. Chinese Scenario
- 13.4.2. Indian Scenario
- 13.4.3. Japanese Scenario
- 13.4.4. South Korean Scenario
- 13.4.5. Australian Scenario
- 13.4.6. Brazilian Scenario
- 13.5. Oral Solid Dosage CMOs: Information on Approval From Various Regulatory Authorities
- 13.6. Bubble Analysis: Regional Regulatory Summary
14. CASE STUDY ON TASTE MASKING SERVICES AND TECHNOLOGIES: MARKET LANDSCAPE
- 14.1. Chapter Overview
- 14.2. Taste Masking and Taste Assessment Service Providers
- 14.2.1. Analysis by Year of Establishment
- 14.2.2. Analysis by Company Size
- 14.2.3. Analysis by Location of Headquarters
- 14.2.4. Analysis by Year of Establishment and Location of Headquarters
- 14.3. Taste Masking and Taste Assessment Services: Overall Market Landscape
- 14.3.1. Analysis by Service(s) Offered
- 14.3.2. Analysis by Scale of Operation
- 14.3.3. Analysis by Other Service(s) Offered
- 14.3.4. Analysis by Type of Formulation(s)
- 14.3.5. Analysis by End Users
- 14.3.6. Analysis by Techniques Used for Taste Masking
- 14.3.7. Analysis by Branch of Healthcare
- 14.3.8. Analysis by Regional Capability
15. CASE STUDY ON BIOAVAILABILITY ENHANCEMENT TECHNOLOGIES: MARKET LANDSCAPE
- 15.1. Chapter Overview
- 15.2. Bioavailability Enhancement Service Providers: Overall Market Landscape
- 15.2.1. Analysis by Year of Establishment
- 15.2.2. Analysis by Company Size
- 15.2.3. Analysis by Location of Headquarters
- 15.2.4. Analysis by Bioavailability Enhancement Principle
- 15.2.5. Analysis by Bioavailability Enhancement Approach
- 15.2.5.1. Analysis by Solid Dispersion Approaches
- 15.2.5.2. Analysis by Size Reduction Approaches
- 15.2.5.3. Analysis by Lipid-Based Approaches
- 15.2.5.4. Analysis by Other Bioavailability Enhancement Approaches
- 15.2.6. Analysis by Dosage Form
- 15.2.7. Analysis by Route of Administration
16. MARKET FORECAST
- 16.1. Chapter Overview
- 16.2. Forecast Methodology and Key Assumptions
- 16.2.1. Overall Oral Solid Dosage Contract Manufacturing Market, till 2035
- 16.2.2. Oral Solid Dosage Contract Manufacturing Market, till 2035: Distribution by Type of Finished Dosage Form
- 16.2.2.1. Oral Solid Dosage Contract Manufacturing Market for Tablets, till 2035
- 16.2.2.2. Oral Solid Dosage Contract Manufacturing Market for Capsules, till 2035
- 16.2.2.3. Oral Solid Dosage Contract Manufacturing Market for Powders, till 2035
- 16.2.2.4. Oral Solid Dosage Contract Manufacturing Market for Multi-particulates, till 2035
- 16.2.2.5. Oral Solid Dosage Contract Manufacturing Market for Other Finished Dosage Forms, till 2035
- 16.2.3. Oral Solid Dosage Contract Manufacturing Market, till 2035: Distribution by Type of Packaging
- 16.2.3.1. Oral Solid Dosage Contract Manufacturing Market for Bottles, till 2035
- 16.2.3.2. Oral Solid Dosage Contract Manufacturing Market for Blisters, till 2035
- 16.2.3.3. Oral Solid Dosage Contract Manufacturing Market for Inhalers, till 2035
- 16.2.3.4. Oral Solid Dosage Contract Manufacturing Market for Sachets, till 2035
- 16.2.3.5. Oral Solid Dosage Contract Manufacturing Market for Strips, till 2035
- 16.2.3.6. Oral Solid Dosage Contract Manufacturing Market for Stick Packs, till 2035
- 16.2.4. Oral Solid Dosage Contract Manufacturing Market, till 2035: Distribution by Scale of Operation
- 16.2.4.1. Oral Solid Dosage Contract Manufacturing Market for Pre-Commercial Scale, till 2035
- 16.2.4.2. Oral Solid Dosage Contract Manufacturing Market for Commercial Scale, till 2035
- 16.2.5. Oral Solid Dosage Contract Manufacturing Market, till 2035: Distribution by Company Size
- 16.2.5.1. Oral Solid Dosage Contract Manufacturing Market for Small Companies, till 2035
- 16.2.5.2. Oral Solid Dosage Contract Manufacturing Market for Mid-sized Companies, till 2035
- 16.2.5.3. Oral Solid Dosage Contract Manufacturing Market for Large Companies, till 2035
- 16.2.5.4. Oral Solid Dosage Contract Manufacturing Market for Very Large Companies, till 2035
- 16.2.6. Oral Solid Dosage Contract Manufacturing Market, till 2035: Distribution by Therapeutic Area
- 16.2.6.1. Oral Solid Dosage Contract Manufacturing Market for Oncological Disorders, till 2035
- 16.2.6.2. Oral Solid Dosage Contract Manufacturing Market for Infectious Diseases, till 2035
- 16.2.6.3. Oral Solid Dosage Contract Manufacturing Market for Cardiovascular Disorders, till 2035
- 16.2.6.4. Oral Solid Dosage Contract Manufacturing Market for Metabolic Disorders, till 2035
- 16.2.6.5. Oral Solid Dosage Contract Manufacturing Market for Neurological Disorders, till 2035
- 16.2.6.6. Oral Solid Dosage Contract Manufacturing Market for Genetic Disorders, till 2035
- 16.2.6.7. Oral Solid Dosage Contract Manufacturing Market for Respiratory Disorders, till 2035
- 16.2.6.8. Oral Solid Dosage Contract Manufacturing Market for Immunological Disorders, till 2035
- 16.2.6.9. Oral Solid Dosage Contract Manufacturing Market for Other Disorders, till 2035
- 16.2.7. Oral Solid Dosage Contract Manufacturing Market, till 2035: Distribution by Geographical Regions
- 16.2.7.1. Oral Solid Dosage Contract Manufacturing Market in North America, till 2035
- 16.2.7.2. Oral Solid Dosage Contract Manufacturing Market in Europe, till 2035
- 16.2.7.3. Oral Solid Dosage Contract Manufacturing Market in Asia-Pacific, till 2035
- 16.2.7.4. Oral Solid Dosage Contract Manufacturing Market in Latin America, till 2035
- 16.2.7.5. Oral Solid Dosage Contract Manufacturing Market in Middle East and North Africa, till 2035
17. EXECUTIVE INSIGHTS
18. CONCLUDING REMARKS
19. APPENDIX 1: TABULATED DATA
20. APPENDIX 2: LIST OF COMPANIES AND ORGANIZATIONS
List of Tables
- Table 3.1 Commonly Used Excipients in Tablet Formulation
- Table 3.2 Contrasting Characteristics: Film-coated and Sugar-coated Tablets
- Table 3.3 Contrasting Characteristics: Hard Gelatin and Soft Gelatin Capsules
- Table 4.1 Oral Solid Dosage Contract Manufacturing: List of Companies
- Table 4.2 Oral Solid Dosage Contract Manufacturers: Information on Service(s) Offered
- Table 4.3 Oral Solid Dosage Contract Manufacturers: Information on Type of Finished Dosage Form Manufactured
- Table 4.4 Oral Solid Dosage Contract Manufacturers: Information on Type of Tablets and Capsules Manufactured
- Table 4.5 Oral Solid Dosage Contract Manufacturers: Information on Type of Multi-particulate(s) Manufactured
- Table 4.6 Oral Solid Dosage Contract Manufacturers: Information on Type of Primary Packaging Offered
- Table 4.7 Oral Solid Dosage Contract Manufacturers: Information on Scale of Operation and Additional Manufacturing Capabilities
- Table 4.8 Oral Solid Dosage Contract Manufacturers: Information on Regulatory Certifications and Accreditations
- Table 6.1 Oral Solid Dosage Contract Manufacturers based in North America: Information on Headquarters, Year of Establishment, Company Size and Additional Manufacturing Capabilities
- Table 6.2 Oral Solid Dosage Contract Manufacturers based in North America: Information on Scale of Operation, Type of Dosage Form and Number of Manufacturing Facilities
- Table 6.3 Oral Solid Dosage Contract Manufacturers based in Europe: Information on Headquarters, Year of Establishment, Company Size and Additional Manufacturing Capabilities
- Table 6.4 Oral Solid Dosage Contract Manufacturers based in Europe: Information Scale of Operation, Type of Dosage Form and Number of Manufacturing Facilities
- Table 6.5 Oral Solid Dosage Contract Manufacturers based in Asia-Pacific and Rest of the World: Information on Headquarters, Year of Establishment, Company Size and Additional Manufacturing Capabilities
- Table 6.6 Oral Solid Dosage Contract Manufacturers based in Asia-Pacific and Rest of the World: Information on Scale of Operation, Type of Dosage Form and Number of Manufacturing Facilities
- Table 7.1 Oral Solid Dosage Contract Manufacturing Service Providers: List of Profiled Companies
- Table 7.2 Alcami: Company Snapshot
- Table 7.3 Alcami: Service Portfolio
- Table 7.4 Alcami: Recent Developments and Future Outlook
- Table 7.5 Cambrex: Company Snapshot
- Table 7.6 Cambrex: Service Portfolio
- Table 7.7 Cambrex: Oral Solid Manufacturing Facilities,
- Table 7.8 Cambrex: Recent Developments and Future Outlook
- Table 7.9 Catalent: Company Snapshot
- Table 7.10 Catalent: Service Portfolio
- Table 7.11 Catalent: Oral Solid Manufacturing Facilities
- Table 7.12 Catalent: Recent Developments and Future Outlook
- Table 7.13 Aenova: Company Snapshot
- Table 7.14 Aenova: Service Portfolio
- Table 7.15 Aenova: Oral Solid Manufacturing Facilities
- Table 7.16 Aenova: Recent Developments and Future Outlook
- Table 7.17 Almac: Company Snapshot
- Table 7.18 Almac: Service Portfolio
- Table 7.19 Almac: Oral Solid Manufacturing Facilities,
- Table 7.20 Almac: Recent Developments and Future Outlook
- Table 7.21 Lonza: Company Snapshot
- Table 7.22 Lonza: Service Portfolio
- Table 7.23 Lonza: Oral Solid Manufacturing Facilities
- Table 7.24 Lonza: Recent Developments and Future Outlook
- Table 7.25 Hetero Drugs: Company Snapshot
- Table 7.26 Hetero Drugs: Service Portfolio
- Table 7.27 Hetero Drugs: Recent Developments and Future Outlook
- Table 7.28 Ind-Swift Laboratories: Company Snapshot
- Table 7.29 Ind-Swift Laboratories: Service Portfolio
- Table 7.30 Ind-Swift Laboratories: Oral Solid Manufacturing Facilities
- Table 7.31 Rubicon Research: Company Snapshot
- Table 7.32 Rubicon Research: Service Portfolio
- Table 7.33 Rubicon Research: Oral Solid Manufacturing Facilities
- Table 9.1 Oral Solid Dosage Contract Manufacturers: List of Recent Expansions, since 2018
- Table 9.2 Recent Expansions: Information on Type of Oral Solid Dosage Form(s) Involved, Type of Service(s) Offered and Scale(s) of Operation, since 2018
- Table 10.1 Average Annual Oral Solid Dosage Contract Manufacturing Capacity (Distribution by Type of Finished Dosage Form): Sample Data Set
- Table 10.2 Average Annual Oral Solid Dosage Contract Manufacturing Capacity (Distribution by Company Size): Sample Data Set
- Table 10.3 Distribution by Amount of API in Various Types of Oral Solid Dosage Forms: Sample Data Set
- Table 10.4 Annual Global Oral Solid Dosage Contract Manufacturing Capacity (in terms of Number of Finished Dosages): Distribution by Company Size
- Table 11.1 Annual Outsourced Demand for Oral Solids, till 2035 (Metric Ton)
- Table 11.2 Demand and Supply Analysis: Information on Annual Capacity Utilization Rates
- Table 11.3 Annual Outsourced Demand (Base and Optimistic Scenarios): till 2035 (Metric Tons)
- Table 12.1 Total Cost of Ownership: Sample Dataset for CapEx
- Table 12.2 Total Cost of Ownership: Sample Dataset for OpEx
- Table 13.1 FDA Quality Agreement versus EMA cGMP Regulations: A Comparative Analysis
- Table 13.2 Health Canada's Good Manufacturing Practices Guidelines for Tablets and Capsules
- Table 13.3 Oral Solid Dosage CMOs: Information on Approval from Various Regulatory Authorities
- Table 13.4 Key Regulatory Authorities: Comparison of NDA Approval Characteristics
- Table 14.1 List of Taste Masking and Taste Assessment Service Providers
- Table 14.2 Taste Masking and Taste Assessment Services: Information on Service(s) Offered, Scale of Operation and Other Service(s) Offered
- Table 14.3 Taste Masking and Taste Assessment Services: Information on Type of Formulation
- Table 14.4 Taste Masking and Taste Assessment Services: Information on End Users, Techniques Used for Taste Masking, Branch of Healthcare and Regional Capability
- Table 15.1 List of Bioavailability Enhancement Service Providers
- Table 15.2 Bioavailability Enhancement Service Providers: Information on Bioavailability Enhancement Principle
- Table 15.3 Bioavailability Enhancement Service Providers: Information on Bioavailability Enhancement Approach
- Table 15.4 Bioavailability Enhancement Service Providers: Information on Solid Dispersion Approaches
- Table 15.5 Bioavailability Enhancement Service Providers: Information on Size Reduction Approaches
- Table 15.6 Bioavailability Enhancement Service Providers: Information on Lipid-Based Approaches
- Table 15.7 Bioavailability Enhancement Service Providers: Information on Other Approaches
- Table 15.8 Bioavailability Enhancement Service Providers: Information on Dosage Form, ,
- Table 15.9 Bioavailability Enhancement Service Providers: Information on Route of Administration
- Table 17.1 Bushu Pharmaceuticals: Key Highlights
- Table 19.1 Oral Solid Dosage Contract Manufacturers: Distribution by Year of Establishment
- Table 19.2 Oral Solid Dosage Contract Manufacturers: Distribution by Company Size
- Table 19.3 Oral Solid Dosage Contract Manufacturers: Distribution by Location of Headquarters
- Table 19.4 Oral Solid Dosage Contract Manufacturers: Distribution by Location of Headquarters (Country-wise)
- Table 19.5 Oral Solid Dosage Contract Manufacturers: Distribution by Company Ownership
- Table 19.6 Oral Solid Dosage Contract Manufacturers: Distribution by Types of Services Offered
- Table 19.7 Oral Solid Dosage Contract Manufacturers: Distribution by Type of Finished Dosage Form
- Table 19.8 Oral Solid Dosage Contract Manufacturers: Distribution by Type of Tablet(s) Manufactured
- Table 19.9 Oral Solid Dosage Contract Manufacturers: Distribution by Type of Capsule(s) Manufactured
- Table 19.10 Oral Solid Dosage Contract Manufacturers: Distribution by Type of Multi-particulate(s)
- Table 19.11 Oral Solid Dosage Contract Manufacturers: Distribution by Type of Primary Packaging Offered
- Table 19.12 Oral Solid Dosage Contract Manufacturers: Distribution by Scale of Operation
- Table 19.13 Oral Solid Dosage Contract Manufacturers: Distribution by High Potency Drug Manufacturing
- Table 19.14 Oral Solid Dosage Contract Manufacturers: Distribution by Availability of Continuous Manufacturing
- Table 19.15 Oral Solid Dosage Contract Manufacturers: Distribution by Regulatory Certifications and Accreditations
- Table 19.16 Catalent: Annual Revenues, FY 2017 Onwards (USD Billion)
- Table 19.17 Aenova: Annual Revenues, FY 2017 Onwards (EUR Million)
- Table 19.18 Almac: Annual Revenues, FY 2017 Onwards (GBP Million)
- Table 19.19 Lonza: Annual Revenues, FY 2017 Onwards (CHF Billion)
- Table 19.20 Ind-Swift Laboratories: Annual Revenues, FY 2017 Onwards (INR Billion)
- Table 19.21 Recent Expansions: Cumulative Year-wise Trend, since 2018
- Table 19.22 Recent Expansions: Distribution by Type of Expansion
- Table 19.23 Recent Expansions: Distribution by Year and Type of Expansion
- Table 19.24 Recent Expansions: Distribution by Type of Oral Solid Dosage Form(s) Involved
- Table 19.25 Recent Expansions: Distribution by Type of Expansion and Oral Solid Dosage Form(s) Involved
- Table 19.26 Recent Expansions: Distribution by Type of Service(s) Offered
- Table 19.27 Recent Expansion: Distribution by Scale of Operation
- Table 19.28 Recent Expansions: Distribution by Location of Facility (Region-wise)
- Table 19.29 Recent Expansions: Distribution by Location of Facility (Country-wise)
- Table 19.30 Expansions Focused on Highly Potent Compounds: Distribution by Type of Expansion
- Table 19.31 Annual Global Capacity for Oral Solid Contract Manufacturing (Number of FDF Units): Distribution by Company Size and Range of Installed Capacity
- Table 19.32 Average Annual Oral Solid Dosage Contract Manufacturing Capacity (Distribution by Average Weight of Various Finished Dosage Forms): Sample Data Set
- Table 19.33 Average Annual Oral Solid Dosage Contract Manufacturing Capacity (Distribution by Share of API in Various Finished Dosage Forms): Sample Data Set
- Table 19.34 Annual Global Oral Solid Dosage Contract Manufacturing Capacity (in terms of Number of Finished Dosage Units): Distribution by Company Size
- Table 19.35 Annual Global Oral Solid Dosage Contract Manufacturing Capacity (in terms of Number of Finished Dosage Forms): Distribution by Scale of Operation
- Table 19.36 Annual Global Oral Solid Dosage Contract Manufacturing Capacity (in terms of Number of Finished Dosage Forms): Distribution by Type of Finished Dosage Form
- Table 19.37 Annual Global Oral Solid Dosage Contract Manufacturing Capacity (in terms of Location of Manufacturing Facility): Distribution by Location of Manufacturing Facility
- Table 19.38 Annual Global Oral Solid Dosage Contract Manufacturing Capacity (in terms of Number of Finished Dosages): Distribution by Company Size and Type of Finished Dosage Form
- Table 19.39 Annual Global Oral Solid Dosage Contract Manufacturing Capacity (in terms of Number of Finished Dosages): Distribution by Company Size and Location of Manufacturing Facility
- Table 19.40 Installed Global Oral Solid Dosage Contract Manufacturing Capacity (in terms of Number of Finished Dosages): Distribution by Scale of Operation and Location of Manufacturing Facility
- Table 19.41 Annual Global Oral Solid Dosage Contract Manufacturing Capacity (in terms of Amount of API Processed): Distribution by Company Size
- Table 19.42 Annual Global Oral Solid Dosage Contract Manufacturing Capacity (in terms of Number of Finished Dosage Forms): Distribution by Scale of Operation
- Table 19.43 Annual Global Oral Solid Dosage Contract Manufacturing Capacity (in terms of Amount of API): Distribution by Type of Finished Dosage Form
- Table 19.44 Annual Global Oral Solid Dosage Contract Manufacturing Capacity (in terms of Amount of API): Distribution by Company Size and Type of Finished Dosage Form
- Table 19.45 Annual Global Oral Solid Dosage Contract Manufacturing Capacity (in terms of Amount of API): Distribution by Company Size and Location of Manufacturing Facility
- Table 19.46 Installed Global Oral Solid Dosage Contract Manufacturing Capacity (in terms of Amount of API): Distribution by Scale of Operation and Location of Manufacturing Facility
- Table 19.47 Annual Demand and Capacity Utilization Rate: till 2035 (Metric Tons)
- Table 19.48 Demand Analysis: Annual Demand for Oral Solids, till 2035 (Metric Ton)
- Table 19.49 Annual Demand for Oral Solids: Distribution by Scale of Operation, Current Year and 2035 (Metric Ton)
- Table 19.50 Annual Commercial Demand for Oral Solids, till 2035 (Metric Ton)
- Table 19.51 Commercial Demand for Oral Solids: Distribution by Geography, Current Year and 2035 (Metric Ton)
- Table 19.52 Commercial Demand for Oral Solids in North America, till 2035 (Metric Ton)
- Table 19.53 Commercial Demand for Oral Solids in Europe, till 2035 (Metric Ton)
- Table 19.54 Commercial Demand for Oral Solids in Asia-Pacific and Rest of the World, till 2035 (Metric Ton)
- Table 19.55 Commercial Demand for Oral Solids: Distribution by Therapeutic Area, Current Year and 2035 (Metric Ton)
- Table 19.56 Commercial Demand for Oral Solids for Oncological Disorders, till 2035 (Metric Ton)
- Table 19.57 Commercial Demand for Oral Solids for Infectious Diseases, till 2035 (Metric Ton)
- Table 19.58 Commercial Demand for Oral Solids for Cardiovascular Disorders, till 2035 (Metric Ton)
- Table 19.59 Commercial Demand for Oral Solids for Metabolic Disorders, till 2035 (Metric Ton)
- Table 19.60 Commercial Demand for Oral Solids for Neurological Disorders, till 2035 (Metric Ton)
- Table 19.61 Commercial Demand for Oral Solids for Genetic Disorders, till 2035 (Metric Ton)
- Table 19.62 Commercial Demand for Oral Solids for Respiratory Disorders, till 2035 (Metric Ton)
- Table 19.63 Commercial Demand for Oral Solids for Immunological Disorders, till 2035 (Metric Ton)
- Table 19.64 Commercial Demand for Oral Solids for Other Disorders, till 2035 (Metric Ton)
- Table 19.65 Annual Clinical Demand for Oral Solids, till 2035 (Metric Ton)
- Table 19.66 Clinical Demand for Oral Solids: Distribution by Trial Phase, till 2035 (Metric Ton)
- Table 19.67 Clinical Demand for Oral Solids in Phase I Trials, till 2035 (Metric Ton)
- Table 19.68 Clinical Demand for Oral Solids in Phase II Trials, till 2035 (Metric Ton)
- Table 19.69 Clinical Demand for Oral Solids in Phase III Trials, till 2035 (Metric Ton)
- Table 19.70 Total Cost of Ownership for Oral Solid Dosage Contract Manufacturing Organizations, Y0-Y20 (USD Million)
- Table 19.71 Total Cost of Ownership for Oral Solid Dosage Contract Manufacturing Organizations: Distribution by CapEx and OpEx, Y0 and Y20 (USD Million)
- Table 19.72 Total Cost of Ownership for Oral Solid Dosage Contract Manufacturing Organizations: Distribution by CapEx and OpEx, Y0-Y20 (USD Million)
- Table 19.73 Total Cost of Ownership for Oral Solid Dosage Contract Manufacturing Organizations, Y0: Distribution of CapEx (USD Million)
- Table 19.74 Total Cost of Ownership for Oral Solid Dosage Contract Manufacturing Organizations, Y0: Distribution of OpEx (USD Million)
- Table 19.75 Taste Masking and Taste Assessment Service Providers: Distribution by Year of Establishment
- Table 19.76 Taste Masking and Taste Assessment Service Providers: Distribution by Company Size
- Table 19.77 Taste Masking and Taste Assessment Service Providers: Distribution by Location of Headquarters
- Table 19.78 Taste Masking and Taste Assessment Service Providers: Distribution by Year of Establishment and Location of Headquarters
- Table 19.79 Taste Masking and Taste Assessment Services: Distribution by Service(s) Offered
- Table 19.80 Taste Masking and Taste Assessment Services: Distribution by Scale of Operation
- Table 19.81 Taste Masking and Taste Assessment Services: Distribution by Other Service(s) Offered
- Table 19.82 Taste Masking and Taste Assessment Services: Distribution by Type of Formulation(s)
- Table 19.83 Taste Masking and Taste Assessment Services: Distribution by End Users
- Table 19.84 Taste Masking and Taste Assessment Services: Distribution by Techniques Used for Taste Masking
- Table 19.85 Taste Masking and Taste Assessment Services: Distribution by Branch of Healthcare
- Table 19.86 Taste Masking and Taste Assessment Services: Distribution by Regional Capability
- Table 19.87 Bioavailability Enhancement Service Providers: Distribution by Year of Establishment
- Table 19.88 Bioavailability Enhancement Service Providers: Distribution by Company Size
- Table 19.89 Bioavailability Enhancement Service Providers: Distribution by Location of Headquarters (Region-wise)
- Table 19.90 Bioavailability Enhancement Service Providers: Distribution by Location of Headquarters (Country-wise)
- Table 19.91 Bioavailability Enhancement Service Providers: Distribution by Bioavailability Enhancement Principle
- Table 19.92 Bioavailability Enhancement Service Providers: Distribution by Bioavailability Enhancement Approach
- Table 19.93 Bioavailability Enhancement Service Providers: Distribution by Solid Dispersion-based Approaches
- Table 19.94 Bioavailability Enhancement Service Providers: Distribution by Size Reduction Approaches
- Table 19.95 Bioavailability Enhancement Service Providers: Distribution by Lipid-based Approaches
- Table 19.96 Bioavailability Enhancement Service Providers: Distribution by Other Approaches
- Table 19.97 Bioavailability Enhancement Service Providers: Distribution by Dosage Form
- Table 19.98 Bioavailability Enhancement Service Providers: Distribution by Route of Administration
- Table 19.99 Global Oral Solid Dosage Contract Manufacturing Market, till 2035 (USD Billion)
- Table 19.100 Oral Solid Dosage Contract Manufacturing Market, Current Year and 2035: Distribution by Type of Finished Dosage Form
- Table 19.101 Oral Solid Dosage Contract Manufacturing Market for Tablets, till 2035 (USD Billion)
- Table 19.102 Oral Solid Dosage Contract Manufacturing Market for Capsules, till 2035 (USD Billion)
- Table 19.103 Oral Solid Dosage Contract Manufacturing Market for Powders, till 2035 (USD Billion)
- Table 19.104 Oral Solid Dosage Contract Manufacturing Market for Multi-particulates, till 2035 (USD Billion)
- Table 19.105 Oral Solid Dosage Contract Manufacturing Market for Other Finished Dosage Forms, till 2035 (USD Billion)
- Table 19.106 Oral Solid Dosage Contract Manufacturing Market, Current Year and 2035: Distribution by Type of Packaging
- Table 19.107 Oral Solid Dosage Contract Manufacturing Market for Bottles, till 2035 (USD Billion)
- Table 19.108 Oral Solid Dosage Contract Manufacturing Market for Blisters, till 2035 (USD Billion)
- Table 19.109 Oral Solid Dosage Contract Manufacturing Market for Inhalers, till 2035 (USD Billion)
- Table 19.110 Oral Solid Dosage Contract Manufacturing Market for Sachets, till 2035 (USD Billion)
- Table 19.111 Oral Solid Dosage Contract Manufacturing Market for Strips, till 2035 (USD Billion)
- Table 19.112 Oral Solid Dosage Contract Manufacturing Market for Stick Packs, till 2035 (USD Billion)
- Table 19.113 Oral Solid Dosage Contract Manufacturing Market, Current Year and 2035: Distribution by Scale of Operation
- Table 19.114 Oral Solid Dosage Contract Manufacturing Market for Pre-commercial Scale, till 2035 (USD Billion)
- Table 19.115 Oral Solid Dosage Contract Manufacturing Market for Commercial Scale, till 2035 (USD Billion)
- Table 19.116 Oral Solid Dosage Contract Manufacturing Market, Current Year and 2035: Distribution by Company Size
- Table 19.117 Oral Solid Dosage Contract Manufacturing Market for Small Companies, till 2035 (USD Billion)
- Table 19.118 Oral Solid Dosage Contract Manufacturing Market for Mid-sized Companies, till 2035 (USD Billion)
- Table 19.119 Oral Solid Dosage Contract Manufacturing Market for Large Companies, till 2035 (USD Billion)
- Table 19.120 Oral Solid Dosage Contract Manufacturing Market for Very Large Companies, till 2035 (USD Billion)
- Table 19.121 Oral Solid Dosage Contract Manufacturing Market, Current Year and 2035: Distribution by Therapeutic Area
- Table 19.122 Oral Solid Dosage Contract Manufacturing Market for Oncological Disorders, till 2035 (USD Billion)
- Table 19.123 Oral Solid Dosage Contract Manufacturing Market for Infectious Diseases, till 2035 (USD Billion)
- Table 19.124 Oral Solid Dosage Contract Manufacturing Market for Cardiovascular Disorders, till 2035 (USD Billion)
- Table 19.125 Oral Solid Dosage Contract Manufacturing Market for Metabolic Disorders, till 2035 (USD Billion)
- Table 19.126 Oral Solid Dosage Contract Manufacturing Market for Neurological Disorders, till 2035 (USD Billion)
- Table 19.127 Oral Solid Dosage Contract Manufacturing Market for Genetic Disorders, till 2035 (USD Billion)
- Table 19.128 Oral Solid Dosage Contract Manufacturing Market for Respiratory Disorders, till 2035 (USD Billion)
- Table 19.129 Oral Solid Dosage Contract Manufacturing Market for Immunological Disorders, till 2035 (USD Billion)
- Table 19.130 Oral Solid Dosage Contract Manufacturing Market for Other Disorders, till 2035 (USD Billion)
- Table 19.131 Oral Solid Dosage Contract Manufacturing Market, Current Year and 2035: Distribution by Geographical Regions (USD Billion)
- Table 19.132 Oral Solid Dosage Contract Manufacturing Market in North America, till 2035 (USD Billion)
- Table 19.133 Oral Solid Dosage Contract Manufacturing Market in Europe, till 2035 (USD Billion)
- Table 19.134 Oral Solid Dosage Contract Manufacturing Market in Asia-Pacific, till 2035 (USD Billion)
- Table 19.135 Oral Solid Dosage Contract Manufacturing Market in Latin America, till 2035 (USD Billion)
- Table 19.136 Oral Solid Dosage Contract Manufacturing Market in Middle East and North Africa, till 2035 (USD Billion)
List of Figures
- Figure 2.1 Executive Summary: Market Landscape
- Figure 2.2 Executive Summary: Service(s) Landscape
- Figure 2.3 Executive Summary: Recent Expansions
- Figure 2.4 Executive Summary: Capacity Analysis
- Figure 2.5 Executive Summary: Demand Analysis
- Figure 2.6 Executive Summary: Total Cost of Ownership
- Figure 2.7 Executive Summary: Market Sizing and Opportunity Analysis
- Figure 2.8 Executive Summary: Case Study on Taste Masking Service Providers
- Figure 2.9 Executive Summary: Case Study on Bioavailability Enhancement Service Providers
- Figure 3.1 Properties of Dosage Forms
- Figure 3.2 Types of Dosage Forms
- Figure 3.3 Advantages and Disadvantages of Oral Solid Dosage Forms
- Figure 3.4 Properties of Pharmaceutical Excipient
- Figure 3.5 Type of Oral Solid Dosage Forms
- Figure 3.6 Classification of Orally Administered Tablets
- Figure 3.7 Tablet Processing Methods
- Figure 3.8 Oral Solid Dosage Manufacturing Process
- Figure 3.9 Services Offered by CDMOs and CMOs for Oral Solid Dosage
- Figure 3.10 Key Considerations While Selecting a CDMO or CMO Partner
- Figure 4.1 Oral Solid Dosage Contract Manufacturers: Distribution by Year of Establishment
- Figure 4.2 Oral Solid Dosage Contract Manufacturers: Distribution by Company Size
- Figure 4.3 Oral Solid Dosage Contract Manufacturers: Distribution by Location of Headquarters
- Figure 4.4 World Map Representation: Distribution by Geography
- Figure 4.5 Oral Solid Dosage Contract Manufacturers: Distribution by Company Ownership
- Figure 4.6 Oral Solid Dosage Contract Manufacturers: Distribution by Types of Service(s) Offered
- Figure 4.7 Oral Solid Dosage Contract Manufacturers: Distribution by Type of Finished Dosage Form
- Figure 4.8 Oral Solid Dosage Contract Manufacturers: Distribution by Type of Tablet(s) Manufactured
- Figure 4.9 Oral Solid Dosage Contract Manufacturers: Distribution by Type of Capsule(s) Manufactured
- Figure 4.10 Oral Solid Dosage Contract Manufacturers: Distribution by Type of Multi-particulate(s) Manufactured
- Figure 4.11 Oral Solid Dosage Contract Manufacturers: Distribution by Type of Primary Packaging Offered
- Figure 4.12 Oral Solid Dosage Contract Manufacturers: Distribution by Scale of Operation
- Figure 4.13 Oral Solid Dosage Contract Manufacturers: Distribution by High Potency Drug Manufacturing
- Figure 4.14 Oral Solid Dosage Contract Manufacturers: Distribution by Availability of Continuous Manufacturing
- Figure 4.15 Oral Solid Dosage Contract Manufacturers: Distribution by Regulatory Certification / Accreditation
- Figure 5.1 Company Competitiveness Analysis: Oral Solid Dosage Contract Manufacturers based in the US
- Figure 5.2 Competitiveness Analysis: Oral Solid Dosage Contract Manufacturers based in Canada
- Figure 5.3 Company Competitiveness Analysis: Oral Solid Dosage Contract Manufacturers Based in the EU5
- Figure 5.4 Company Competitiveness Analysis: Oral Solid Dosage Contract Manufacturers Based in Other European Countries
- Figure 5.5 Company Competitiveness Analysis: Oral Solid Dosage Contract Manufacturers Based in India
- Figure 5.6 Company Competitiveness Analysis: Oral Solid Dosage Contract Manufacturers Based in China
- Figure 5.7 Company Competitiveness Analysis: Oral Solid Dosage Contract Manufacturers Based in Japan
- Figure 5.8 Company Competitiveness Analysis: Oral Solid Contract Manufacturers Based in Other Asia-Pacific and Rest of the World
- Figure 5.9 Competitiveness Analysis of Oral Solid Dosage Contract Manufacturers: Competitiveness Score of Top Service Providers
- Figure 6.1 Oral Solid Dosage Contract Manufacturers: Distribution by Location of Manufacturing Facilities
- Figure 6.2 Oral Solid Dosage Contract Manufacturing: North America Scenario (I / II)
- Figure 6.2 Oral Solid Dosage Contract Manufacturers: North America Scenario (II / II)
- Figure 6.4 Oral Solid Dosage Contract Manufacturing: Europe Scenario (I / II)
- Figure 6.5 Oral Solid Dosage Contract Manufacturers: Europe Scenario (II / II)
- Figure 6.5 Oral Solid Dosage Contract Manufacturing: Asia-Pacific and Rest of the World Scenario (I / II)
- Figure 6.6 Oral Solid Dosage Contract Manufacturers: Asia-Pacific and Rest of the World Scenario (II / II)
- Figure 7.1 Catalent: Annual Revenues, FY 2017 Onwards (USD Billion)
- Figure 7.2 Catalent: Distribution of FY 2022 Revenues by Business Segment
- Figure 7.3 Aenova: Annual Revenues, FY 2017 Onwards (EUR Million)
- Figure 7.4 Aenova: Distribution of FY 2021 Revenues by Type of Business Segment
- Figure 7.5 Almac: Annual Revenues, FY 2017 Onwards (GBP Million)
- Figure 7.6 Lonza: Annual Revenues, FY 2017 Onwards (CHF Billion)
- Figure 7.7 Lonza: Distribution of FY 2022 Revenues by Type of Business Segment
- Figure 7.8 Ind-Swift Laboratories: Annual Revenues, FY 2017 Onwards (INR Billion)
- Figure 8.1 Make versus Buy Decision Making Framework
- Figure 8.2 Make versus Buy Decision Making: Possible Scenario Descriptions
- Figure 9.1 Recent Expansions: Cumulative Year-wise Trend, since 2018
- Figure 9.2 Recent Expansions: Distribution by Type of Expansion
- Figure 9.3 Recent Expansions: Distribution by Year and Type of Expansion
- Figure 9.4 Recent Expansions: Distribution by Type of Oral Solid Dosage Form(s) Involved
- Figure 9.5 Recent Expansions: Distribution by Type of Expansion and Oral Solid Dosage Form(s) Involved
- Figure 9.6 Recent Expansions: Distribution by Type of Service(s) Offered
- Figure 9.7 Recent Expansion: Distribution by Scale of Operation
- Figure 9.8 Recent Expansions: Distribution by Location of Facility (Region-wise)
- Figure 9.9 Recent Expansions: Distribution by Location of Facility (Country-wise)
- Figure 9.10 Expansions Focused on Highly Potent Compounds: Distribution by Type of Expansion
- Figure 10.1 Annual Minimum, Average and Maximum Oral Solid Dosage Contract Manufacturing Capacity (Distribution by Company Size: Sample Data Set
- Figure 10.2 Distribution by Minimum, Average and Maximum Weight of Various Finished Dosage Forms: Sample Data Set
- Figure 10.3 Distribution by Minimum, Average and Maximum Share of API in Various Finished Dosage Forms: Sample Data Set
- Figure 10.4 Annual Global Oral Solid Dosage Contract Manufacturing Capacity (in terms of Number of Finished Dosage Units): Distribution by Company Size
- Figure 10.5 Annual Global Oral Solid Dosage Contract Manufacturing Capacity (in terms of Number of Finished Dosage Forms): Distribution by Scale of Operation
- Figure 10.6 Annual Global Oral Solid Dosage Contract Manufacturing Capacity (in terms of Number of Finished Dosage Forms): Distribution by Type of Finished Dosage Form
- Figure 10.7 Annual Global Oral Solid Dosage Contract Manufacturing Capacity (in terms of Location of Manufacturing Facility): Distribution by Location of Manufacturing Facility
- Figure 10.8 Annual Global Oral Solid Dosage Contract Manufacturing Capacity (in terms of Number of Finished Dosages): Distribution by Company Size and Type of Finished Dosage Form
- Figure 10.9 Annual Global Oral Solid Dosage Contract Manufacturing Capacity (in terms of Number of Finished Dosages): Distribution by Company Size and Location of Manufacturing Facility
- Figure 10.10 Annual Global Oral Solid Dosage Contract Manufacturing Capacity (in terms of Number of Finished Dosages): Distribution by Scale of Operation and Location of Manufacturing Facility
- Figure 10.11 Annual Global Oral Solid Dosage Contract Manufacturing Capacity (in terms of Amount of API): Distribution by Company Size
- Figure 10.12 Annual Global Oral Solid Dosage Contract Manufacturing Capacity (in terms of Number of Amount of API): Distribution by Scale of Operation
- Figure 10.13 Annual Global Oral Solid Dosage Contract Manufacturing Capacity (in terms of Amount of API): Distribution by Type of Finished Dosage Form
- Figure 10.14 Annual Global Oral Solid Dosage Contract Manufacturing Capacity (in terms of Amount of API): Distribution by Company Size and Type of Finished Dosage Form
- Figure 10.15 Annual Global Oral Solid Dosage Contract Manufacturing Capacity (in terms of Amount of API): Distribution by Company Size and Location of Manufacturing Facility
- Figure 10.16 Annual Global Oral Solid Dosage Contract Manufacturing Capacity (in terms of Amount of API): Distribution by Scale of Operation and Location of Manufacturing Facility
- Figure 11.1 Demand Analysis: Annual Outsourced Demand for Oral Solids, till 2035 (Metric Ton)
- Figure 11.2 Annual Demand for Oral Solids: Distribution by Scale of Operation, Current Year and 2035 (Metric Ton)
- Figure 11.3 Annual Outsourced Commercial Demand for Oral Solids, till 2035 (Metric Ton)
- Figure 11.4 Commercial Outsourced Demand for Oral Solids: Distribution by Geography, Current Year and 2035 (Metric Ton)
- Figure 11.5 Commercial Outsourced Demand for Oral Solids in North America, till 2035 (Metric Ton)
- Figure 11.6 Commercial Outsourced Demand for Oral Solids in Europe, till 2035 (Metric Ton)
- Figure 11.7 Commercial Outsourced Demand for Oral Solids in Asia-Pacific and Rest of the World, till 2035 (Metric Ton)
- Figure 11.8 Commercial Outsourced Demand for Oral Solids: Distribution by Therapeutic Area, Current Year and 2035 (Metric Ton)
- Figure 11.9 Commercial Outsourced Demand for Oral Solids for Oncological Disorders, till 2035 (Metric Ton)
- Figure 11.10 Commercial Outsourced Demand for Oral Solids for Infectious Diseases, till 2035 (Metric Ton)
- Figure 11.11 Commercial Outsourced Demand for Oral Solids for Cardiovascular Disorders, till 2035 (Metric Ton)
- Figure 11.12 Commercial Outsourced Demand for Oral Solids for Metabolic Disorders, till 2035 (Metric Ton)
- Figure 11.13 Commercial Outsourced Demand for Oral Solids for Neurological Disorders, till 2035 (Metric Ton)
- Figure 11.14 Commercial Outsourced Demand for Oral Solids for Genetic Disorders, till 2035 (Metric Ton)
- Figure 11.15 Commercial Outsourced Demand for Oral Solids for Respiratory Disorders, till 2035 (Metric Ton)
- Figure 11.16 Commercial Outsourced Demand for Oral Solids for Immunological Disorders, till 2035 (Metric Ton)
- Figure 11.17 Commercial Outsourced Demand for Oral Solids for Other Disorders, till 2035 (Metric Ton)
- Figure 11.18 Annual Outsourced Clinical Demand for Oral Solids, till 2035 (Metric Ton)
- Figure 11.19 Clinical Outsourced Demand for Oral Solids: Distribution by Trial Phase, till 2035 (Metric Ton)
- Figure 11.20 Clinical Outsourced Demand for Oral Solids in Phase I Trials, till 2035 (Metric Ton)
- Figure 11.21 Clinical Outsourced Demand for Oral Solids in Phase II Trials, till 2035 (Metric Ton)
- Figure 11.22 Clinical Outsourced Demand for Oral Solids in Phase III Trials, till 2035 (Metric Ton)
- Figure 11.23 Annual Outsourced Demand and Capacity Utilization Rate: till 2035 (Metric Tons)
- Figure 11.24 Oral Solid Dosage Contract Manufacturing: Correlation between Demand and Capacity, till 2035
- Figure 12.1 Total Cost of Ownership: Types of Capital Expenditures (CapEx)
- Figure 12.2 Total Cost of Ownership: Types of Operational Expenditures (OpEx)
- Figure 12.3 Total Cost of Ownership for Oral Solid Dosage Contract Manufacturing Organizations, Y0-Y20 (USD Million)
- Figure 12.4 Total Cost of Ownership for Oral Solid Dosage Contract Manufacturing Organizations: Distribution by CapEx and OpEx, Y0 and Y20 (USD Million)
- Figure 12.5 Total Cost of Ownership for Oral Solid Dosage Contract Manufacturing Organizations: Distribution by CapEx and OpEx, Y0-Y20 (USD Million)
- Figure 12.6 Total Cost of Ownership for Oral Solid Dosage Contract Manufacturing Organizations, Y0: Distribution of CapEx (USD Million)
- Figure 12.7 Total Cost of Ownership for Oral Solid Dosage Contract Manufacturing Organizations, Y0: Distribution of OpEx (USD Million)
- Figure 13.1 Key Regulatory Requirements for CMOs and CROs in India
- Figure 13.2 Regulatory Landscape for Oral Solid Dosage CMOs: Distribution by Certifications / Accreditations Received
- Figure 13.3 Bubble Analysis: Regional Regulatory Summary
- Figure 14.1 Taste Masking and Taste Assessment Service Providers: Distribution by Year of Establishment
- Figure 14.2 Taste Masking and Taste Assessment Service Providers: Distribution by Company Size
- Figure 14.3 Taste Masking and Taste Assessment Service Providers: Distribution by Location of Headquarters
- Figure 14.4 Taste Masking and Taste Assessment Service Providers: Distribution by Year of Establishment and Location of Headquarters
- Figure 14.5 Taste Masking and Taste Assessment Services: Distribution by Service(s) Offered
- Figure 14.6 Taste Masking and Taste Assessment Services: Distribution by Scale of Operation
- Figure 14.7 Taste Masking and Taste Assessment Services: Distribution by Other Service(s) Offered
- Figure 14.8 Taste Masking and Taste Assessment Services: Distribution by Type of Formulation(s)
- Figure 14.9 Taste Masking and Taste Assessment Services: Distribution by End Users
- Figure 14.10 Taste Masking and Taste Assessment Services: Distribution by Techniques Used for Taste Masking
- Figure 14.11 Taste Masking and Taste Assessment Services: Distribution by Branch of Healthcare
- Figure 14.12 Taste Masking and Taste Assessment Services: Distribution by Regional Capability
- Figure 15.1 Bioavailability Enhancement Service Providers: Distribution by Year of Establishment
- Figure 15.2 Bioavailability Enhancement Service Providers: Distribution by Company Size
- Figure 15.3 Bioavailability Enhancement Service Providers: Distribution by Location of Headquarters (Region wise)
- Figure 15.4 Bioavailability Enhancement Service Providers: Distribution by Location of Headquarters (Country-wise)
- Figure 15.5 Bioavailability Enhancement Service Providers: Distribution by Bioavailability Enhancement Principle
- Figure 15.6 Bioavailability Enhancement Service Providers: Distribution by Bioavailability Enhancement Approach
- Figure 15.7 Bioavailability Enhancement Service Providers: Distribution by Solid Dispersion-based Approaches
- Figure 15.8 Bioavailability Enhancement Service Providers: Distribution by Size Reduction Approaches
- Figure 15.9 Bioavailability Enhancement Service Providers: Distribution by Lipid-based Approaches
- Figure 15.10 Bioavailability Enhancement Service Providers: Distribution by Other Approaches
- Figure 15.11 Bioavailability Enhancement Service Providers: Distribution by Dosage Form
- Figure 15.12 Bioavailability Enhancement Service Providers: Distribution by Route of Administration
- Figure 16.1 Oral Solid Dosage Contract Manufacturing: Market Forecast Approach
- Figure 16.2 Global Oral Solid Dosage Contract Manufacturing Market, till 2035 (USD Billion)
- Figure 16.3 Oral Solid Dosage Contract Manufacturing Market, Current Year and 2035: Distribution by Type of Finished Dosage Form
- Figure 16.4 Oral Solid Dosage Contract Manufacturing Market for Tablets, till 2035 (USD Billion)
- Figure 16.5 Oral Solid Dosage Contract Manufacturing Market for Capsules, till 2035 (USD Billion)
- Figure 16.6 Oral Solid Dosage Contract Manufacturing Market for Powders, till 2035 (USD Billion)
- Figure 16.7 Oral Solid Dosage Contract Manufacturing Market for Multi-particulates, till 2035 (USD Billion)
- Figure 16.8 Oral Solid Dosage Contract Manufacturing Market for Other Finished Dosage Forms, till 2035 (USD Billion)
- Figure 16.9 Oral Solid Dosage Contract Manufacturing Market, Current Year and 2035: Distribution by Type of Packaging (USD Billion)
- Figure 16.10 Oral Solid Dosage Contract Manufacturing Market for Bottles, till 2035 (USD Billion)
- Figure 16.11 Oral Solid Dosage Contract Manufacturing Market for Blisters, till 2035 (USD Billion)
- Figure 16.12 Oral Solid Dosage Contract Manufacturing Market for Inhalers, till 2035 (USD Billion)
- Figure 16.13 Oral Solid Dosage Contract Manufacturing Market for Sachets, till 2035 (USD Billion)
- Figure 16.14 Oral Solid Dosage Contract Manufacturing Market for Strips, till 2035 (USD Billion)
- Figure 16.15 Oral Solid Dosage Contract Manufacturing Market for Stick Packs, till 2035 (USD Billion)
- Figure 16.16 Oral Solid Dosage Contract Manufacturing Market, Current Year and 2035: Distribution by Scale of Operation (USD Billion)
- Figure 16.17 Oral Solid Dosage Contract Manufacturing Market for Pre-commercial Scale, till 2035 (USD Billion)
- Figure 16.18 Oral Solid Dosage Contract Manufacturing Market for Commercial Scale, till 2035 (USD Billion)
- Figure 16.19 Oral Solid Dosage Contract Manufacturing Market, Current Year and 2035: Distribution by Company Size (USD Billion)
- Figure 16.20 Oral Solid Dosage Contract Manufacturing Market for Small Companies, till 2035 (USD Billion)
- Figure 16.21 Oral Solid Dosage Contract Manufacturing Market for Mid-sized Companies, till 2035 (USD Billion)
- Figure 16.22 Oral Solid Dosage Contract Manufacturing Market for Large Companies, till 2035 (USD Billion)
- Figure 16.23 Oral Solid Dosage Contract Manufacturing Market for Very Large Companies, till 2035 (USD Billion)
- Figure 16.24 Oral Solid Dosage Contract Manufacturing Market, Current Year and 2035: Distribution by Therapeutic Area (USD Billion)
- Figure 16.25 Oral Solid Dosage Contract Manufacturing Market for Oncological Disorders, till 2035 (USD Billion)
- Figure 16.26 Oral Solid Dosage Contract Manufacturing Market for Infectious Diseases, till 2035 (USD Billion)
- Figure 16.27 Oral Solid Dosage Contract Manufacturing Market for Cardiovascular Disorders, till 2035 (USD Billion)
- Figure 16.28 Oral Solid Dosage Contract Manufacturing Market for Metabolic Disorders, till 2035 (USD Billion)
- Figure 16.29 Oral Solid Dosage Contract Manufacturing Market for Neurological Disorders, till 2035 (USD Billion)
- Figure 16.30 Oral Solid Dosage Contract Manufacturing Market for Genetic Disorders, till 2035 (USD Billion)
- Figure 16.31 Oral Solid Dosage Contract Manufacturing Market for Respiratory Disorders, till 2035 (USD Billion)
- Figure 16.32 Oral Solid Dosage Contract Manufacturing Market for Immunological Disorders, till 2035 (USD Billion)
- Figure 16.33 Oral Solid Dosage Contract Manufacturing Market for Other Disorders, till 2035 (USD Billion)
- Figure 16.34 Oral Solid Dosage Contract Manufacturing Market, Current Year and 2035: Distribution by Key Geographical Regions (USD Billion)
- Figure 16.35 Oral Solid Dosage Contract Manufacturing Market in North America, till 2035 (USD Billion)
- Figure 16.36 Oral Solid Dosage Contract Manufacturing Market in Europe, till 2035 (USD Billion)
- Figure 16.37 Oral Solid Dosage Contract Manufacturing Market in Asia-Pacific, till 2035 (USD Billion)
- Figure 16.38 Oral Solid Dosage Contract Manufacturing Market in Latin America, till 2035 (USD Billion)
- Figure 16.39 Oral Solid Dosage Contract Manufacturing Market in Middle East and North Africa, till 2035 (USD Billion)

