
PUBLISHER: Roots Analysis | PRODUCT CODE: 1682714

PUBLISHER: Roots Analysis | PRODUCT CODE: 1682714
RNA Therapeutics and RNA Vaccines Market by Type of Modality, Type of Molecule, Therapeutic Areas, Route of Administration, Key Geographical Regions and Leading Players: Industry Trends and Global Forecasts, Till 2035
RNA THERAPEUTICS MARKET AND RNA VACCINES MARKET: OVERVIEW
As per Roots Analysis, the global RNA therapeutics market and RNA vaccines market is estimated to grow to USD 940 million by 2035, at a CAGR of 68% during the forecast period, till 2035.
The market sizing and opportunity analysis has been segmented across the following parameters:
Type of Modality
- RNA Therapeutics
- RNA Vaccines
Type of Molecule
- Replicating RNA
- Self Amplifying RNA
- Self Activating RNA
- Self Amplifying mRNA
- Transfer RNA
Therapeutic Areas
- Infectious Diseases
- Oncological Disorders
Route of Administration
- Intradermal
- Intramuscular
- Intravenous
Key Geographical Regions
- North America
- Asia-Pacific
RNA THERAPEUTICS MARKET AND RNA VACCINES MARKET: GROWTH AND TRENDS
Given the critical role it plays in producing proteins and regulating gene function in the human body, RNA is being investigated as a potential therapeutic modality. Researchers are realizing the vast potential associated with RNA-based drugs, given their ability to specifically target and treat diseases that earlier deemed untreatable. However, the highly unstable nature of such molecules offers significant resistance to their applicability as treatment options. In recent years, the advent of advanced technologies and platforms has escalated the interest of industry stakeholders towards enhanced and modified RNA-based therapies, that are believed to be highly stable and have an extended impact at relatively low doses. This class of modified RNA-based therapies is termed as next generation therapies, which are anticipated to evolve rapidly to become the next big therapeutic approach in the coming decade. Driven by the research and development efforts, high investment activity and increased involvement of prominent players, the RNA therapeutics and vaccines market is anticipated to witness significant growth in the foreseen future.
RNA THERAPEUTICS MARKET AND RNA VACCINES MARKET: KEY INSIGHTS
The report delves into the current state of the RNA therapeutics and RNA vaccines market and identifies potential growth opportunities within the industry. Some key findings from the report include:
1. More than 100 next generation RNA therapeutics and vaccines are being developed to offer an advanced, low-dose form of treatment, targeting a wide range of therapeutic indications.
2. 75% of the next generation therapies are still in discovery and preclinical stages, primarily targeting infectious diseases; industry players are actively engaged in advancing their next generation drug portfolio.
3. Over 35 next generation RNA technologies are being developed / offered by companies for the research, discovery, design, development, manufacturing and delivery of novel RNA therapies and vaccines.
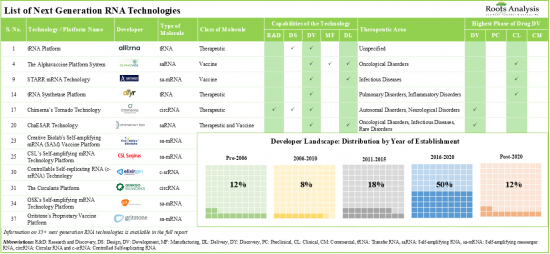
4. Around 55% of the technologies are used in the development of circular RNA-based therapeutics and vaccines; majority of such technologies facilitate targeted therapy delivery at a specific site within the cell.
5. Majority of the trials focused on RNA therapeutics and vaccines were registered in 2022; more than 70% of these studies have either been completed / are currently recruiting patients across different locations.
6. Close to 1,170 patents have been filed / granted for next generation RNA therapeutics and vaccines, by industry and non-industry players, to protect intellectual property generated within this field.
7. Around 70% of the deals inked in this market were focused on clinical research of saRNA therapeutics / vaccines; of these, more than 60% partnerships were inked for the treatment of infectious diseases.
8. Several investors, having realized the opportunity within this domain, have invested close to USD 2.9 Billion across various funding rounds in the past four years.
9. The rising interest of big pharma players is reflected by the increase in the number of next generation RNA therapeutics / vaccines-focused initiatives, including partnerships and funding, undertaken in recent years.
10. The market opportunity associated with next generation RNA therapeutics and vaccines is expected to witness an annualized growth rate of more than 50% between 2026 to 2035.
RNA THERAPEUTICS MARKET AND RNA VACCINES MARKET: KEY SEGMENTS
Vaccines Account for the Highest Share of the RNA Therapeutics and RNA Vaccines Market
Based on the type of modality, the market is segmented into RNA therapeutics and RNA vaccines. At present, RNA vaccines capture a substantial proportion of the RNA therapeutics and RNA vaccines market. This trend is unlikely to change in the near future.
repRNA Dominates the RNA Therapeutics and RNA Vaccines Market During the Forecast Period
Based on the type of molecule, the market is segmented into replicating RNA, self amplifying RNA, self activating RNA, self amplifying mRNA and transfer RNA. At present, replicating RNA holds the maximum share of the the RNA therapeutics and RNA vaccines market. However, self amplifying RNA is likely to drive the market in the near future.
Infectious Diseases Segment Captures the Highest Share of the RNA Therapeutics and RNA Vaccines Market
Based on the therapeutic area, the market is segmented into infectious diseases and oncological disorders. Currently, infectious diseases account for the 100% share of the RNA therapeutics and RNA vaccines market. However, oncological disorders segment is likely to drive the market in the near future.
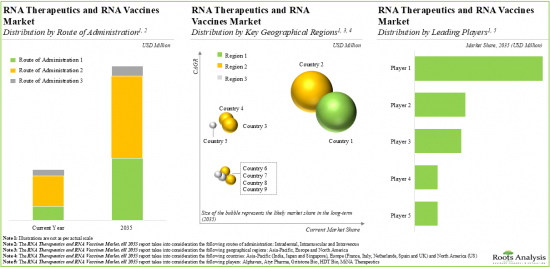
Intradermal Route Occupies for the Largest Share of the RNA Therapeutics and RNA Vaccines Market
Based on the route of administration, the market is segmented into intradermal, intramuscular and intravenous. Currently, the intradermal route holds the majority share of the RNA therapeutics and RNA vaccines market. However, the intramuscular route is likely to drive the market in the near future.
Asia-Pacific Accounts for the Largest Share of the Market
Based on key geographical regions, the market is segmented into North America and Asia-Pacific. The majority of the share is expected to be captured by drug developers based in Asia-Pacific. It is worth highlighting that, over the years, the market in North America is expected to grow at a higher CAGR.
Example Players in the RNA Therapeutics and RNA Vaccines Market
- Alphavax
- Arcturus Therapeutics
- Atyr Pharma
- Gritstone Bio
- HDT Bio
- MiNA Therapeutics
- VLP Therapeutics
RNA THERAPEUTICS AND RNA VACCINES MARKET: RESEARCH COVERAGE
- Market Sizing and Opportunity Analysis: The report features an in-depth analysis of the RNA therapeutics and RNA vaccines market, focusing on key market segments, including [A] type of modality, [B] type of molecule, [C] therapeutic areas, [D] route of administration [E] and [F] key geographical regions.
- Market Landscape: A comprehensive evaluation of next generation RNA therapeutics and RNA vaccines that are either approved or being evaluated in different stages of development, considering various parameters, such as [A] type of modality, [B] type of molecule, [C] type of delivery vehicle, [D] phase of development [E] therapeutic area and [F] key niche market segments (circRNA and saRNA). Additionally, the chapter includes analysis of various next generation RNA therapeutic and RNA vaccine developers, based on their [G] year of establishment, [H] company size, [I] location of headquarters and [J] most active players (in terms of number of therapies).
- Technology Landscape: A comprehensive evaluation of technologies that are being developed / deployed to support the development of next generation RNA therapeutics and RNA vaccines, considering various parameters, such as [A] class of molecule, [B] type of molecule, [C] capabilities of the technology, [D] therapeutic area and [E] highest phase of development. Additionally, the chapter features analysis of various next generation RNA therapeutic and RNA vaccine technology developers, based on their [F] year of establishment, [G] company size, [H] location of headquarters and [I] operational model.
- Drug Profiles: In-depth profiles of drug candidates that are in advanced stages of development, focusing on [A] details on its developer, [B] drug overview, [C] clinical trial information, [D] clinical trial endpoints, [E] clinical trial results and [F] estimated sales.
- Clinical Trial Analysis: Examination of completed, ongoing, and planned clinical studies of various next generation RNA therapeutics and RNA vaccines, based on parameters like [A] trial registration year, [B] trial status, [C] trial phase, [D] patients enrolled, [E] type of sponsor, [F] therapeutic area, [G] study design, [H] leading organizations (in terms of number of trials), [I] focus area and [J] geography.
- Patent Analysis: Detailed analysis of various patents filed / granted related to next generation RNA therapeutics and RNA vaccines based on [A] type of patent (granted patents, patent applications and others), [B] patent publication year, [C] patent jurisdiction, [D] CPC symbols, [E] emerging focus areas, [F] patent age, [G] leading industry / non-industry players (in terms of number of patents filed / granted) and [H] patent valuation.
Partnerships and Collaborations: An analysis of partnerships established in this sector based on several relevant parameters, such as the [A] year of partnership, [B] type of partnership, [C] type of molecule, [D] focus of partnership, [E] purpose of partnership, [F] therapeutic area, [G] most active players (in terms of number of partnerships) and [H] the regional distribution of partnership activity in this market.
- Funding and Investment Analysis: A detailed evaluation of the investments made in this domain based on several relevant parameters, such as [A] year of funding, [B] type of funding, [C] type of molecule, [D] amount invested, [E] geography, [F] purpose of funding, [G] stage of development, [H] therapeutic area, [I] most active players (in terms of number and amount of funding instances) and [J] leading investors (in terms of number of funding instances).
- Big Pharma Analysis: A comprehensive examination of various initiatives focused on next generation RNA therapeutics and RNA vaccines undertaken by major pharmaceutical companies based on several relevant parameters, such as [A] number of initiatives, [B] year of initiative, [C] type of initiative, [D] purpose of initiative, [E] focus of initiative and [F] location of headquarters.
KEY QUESTIONS ANSWERED IN THIS REPORT
- How many companies are currently engaged in this market?
- Which are the leading companies in this market?
- What kind of partnership models are commonly adopted by industry stakeholders?
- What factors are likely to influence the evolution of this market?
- What is the current and future market size?
- What is the CAGR of this market?
- How is the current and future market opportunity likely to be distributed across key market segments?
REASONS TO BUY THIS REPORT
- The report provides a comprehensive market analysis, offering detailed revenue projections of the overall market and its specific sub-segments. This information is valuable to both established market leaders and emerging entrants.
- Stakeholders can leverage the report to gain a deeper understanding of the competitive dynamics within the market. By analyzing the competitive landscape, businesses can make informed decisions to optimize their market positioning and develop effective go-to-market strategies.
- The report offers stakeholders a comprehensive overview of the market, including key drivers, barriers, opportunities, and challenges. This information empowers stakeholders to stay abreast of market trends and make data-driven decisions to capitalize on growth prospects.
ADDITIONAL BENEFITS
- Complimentary PPT Insights Packs
- Complimentary Excel Data Packs for all Analytical Modules in the Report
- 10% Free Content Customization
- Detailed Report Walkthrough Session with Research Team
- Free Updated report if the report is 6-12 months old or older
TABLE OF CONTENTS
1. PREFACE
- 1.1. RNA Therapeutics and RNA Vaccines Market Overview
- 1.2. Key Market Insights
- 1.3. Scope of the Report
- 1.4. Research Methodology
- 1.5. Frequently Asked Questions
- 1.6. Chapter Outlines
2. RESEARCH METHODOLOGY
- 2.1. Chapter Overview
- 2.2. Research Assumptions
- 2.3. Project Methodology
- 2.4. Forecast Methodology
- 2.5. Robust Quality Control
- 2.6. Key Market Segmentations
- 2.7. Key Considerations
- 2.7.1. Demographics
- 2.7.2. Economic Factors
- 2.7.3. Government Regulations
- 2.7.4. Supply Chain
- 2.7.5. COVID Impact / Related Factors
- 2.7.6. Market Access
- 2.7.7. Healthcare Policies
- 2.7.8. Industry Consolidation
3. ECONOMIC AND OTHER PROJECT SPECIFIC CONSIDERATIONS
- 3.1. Chapter Overview
- 3.2. Market Dynamics
- 3.2.1. Time Period
- 3.2.1.1. Historical Trends
- 3.2.1.2. Current and Forecasted Estimates
- 3.2.2. Currency Coverage
- 3.2.2.1. Overview of Major Currencies Affecting the Market
- 3.2.2.2. Impact of Currency Fluctuations on the Industry
- 3.2.3. Foreign Exchange Impact
- 3.2.3.1. Evaluation of Foreign Exchange Rates and Their Impact on Market
- 3.2.3.2. Strategies for Mitigating Foreign Exchange Risk
- 3.2.4. Recession
- 3.2.4.1. Historical Analysis of Past Recessions and Lessons Learnt
- 3.2.4.2. Assessment of Current Economic Conditions and Potential Impact on the Market
- 3.2.5. Inflation
- 3.2.5.1. Measurement and Analysis of Inflationary Pressures in the Economy
- 3.2.5.2. Potential Impact of Inflation on the Market Evolution
- 3.2.1. Time Period
4. EXECUTIVE SUMMARY
5. INTRODUCTION
- 5.1. An Overview of Next Generation RNA Therapeutics and Vaccines
- 5.2. Key Contributors in the Evolution of Next Generation RNA Therapeutics and Vaccines
- 5.3. Types of Next Generation RNA Molecules
- 5.4. Key Aspects of Next Generation RNA Molecules
- 5.5. Key Challenges Associated with Traditional RNA Modalities
- 5.6. Advantages of Using Next Generation RNA Modalities
6. MARKET LANDSCAPE
- 6.1. RNA Therapeutics and RNA Vaccines: Overall Therapies Landscape
- 6.1.1. Analysis by Type of Modality
- 6.1.2. Analysis by Type of Molecule
- 6.1.3. Analysis by Delivery Vehicle
- 6.1.4. Analysis by Phase of Development
- 6.1.5. Analysis by Therapeutic Area
- 6.1.6. Most Active Players: Analysis by Number of Therapies
- 6.2 RNA Therapeutics and RNA Vaccines: Clinical Stage Therapies Landscape
- 6.2.1. Analysis by Phase of Development
- 6.2.2. Analysis by Route of Administration
- 6.2.3. Analysis by Therapeutic Area
- 6.3. RNA Therapeutics and RNA Vaccines: Therapy Developers Landscape
- 6.3.1. Analysis by Year of Establishment
- 6.3.2. Analysis by Company Size
- 6.3.3. Analysis by Location of Headquarters
- 6.4. RNA Therapeutics and RNA Vaccines: Circular RNA Therapies Landscape
- 6.4.1. Analysis by Phase of Development
- 6.4.2. Analysis by Therapeutic Area
- 6.4.3. Most Active Players: Analysis by Number of Therapies
- 6.5. RNA Therapeutics and RNA Vaccines: Self-amplifying RNA Therapies Landscape
- 6.5.1. Analysis by Phase of Development
- 6.5.2. Analysis by Therapeutic Area
- 6.5.3. Most Active Players: Analysis by Number of Therapies
7. TECHNOLOGY LANDSCAPE
- 7.1. RNA Therapeutics and RNA Vaccines: Next Generation RNA Technologies Landscape
- 7.1.1. Analysis by Class of Molecule
- 7.1.2. Analysis by Type of Molecule
- 7.1.3. Analysis by Capabilities of the Technology
- 7.1.4. Analysis by Therapeutic Area
- 7.1.5. Analysis by Highest Phase of Development
- 7.2. RNA Therapeutics and RNA Vaccines: Next Generation RNA Technology / Platform Developers Landscape
- 7.2.1. Analysis by Year of Establishment
- 7.2.2. Analysis by Company Size
- 7.2.3. Analysis by Location of Headquarters
- 7.2.4. Analysis by Operational Model
8. DRUG PROFILES
- 8.1. Gemcovac
- 8.1.1. Developer Overview
- 8.1.2. Drug Overview
- 8.1.3. Clinical Trial Information
- 8.1.4. Clinical Trial Endpoints
- 8.1.5. Clinical Trial Results
- 8.1.6. Estimated Sales
- 8.2. ATYR1923
- 8.2.1. Developer Overview
- 8.2.2. Drug Overview
- 8.2.3. Clinical Trial Information
- 8.2.4. Clinical Trial Endpoints
- 8.2.5. Clinical Trial Results
- 8.2.6. Estimated Sales
- 8.3. ARCT-154
- 8.3.1. Developer Overview
- 8.3.2. Drug Overview
- 8.3.3. Clinical Trial Information
- 8.3.4. Clinical Trial Endpoints
- 8.3.5. Clinical Trial Results
- 8.3.6. Estimated Sales
- 8.4. GRT-C901
- 8.4.1. Developer Overview
- 8.4.2. Drug Overview
- 8.4.3. Clinical Trial Information
- 8.4.4. Clinical Trial Endpoints
- 8.4.5. Clinical Trial Results
- 8.4.6. Estimated Sales
- 8.5. VLPCOV-01
- 8.5.1. Developer Overview
- 8.5.2. Drug Overview
- 8.5.3. Estimated Sales
- 8.6. AVX901
- 8.6.1. Developer Overview
- 8.6.2. Drug Overview
- 8.6.3. Clinical Trial Information
- 8.6.4. Clinical Trial Endpoints
- 8.6.5. Clinical Trial Results
- 8.6.6. Estimated Sales
- 8.7. MTL-CEBPA + Sorafenib
- 8.7.1. Developer Overview
- 8.7.2. Drug Overview
- 8.7.3. Clinical Trial Information
- 8.7.4. Clinical Trial Endpoints
- 8.7.5. Clinical Trial Results
- 8.7.6. Estimated Sales
- 8.8. SLATE
- 8.8.1. Developer Overview
- 8.8.2. Drug Overview
- 8.8.3. Clinical Trial Information
- 8.8.4. Clinical Trial Endpoints
- 8.8.5. Clinical Trial Results
- 8.8.6. Estimated Sales
9. CLINICAL TRIAL ANALYSIS
- 9.1. Analysis Methodology and Key Parameters
- 9.2. RNA Therapeutics and RNA Vaccines: Clinical Trial Analysis
- 9.2.1. Analysis by Trial Registration Year
- 9.2.2. Analysis by Trial Status
- 9.2.3. Analysis by Trial Registration Year and Trial Status
- 9.2.4. Analysis by Trial Phase
- 9.2.5. Analysis by Patients Enrolled
- 9.2.6. Analysis by Type of Sponsor
- 9.2.7. Analysis by Therapeutic Area
- 9.2.8. Analysis by Study Design
- 9.2.9. Leading Organizations: Analysis by Number of Trials
- 9.2.10. Analysis by Focus Area
- 9.2.11. Analysis by Geography
10. PATENT ANALYSIS
- 10.1. Analysis Methodology and Key Parameters
- 10.2. RNA Therapeutics and RNA Vaccines: Patent Analysis
- 10.2.1. Analysis by Type of Patent
- 10.2.2. Analysis by Patent Publication Year
- 10.2.3. Analysis by Patent Jurisdiction
- 10.2.3.1. Analysis by Patent Jurisdiction: North American Scenario
- 10.2.3.2. Analysis by Patent Jurisdiction: European Scenario
- 10.2.3.3. Analysis by Patent Jurisdiction: Asia-Pacific Scenario
- 10.2.4. Analysis by CPC Symbols
- 10.2.5. World Cloud Analysis: Emerging Focus Areas
- 10.2.6. Analysis by Patent Age
- 10.2.7. Leading Industry Players: Analysis by Number of Patents
- 10.2.8. Leading Non-Industry Players: Analysis by Number of Patents
- 10.3. RNA Therapeutics and RNA Vaccines: Patent Benchmarking Analysis
- 10.4. RNA Therapeutics and RNA Vaccines: Patent Valuation Analysis
11. PARTNERSHIPS AND COLLABORATIONS
- 11.1. Partnership Models
- 11.2. RNA Therapeutics and RNA Vaccines: Partnerships and Collaborations
- 11.2.1. Analysis by Year of Partnership
- 11.2.2. Analysis by Type of Partnership
- 11.2.3. Analysis by Year and Type of Partnership
- 11.2.4. Analysis by Year and Type of Molecule
- 11.2.5. Analysis by Focus of Partnership
- 11.2.6. Analysis by Purpose of Partnership
- 11.2.7. Analysis by Therapeutic Area
- 11.2.8. Most Active Players: Analysis by Number of Partnerships
- 11.2.9. Analysis by Geography
- 11.2.9.1. Local and International Agreements
- 11.2.9.2. Intracontinental and Intercontinental Agreements
12. FUNDING AND INVESTMENT ANALYSIS
- 12.1. Types of Funding
- 12.2. RNA Therapeutics and RNA Vaccines: Funding and Investment Analysis
- 12.3. Analysis by Year of Funding
- 12.4. Analysis by Type of Funding
- 12.5. Analysis by Type of Molecule
- 12.6. Analysis of Amount Invested by Year of Funding
- 12.7. Analysis of Amount Invested by Type of Funding
- 12.8. Analysis by Geography
- 12.9. Analysis by Year and Type of Funding
- 12.10. Analysis by Purpose of Funding
- 12.11. Analysis by Stage of Development
- 12.12. Analysis by Therapeutic Area
- 12.13. Most Active Players: Analysis by Number of Funding Instances
- 12.14. Most Active Players: Analysis by Amount Invested
- 12.15. Leading Investors: Analysis by Number of Funding Instances
13. BIG PHARMA INITIATIVES
- 13.1. RNA Therapeutics and RNA Vaccines: Big Pharma Initiatives
- 13.1.1. Analysis by Number of Initiatives
- 13.1.2. Analysis by Year of Initiative
- 13.1.3. Analysis by Type of Initiative
- 13.1.3.1. Analysis by Type of Partnership
- 13.1.3.2. Analysis by Type of Funding
- 13.1.4. Analysis by Purpose of Initiative
- 13.1.5. Analysis by Year and Number of Initiatives
- 13.1.6. Analysis by Focus of Initiative
- 13.1.7. Analysis by Location of Headquarters of Big Pharma Players
14. OVERALL RNA THERAPEUTICS AND RNA VACCINES MARKET, till 2035
- 14.1. Key Assumptions and Methodology
- 14.2. Overall RNA Therapeutics and RNA Vaccines Market, Forecasted Estimates (till 2035)
- 14.2.1. Scenario Analysis
- 14.3. Key Market Segmentations
- 14.4. Dynamic Dashboard
15. OVERALL RNA THERAPEUTICS AND RNA VACCINES MARKET, BY TYPE OF MODALITY
- 15.1. Therapeutics: Forecasted Estimates (till 2035)
- 15.2. Vaccines: Forecasted Estimates (till 2035)
- 15.3. Data Triangulation and Validation
16. OVERALL RNA THERAPEUTICS AND RNA VACCINES MARKET, BY TYPE OF MOLECULE
- 16.1. repRNA: Forecasted Estimates (till 2035)
- 16.2. saRNA: Forecasted Estimates (till 2035)
- 16.3. sacRNA: Forecasted Estimates (till 2035)
- 16.4. sa-mRNA: Forecasted Estimates (till 2035)
- 16.5. tRNA: Forecasted Estimates (till 2035)
- 16.6. Data Triangulation and Validation
17. OVERALL RNA THERAPEUTICS AND RNA VACCINES MARKET, BY THERAPEUTIC AREA
- 17.1. Infectious Diseases: Forecasted Estimates (till 2035)
- 17.2. Oncological Disorders: Forecasted Estimates (till 2035)
- 17.3. Pulmonary Disorders: Forecasted Estimates (till 2035)
- 17.4. Data Triangulation and Validation
18. OVERALL RNA THERAPEUTICS AND RNA VACCINES MARKET, BY ROUTE OF ADMINISTRATION
- 18.1. Intradermal Therapeutics and Vaccines: Forecasted Estimates (till 2035)
- 18.2. Intramuscular Therapeutics and Vaccines: Forecasted Estimates (till 2035)
- 18.3. Intravenous Therapeutics and Vaccines: Forecasted Estimates (till 2035)
- 18.4. Data Triangulation and Validation
19. OVERALL RNA THERAPEUTICS AND RNA VACCINES MARKET, BY KEY GEOGRAPHICAL REGIONS
- 19.1. North America: Forecasted Estimates (till 2035)
- 19.1.1. US: Forecasted Estimates (till 2035)
- 19.2. Europe: Forecasted Estimates (till 2035)
- 19.2.1. France: Forecasted Estimates (till 2035)
- 19.2.2. Italy: Forecasted Estimates (till 2035)
- 19.2.3. Spain: Forecasted Estimates (till 2035)
- 19.2.4. UK: Forecasted Estimates (till 2035)
- 19.2.5. The Netherlands: Forecasted Estimates (till 2035)
- 19.3. Asia-Pacific: Forecasted Estimates (till 2035)
- 19.3.1. India: Forecasted Estimates (till 2035)
- 19.3.2. Japan: Forecasted Estimates (till 2035)
- 19.3.3. Singapore: Forecasted Estimates (till 2035)
- 19.4. Data Triangulation and Validation
20. OVERALL RNA THERAPEUTICS AND RNA VACCINES MARKET, BY LEADING PLAYERS
- 20.1. Company A
- 20.2. Company B
- 20.3. Company C
- 20.4. Company D
- 20.5. Company E
21. CONCLUSION
22. APPENDIX 1: TABULATED DATA
23. APPENDIX 2: LIST OF COMPANIES AND ORGANIZATIONS
List of Tables
- Table 6.1 List of Next Generation RNA Therapeutics and RNA Vaccines
- Table 6.2 List of Clinical Stage Next Generation RNA Therapeutics and RNA Vaccines
- Table 6.3 List of Next Generation RNA Therapeutic and RNA Vaccine Developers
- Table 7.1 List of Next Generation RNA Technologies
- Table 7.2 List of Next Generation RNA Technology / Platform Developers
- Table 8.1 Gemcovac(R): Developer Overview
- Table 8.2 Gemcovac(R): Drug Overview
- Table 8.3 Gemcovac(R): Clinical Trial Information
- Table 8.4 Gemcovac(R): Clinical Trial Endpoints
- Table 8.5 Gemcovac(R): Clinical Trial Results
- Table 8.6 ATYR1923: Developer Overview
- Table 8.7 ATYR1923: Drug Overview
- Table 8.8 ATYR1923: Clinical Trial Information
- Table 8.9 ATYR1923: Clinical Trial Endpoints
- Table 8.10 ATYR1923: Clinical Trial Results
- Table 8.11 ARCT-154: Developer Overview
- Table 8.12 ARCT-154: Drug Overview
- Table 8.13 ARCT-154: Clinical Trial Information
- Table 8.14 ARCT-154: Clinical Trial Endpoints
- Table 8.15 ARCT-154: Clinical Trial Results
- Table 8.16 GRT-C901: Developer Overview
- Table 8.17 GRT-C901: Drug Overview
- Table 8.18 GRT-C901: Clinical Trial Information
- Table 8.19 GRT-C901: Clinical Trial Endpoints
- Table 8.20 GRT-C901: Clinical Trial Results
- Table 8.21 VLPCOV-01: Developer Overview
- Table 8.22 VLPCOV-01: Drug Overview
- Table 8.23 AVX-901: Developer Overview
- Table 8.24 AVX-901: Drug Overview
- Table 8.25 AVX-901: Clinical Trial Information
- Table 8.26 AVX-901: Clinical Trial Endpoints
- Table 8.27 AVX-901: Clinical Trial Results
- Table 8.28 MTL-CEBPA + Sorafenib: Developer Overview
- Table 8.29 MTL-CEBPA + Sorafenib: Drug Overview
- Table 8.30 MTL-CEBPA + Sorafenib: Clinical Trial Information
- Table 8.31 MTL-CEBPA + Sorafenib: Clinical Trial Endpoints
- Table 8.32 MTL-CEBPA + Sorafenib: Clinical Trial Results
- Table 8.33 SLATE: Developer Overview
- Table 8.34 SLATE: Drug Overview
- Table 8.35 SLATE: Clinical Trial Information
- Table 8.36 SLATE: Clinical Trial Endpoints
- Table 8.37 SLATE: Clinical Trial Results
- Table 9.1 RNA Therapeutics and RNA Vaccines: List of Clinical Trials
- Table 10.1 RNA Therapeutics and RNA Vaccines: List of Filed / Granted Patents, since 2019
- Table 11.1 RNA Therapeutics and RNA Vaccines: List of Partnerships and Collaborations, since 2019
- Table 12.1 RNA Therapeutics and RNA Vaccines: List of Funding and Investments, since 2019
- Table 13.1 RNA Therapeutics and RNA Vaccines: List of Big Pharma Initiatives, since 2019
- Table 14.1 RNA Therapeutics and RNA Vaccines Market: Expected Launch Year of Forecasted Drug Candidates
- Table 22.1 Next Generation RNA Therapies: Distribution by Type of Modality
- Table 22.2 Next Generation RNA Therapies: Distribution by Type of Molecule
- Table 22.3 Next Generation RNA Therapies: Distribution by Delivery Vehicle
- Table 22.4 Next Generation RNA Therapies: Distribution by Phase of Development
- Table 22.5 Next Generation RNA Therapies: Distribution by Therapeutic Area
- Table 22.6 Most Active Players: Distribution by Number of Therapies
- Table 22.7 Clinical Stage Therapies: Distribution by Phase of Development
- Table 22.8 Clinical Stage Therapies: Distribution by Route of Administration
- Table 22.9 Clinical Stage Therapies: Distribution by Therapeutic Area
- Table 22.10 Therapy Developer Landscape: Distribution by Year of Establishment
- Table 22.11 Therapy Developer Landscape: Distribution by Company Size
- Table 22.12 Therapy Developer Landscape: Distribution by Location of Headquarters
- Table 22.13 circRNA Therapies:Distribution by Phase of Development
- Table 22.14 circRNA Therapies:Distribution by Therapeutic Area
- Table 22.15 Most Active Players: Distribution by Number of circRNA Therapies
- Table 22.16 saRNA Therapies:Distribution by Phase of Development
- Table 22.17 saRNA Therapies: Distribution by Therapeutic Area
- Table 22.18 Most Active Players: Distribution by Number of saRNA Therapies
- Table 22.19 Next Generation RNA Technologies: Distribution by Class of Molecule
- Table 22.20 Next Generation RNA Technologies: Distribution by Type of Molecule
- Table 22.21 Next Generation RNA Technologies: Distribution by Capabilities of the Technology
- Table 22.22 Next Generation RNA Technologies: Distribution by Therapeutic Area
- Table 22.23 Next Generation RNA Technologies: Distribution by Highest Phase of Development
- Table 22.24 Technology Developer Landscape: Distribution by Year of Establishment
- Table 22.25 Technology Developer Landscape: Distribution by Company Size
- Table 22.26 Technology Developer Landscape: Distribution by Location of Headquarters
- Table 22.27 Technology Developer Landscape: Distribution by Operational Model
- Table 22.28 Gemcovac(R): Estimated Sales
- Table 22.29 ATYR1923: Estimated Sales
- Table 22.30 ARCT-154: Estimated Sales
- Table 22.31 GRT-C901: Estimated Sales
- Table 22.32 VLPCOV-01: Estimated Sales
- Table 22.33 AVX901: Estimated Sales
- Table 22.34 MTL-CEBPA + Sorafenib: Estimated Sales
- Table 22.35 SLATE: Estimated Sales
- Table 22.36 Clinical Trial Analysis: Cumulative Year-wise Trend
- Table 22.37 Clinical Trial Analysis: Distribution by Trial Status
- Table 22.38 Clinical Trial Analysis: Distribution by Trial Registration Year and Trial Status
- Table 22.39 Clinical Trial Analysis: Distribution by Trial Phase
- Table 22.40 Clinical Trial Analysis: Distribution by Patients Enrolled
- Table 22.41 Clinical Trial Analysis: Distribution by Type of Sponsor
- Table 22.42 Clinical Trial Analysis: Distribution by Therapeutic Area
- Table 22.43 Clinical Trial Analysis: Distribution by Study Design
- Table 22.44 Leading Organizations: Distribution by Number of Trials
- Table 22.45 Clinical Trial Analysis: Distribution by Focus Area
- Table 22.46 Clinical Trial Analysis: Distribution by Geography
- Table 22.47 Patent Analysis: Distribution by Type of Patent
- Table 22.48 Patent Analysis: Cumulative Year-wise Trend, since 2019
- Table 22.49 Patent Analysis: Distribution by Patent Jurisdiction
- Table 22.50 Patent Jurisdiction: North American Scenario
- Table 22.51 Patent Jurisdiction: European Scenario
- Table 22.52 Patent Jurisdiction: Asia-Pacific Scenario
- Table 22.53 Patent Analysis: Distribution by Patent Age
- Table 22.54 Patent Analysis: Distribution by CPC Symbols
- Table 22.55 Leading Industry Players: Distribution by Number of Patents
- Table 22.56 Leading Non-Industry Players: Distribution by Number of Patents
- Table 22.57 Patent Analysis: Distribution by Patent Characteristics
- Table 22.58 RNA Therapeutics and RNA Vaccines: Patent Valuation Analysis
- Table 22.59 Partnerships and Collaborations: Cumulative Year-wise Trend, since 2019
- Table 22.60 Partnerships and Collaborations: Distribution by Type of Partnership
- Table 22.61 Partnerships and Collaborations: Distribution by Year and Type of Partnership, since 2019
- Table 22.62 Partnerships and Collaborations: Distribution by Year and Type of Molecule, since 2019
- Table 22.63 Partnerships and Collaborations: Distribution by Focus of Partnership
- Table 22.64 Partnerships and Collaborations: Distribution by Purpose of Partnership
- Table 22.65 Partnerships and Collaborations: Distribution by Therapeutic Area
- Table 22.66 Most Active Players: Distribution by Number of Partnerships
- Table 22.67 Partnerships and Collaborations: Local and International Deals
- Table 22.68 Partnerships and Collaborations: Intercontinental and Intracontinental Deals
- Table 22.69 Funding and Investment Analysis: Cumulative Year-wise Trend, since 2019
- Table 22.70 Funding and Investment Analysis: Distribution by Type of Funding
- Table 22.71 Funding and Investment Analysis: Distribution by Type of Molecule
- Table 22.72 Funding and Investment Analysis: Cumulative Amount Invested by Year, since 2019 (USD Million)
- Table 22.73 Funding and Investment Analysis: Distribution of Amount Invested by Type of Funding (USD Million)
- Table 22.74 Funding and Investment Analysis: Distribution of Amount Invested by Geography (USD Million)
- Table 22.75 Funding and Investment Analysis: Distribution by Year and Type of Funding, since 2019
- Table 22.76 Funding and Investment Analysis: Distribution by Purpose of Funding
- Table 22.77 Funding and Investment Analysis: Distribution by Stage of Development
- Table 22.78 Funding and Investment Analysis: Distribution by Therapeutic Area
- Table 22.79 Most Active Players: Distribution by Number of Funding Instances
- Table 22.80 Most Active Players: Distribution by Amount Invested (USD Million)
- Table 22.81 Leading Investors: Distribution by Number of Funding Instances
- Table 22.82 Big Pharma Initiatives: Distribution by Number of Initiatives
- Table 22.83 Big Pharma Initiatives: Cumulative Distribution by Year of Initiative, since 2019
- Table 22.84 Big Pharma Initiatives: Distribution by Type of Initiative
- Table 22.85 Big Pharma Initiatives: Cumulative Distribution by Purpose of Initiative
- Table 22.86 Big Pharma Initiatives: Cumulative Year-wise Trend, since 2019
- Table 22.87 Big Pharma Initiatives: Distribution by Focus of Initiative
- Table 22.88 Big Pharma Initiatives: Distribution by Location of Headquarters of Big Pharma Players
- Table 22.89 Global RNA Therapeutics and RNA Vaccines Market, Forecasted Estimates (till 2035), Base Scenario (USD Million)
- Table 22.90 Global RNA Therapeutics and RNA Vaccines Market, Forecasted Estimates (till 2035), Conservative Scenario (USD Million)
- Table 22.91 Global RNA Therapeutics and RNA Vaccines Market, Forecasted Estimates (till 2035), Optimistic Scenario (USD Million)
- Table 22.92 Global RNA Therapeutics and RNA Vaccines Market: Distribution by Type of Modality, 2023, 2028 and 2035 (USD Million)
- Table 22.93 Global RNA Therapeutics Market, Forecasted Estimates (till 2035) (USD Million)
- Table 22.94 Global RNA Vaccines Market, Forecasted Estimates (till 2035) (USD Million)
- Table 22.95 Global RNA Therapeutics and RNA Vaccines Market: Distribution by Type of Molecule, 2023, 2028 and 2035 (USD Million)
- Table 22.96 Global repRNA Therapeutics Vaccines Market, Forecasted Estimates (till 2035) (USD Million)
- Table 22.97 Global saRNA Therapeutics and Vaccines Market, Forecasted Estimates (till 2035) (USD Million)
- Table 22.98 Global sacRNA Therapeutics and Vaccines Market, Forecasted Estimates (till 2035) (USD Million)
- Table 22.99 Global sa-mRNA Therapeutics and Vaccines Market, Forecasted Estimates (till 2035) (USD Million)
- Table 22.100 Global tRNA Therapeutics and Vaccines Market, Forecasted Estimates (till 2035) (USD Million)
- Table 22.101 Global RNA Therapeutics and RNA Vaccines Market: Distribution by Therapeutic Area, 2023, 2028 and 2035 (USD Million)
- Table 22.102 Global RNA Therapeutics and RNA Vaccines Market for Infectious Diseases, Forecasted Estimates (till 2035) (USD Million)
- Table 22.103 Global RNA Therapeutics and RNA Vaccines Market for Oncological Disorders, Forecasted Estimates (till 2035) (USD Million)
- Table 22.104 Global RNA Therapeutics and RNA Vaccines Market for Pulmonary Disorders, Forecasted Estimates (till 2035) (USD Million)
- Table 22.105 Global RNA Therapeutics and RNA Vaccines Market: Distribution by Route of Administration, 2023, 2028 and 2035 (USD Million)
- Table 22.106 Global RNA Therapeutics and RNA Vaccines Market for Intradermal Therapeutics / Vaccines, Forecasted Estimates (till 2035) (USD Million)
- Table 22.107 Global RNA Therapeutics and RNA Vaccines Market for Intramuscular Therapeutics / Vaccines, Forecasted Estimates (till 2035) (USD Million)
- Table 22.108 Global RNA Therapeutics and RNA Vaccines Market for Intravenous Therapeutics / Vaccines, Forecasted Estimates (till 2035) (USD Million)
- Table 22.109 Global RNA Therapeutics and RNA Vaccines Market: Distribution by Key Geographical Regions, 2023, 2028 and 2035 (USD Million)
- Table 22.110 RNA Therapeutics and RNA Vaccines Market in North America, Forecasted Estimates (till 2035) (USD Million)
- Table 22.111 RNA Therapeutics and RNA Vaccines Market in the US, Forecasted Estimates (till 2035) (USD Million)
- Table 22.112 RNA Therapeutics and RNA Vaccines Market in Europe, Forecasted Estimates (till 2035) (USD Million)
- Table 22.113 RNA Therapeutics and RNA Vaccines Market in France, Forecasted Estimates (till 2035) (USD Million)
- Table 22.114 RNA Therapeutics and RNA Vaccines Market in Italy, Forecasted Estimates (till 2035) (USD Million)
- Table 22.115 RNA Therapeutics and RNA Vaccines Market in Spain, Forecasted Estimates (till 2035) (USD Million)
- Table 22.116 RNA Therapeutics and RNA Vaccines Market in the UK, Forecasted Estimates (till 2035) (USD Million)
- Table 22.117 RNA Therapeutics and RNA Vaccines Market in the Netherlands, Forecasted Estimates (till 2035) (USD Million)
- Table 22.118 RNA Therapeutics and RNA Vaccines Market in Asia-Pacific, Forecasted Estimates (till 2035) (USD Million)
- Table 22.119 RNA Therapeutics and RNA Vaccines Market in India, Forecasted Estimates (till 2035) (USD Million)
- Table 22.120 RNA Therapeutics and RNA Vaccines Market in Japan, Forecasted Estimates (till 2035) (USD Million)
- Table 22.121 RNA Therapeutics and RNA Vaccines Market in Singapore, Forecasted Estimates (till 2035) (USD Million)
- Table 22.122 Global RNA Therapeutics and RNA Vaccines Market: Distribution by Leading Players, 2023, 2028 and 2035 (USD Million)
List of Figures
- Figure 4.1 Executive Summary: Overall Market Landscape
- Figure 4.2 Executive Summary: Overall Technology Landscape
- Figure 4.3 Executive Summary: Clinical Trial Analysis
- Figure 4.4 Executive Summary: Patent Analysis
- Figure 4.5 Executive Summary: Partnerships and Collaborations
- Figure 4.6 Executive Summary: Funding and Investment Analysis
- Figure 4.7 Executive Summary: Big Pharma Initiatives
- Figure 4.8 Executive Summary: Market Forecast and Opportunity Analysis
- Figure 5.1 Key Contributors in the Evolution of Next Generation RNA Therapeutics and Vaccines
- Figure 5.2 Key Aspects of Next Generation RNA Molecules
- Figure 5.3 Key Challenges Associated with Traditional RNA Modalities
- Figure 5.4 Advantages of Using Next Generation RNA Modalities
- Figure 6.1 Next Generation RNA Therapies: Distribution by Type of Modality
- Figure 6.2 Next Generation RNA Therapies: Distribution by Type of Molecule
- Figure 6.3 Next Generation RNA Therapies: Distribution by Delivery Vehicle
- Figure 6.4 Next Generation RNA Therapies: Distribution by Phase of Development
- Figure 6.5 Next Generation RNA Therapies: Distribution by Therapeutic Area
- Figure 6.6 Most Active Players: Distribution by Number of Therapies
- Figure 6.7 Clinical Stage Therapies: Distribution by Phase of Development
- Figure 6.8 Clinical Stage Therapies: Distribution by Route of Administration
- Figure 6.9 Clinical Stage Therapies: Distribution by Therapeutic Area
- Figure 6.10 Therapy Developer Landscape:Distribution by Year of Establishment
- Figure 6.11 Therapy Developer Landscape:Distribution by Company Size
- Figure 6.12 Therapy Developer Landscape:Distribution by Location of Headquarters
- Figure 6.13 circRNA Therapies:Distribution by Phase of Development
- Figure 6.14 circRNA Therapies:Distribution by Therapeutic Area
- Figure 6.15 Most Active Players: Distribution by Number of circRNA Therapies
- Figure 6.16 saRNA Therapies:Distribution by Phase of Development
- Figure 6.17 saRNA Therapies:Distribution by Therapeutic Area
- Figure 6.18 Most Active Players: Distribution by Number of saRNA Therapies
- Figure 7.1 Next Generation RNA Technologies: Distribution by Class of Molecule
- Figure 7.2 Next Generation RNA Technologies: Distribution by Type of Molecule
- Figure 7.3 Next Generation RNA Technologies: Distribution by Capabilities of the Technology
- Figure 7.4 Next Generation RNA Technologies: Distribution by Therapeutic Area
- Figure 7.5 Next Generation RNA Technologies: Distribution by Highest Phase of Development
- Figure 7.6 Technology Developer Landscape: Distribution by Year of Establishment
- Figure 7.7 Technology Developer Landscape: Distribution by Company Size
- Figure 7.8 Technology Developer Landscape: Distribution by Location of Headquarters
- Figure 7.9 Technology Developer Landscape: Distribution by Operational Model
- Figure 8.1 Gemcovac(R): Estimated Sales
- Figure 8.2 ATYR1923: Estimated Sales
- Figure 8.3 ARCT-154: Estimated Sales
- Figure 8.4 GRT-C901: Estimated Sales
- Figure 8.5 VLPCOV-01: Estimated Sales
- Figure 8.6 AVX901: Estimated Sales
- Figure 8.7 MTL-CEBPA + Sorafenib: Estimated Sales
- Figure 8.8 SLATE: Estimated Sales
- Figure 9.1 Clinical Trial Analysis: Cumulative Year-wise Trend, Pre-since 2019
- Figure 9.2 Clinical Trial Analysis: Distribution by Trial Status
- Figure 9.3 Clinical Trial Analysis: Distribution by Trial Registration Year and Trial Status, Pre-2019-2022
- Figure 9.4 Clinical Trial Analysis: Distribution by Trial Phase
- Figure 9.5 Clinical Trial Analysis: Distribution by Patients Enrolled
- Figure 9.6 Clinical Trial Analysis: Distribution by Type of Sponsor
- Figure 9.7 Clinical Trial Analysis: Distribution by Therapeutic Area
- Figure 9.8 Clinical Trial Analysis: Distribution by Study Design
- Figure 9.9 Leading Organizations: Distribution by Number of Trials
- Figure 9.10 Clinical Trial Analysis: Distribution by Focus Area
- Figure 9.11 Clinical Trial Analysis: Distribution by Geography
- Figure 10.1 Patent Analysis: Distribution by Type of Patent
- Figure 10.2 Patent Analysis: Cumulative Year-wise Trend, since 2019
- Figure 10.3 Patent Analysis: Distribution by Patent Jurisdiction
- Figure 10.4 Patent Jurisdiction: North American Scenario
- Figure 10.5 Patent Jurisdiction: European Scenario
- Figure 10.6 Patent Jurisdiction: Asia-Pacific Scenario
- Figure 10.7 Patent Analysis: Distribution by Patent Age
- Figure 10.8 Patent Analysis: Distribution by CPC Symbols
- Figure 10.9 Word Cloud Analysis: Emerging Focus Areas
- Figure 10.10 Leading Industry Players: Distribution by Number of Patents
- Figure 10.11 Leading Non-Industry Players: Distribution by Number of Patents
- Figure 10.12 Patent Analysis: Distribution by Patent Characteristics
- Figure 10.13 RNA Therapeutics and RNA Vaccines: Patent Valuation Analysis
- Figure 11.1 Partnerships and Collaborations: Cumulative Year-wise Trend, since 2019
- Figure 11.2 Partnerships and Collaborations: Distribution by Type of Partnership
- Figure 11.3 Partnerships and Collaborations: Distribution by Year and Type of Partnership, since 2019
- Figure 11.4 Partnerships and Collaborations: Distribution by Year and Type of Molecule, since 2019
- Figure 11.5 Partnerships and Collaborations: Distribution by Focus of Partnership
- Figure 11.6 Partnerships and Collaborations: Distribution by Purpose of Partnership
- Figure 11.7 Partnerships and Collaborations: Distribution by Therapeutic Area
- Figure 11.8 Most Active Players: Distribution by Number of Partnerships
- Figure 11.9 Partnerships and Collaborations: Local and International Deals
- Figure 11.10 Partnerships and Collaborations: Intercontinental and Intracontinental Deals
- Figure 12.1 Funding and Investment Analysis: Cumulative Year-wise Trend, since 2019
- Figure 12.2 Funding and Investment Analysis: Distribution by Type of Funding
- Figure 12.3 Funding and Investment Analysis: Distribution by Type of Molecule
- Figure 12.4 Funding and Investment Analysis: Cumulative Amount Invested by Year, since 2019 (USD Million)
- Figure 12.5 Funding and Investment Analysis: Distribution of Amount Invested by Type of Funding (USD Million)
- Figure 12.6 Funding and Investment Analysis: Distribution of Amount Invested by Geography (USD Million
- Figure 12.7 Funding and Investment Analysis: Distribution by Year and Type of Funding, since 2019
- Figure 12.8 Funding and Investment Analysis: Distribution by Purpose of Funding
- Figure 12.9 Funding and Investment Analysis: Distribution by Stage of Development
- Figure 12.10 Funding and Investment Analysis: Distribution by Therapeutic Area
- Figure 12.11 Most Active Players: Distribution by Number of Funding Instances
- Figure 12.12 Most Active Players: Distribution by Amount Invested (USD Million)
- Figure 12.13 Leading Investors: Distribution by Number of Funding Instances
- Figure 13.1 Big Pharma Initiatives: Distribution by Number of Initiatives
- Figure 13.2 Big Pharma Initiatives: Cumulative Distribution by Year of Initiative
- Figure 13.3 Big Pharma Initiatives: Distribution by Type of Initiative
- Figure 13.4 Big Pharma Initiatives: Cumulative Distribution by Purpose of Initiative
- Figure 13.5 Big Pharma Initiatives: Cumulative Year-wise Trend, since 2019
- Figure 13.6 Big Pharma Initiatives: Distribution by Focus of Initiative
- Figure 13.7 Big Pharma Initiatives: Distribution by Location of Headquarters of Big Pharma Players
- Figure 14.1 Global RNA Therapeutics and RNA Vaccines Market, Forecasted Estimates (till 2035), Base Scenario (USD Million)
- Figure 14.2 Global RNA Therapeutics and RNA Vaccines Market, Forecasted Estimates (till 2035), Conservative Scenario (USD Million)
- Figure 14.3 Global RNA Therapeutics and RNA Vaccines Market, Forecasted Estimates (till 2035), Optimistic Scenario (USD Million)
- Figure 15.1 Global RNA Therapeutics and RNA Vaccines Market: Distribution by Type of Modality, 2023, 2028 and 2035 (USD Million)
- Figure 15.2 Global RNA Therapeutics Market, Forecasted Estimates (till 2035) (USD Million)
- Figure 15.3 Global RNA Vaccines Market, Forecasted Estimates (till 2035) (USD Million)
- Figure 16.1 Global RNA Therapeutics and RNA Vaccines Market: Distribution by Type of Molecule, 2023, 2028 and 2035 (USD Million)
- Figure 16.2 Global repRNA Therapeutics Vaccines Market, Forecasted Estimates (till 2035) (USD Million)
- Figure 16.3 Global saRNA Therapeutics and Vaccines Market, Forecasted Estimates (till 2035) (USD Million)
- Figure 16.4 Global sacRNA Therapeutics and Vaccines Market, Forecasted Estimates (till 2035) (USD Million)
- Figure 16.5 Global sa-mRNA Therapeutics and Vaccines Market, Forecasted Estimates (till 2035) (USD Million)
- Figure 16.6 Global tRNA Therapeutics and Vaccines Market, Forecasted Estimates (till 2035) (USD Million)
- Figure 17.1 Global RNA Therapeutics and RNA Vaccines Market: Distribution by Therapeutic Area, 2023, 2028 and 2035 (USD Million)
- Figure 17.2 Global RNA Therapeutics and RNA Vaccines Market for Infectious Diseases, Forecasted Estimates (till 2035) (USD Million)
- Figure 17.3 Global RNA Therapeutics and RNA Vaccines Market for Oncological Disorders, Forecasted Estimates (till 2035) (USD Million)
- Figure 17.4 Global RNA Therapeutics and RNA Vaccines Market for Pulmonary Disorders, Forecasted Estimates (till 2035) (USD Million)
- Figure 18.1 Global RNA Therapeutics and RNA Vaccines Market: Distribution by Route of Administration, 2023, 2028 and 2035 (USD Million)
- Figure 18.2 Global RNA Therapeutics and RNA Vaccines Market for Intradermal Therapeutics / Vaccines, Forecasted Estimates (till 2035) (USD Million)
- Figure 18.3 Global RNA Therapeutics and RNA Vaccines Market for Intramuscular Therapeutics / Vaccines, Forecasted Estimates (till 2035) (USD Million)
- Figure 18.4 Global RNA Therapeutics and RNA Vaccines Market for Intravenous Therapeutics / Vaccines, Forecasted Estimates (till 2035) (USD Million)
- Figure 19.1 Global RNA Therapeutics and RNA Vaccines Market: Distribution by Key Geographical Regions, 2023, 2028 and 2035 (USD Million)
- Figure 19.2 RNA Therapeutics and RNA Vaccines Market in North America, Forecasted Estimates (till 2035) (USD Million)
- Figure 19.3 RNA Therapeutics and RNA Vaccines Market in the US, Forecasted Estimates (till 2035) (USD Million)
- Figure 19.4 RNA Therapeutics and RNA Vaccines Market in Europe, Forecasted Estimates (till 2035) (USD Million)
- Figure 19.5 RNA Therapeutics and RNA Vaccines Market in France, Forecasted Estimates (till 2035) (USD Million)
- Figure 19.6 RNA Therapeutics and RNA Vaccines Market in Italy, Forecasted Estimates (till 2035) (USD Million)
- Figure 19.7 RNA Therapeutics and RNA Vaccines Market in Spain, Forecasted Estimates (till 2035) (USD Million)
- Figure 19.8 RNA Therapeutics and RNA Vaccines Market in the UK, Forecasted Estimates (till 2035) (USD Million)
- Figure 19.9 RNA Therapeutics and RNA Vaccines Market in the Netherlands, Forecasted Estimates (till 2035) (USD Million)
- Figure 19.10 RNA Therapeutics and RNA Vaccines Market in Asia-Pacific, Forecasted Estimates (till 2035) (USD Million)
- Figure 19.11 RNA Therapeutics and RNA Vaccines Market in India, Forecasted Estimates (till 2035) (USD Million)
- Figure 19.12 RNA Therapeutics and RNA Vaccines Market in Japan, Forecasted Estimates (till 2035) (USD Million)
- Figure 19.13 RNA Therapeutics and RNA Vaccines Market in Singapore, Forecasted Estimates (till 2035) (USD Million)
- Figure 20.1 RNA Therapeutics and RNA Vaccines Market: Distribution by Leading Players, 2023, 2028 and 2035 (USD Million)

