
PUBLISHER: Roots Analysis | PRODUCT CODE: 1682702

PUBLISHER: Roots Analysis | PRODUCT CODE: 1682702
Oncology Precision Medicine Market by Type of Cancer Targeted, Route of Administration, Type of Molecule, Drug Class, Key Geographical Regions, Leading Drug Developers and Sales Forecast: Industry Trends and Global Forecasts, Till 2035
ONCOLOGY PRECISION MEDICINE MARKET: OVERVIEW
As per Roots Analysis, the global oncology precision medicine market is estimated to grow from USD 147.9 billion in the current year to USD 364 billion by 2035, at a CAGR of 8.5% during the forecast period, till 2035.
The market sizing and opportunity analysis has been segmented across the following parameters:
Type of Cancer Targeted
- Bladder Cancer
- Blood / Hematologic Cancer
- Breast Cancer
- Cervical Cancer
- Gastrointestinal Cancer
- Head and Neck Squamous Cell Cancer
- Lung Cancer
- Skin Cancer
- Others
Route of Administration
- Oral
- Intravenous
- Others
Type of Molecule
- Small Molecules
- Biologics
Drug Class
- Kinase Inhibitors
- Enzyme Inhibitors
- Immune Checkpoint Inhibitors
- Others
Leading Drug Developers
- Merck
- Pfizer
- AstraZeneca
- Johnson & Johnson Innovative Medicine
- Genentech
Key Geographical Regions
- North America (US, Canada)
- Europe (France, Germany, Italy, Spain and UK)
- Asia (China, Japan, Korea and India)
- Middle East and North Africa (UAE, Israel, Qatar and Rest of Middle East and North Africa)
- Latin America (Brazil, Argentina, Chile and Rest of Latin America)
ONCOLOGY PRECISION MEDICINE MARKET: GROWTH AND TRENDS
Cancer is recognized as one of the deadliest diseases, accounting for an alarming global toll of approximately 20 million new cases and 10 million fatalities. According to the World Health Organization, the cancer burden is anticipated to rise by nearly 60 % by 2040. Currently, several conventional approaches, including surgery, radiation therapy, chemotherapy and nonconventional or complementary therapeutic methods, including hormone therapy, immunotherapy and nanotherapy are available for treating these causative variables. However, these approaches are unable to deal with intrinsic carcinogenic genetic abnormalities, owing to the fact that these irregularities are unique to each individual patient. In order to address this, precision medicine, often known as personalized medicine, emerged as a possible solution, which uses genomic knowledge to provide gene-targeted diagnostics and therapeutics. The concept of precision medicine takes into account the tumor features, genetic data, lifestyle and environmental effects to provide tailored medicines and holds significant potential in treating oncological disorders by shifting away from a one-size-fits-all approach. Given the ongoing pace of innovation, and increasing preference for personalized healthcare, the oncology precision medicine market is poised to experience a noteworthy growth in the foreseen future.
ONCOLOGY PRECISION MEDICINE MARKET: KEY INSIGHTS
The report delves into the current state of the oncology precision medicine market and identifies potential growth opportunities within the industry. Some key findings from the report include:
1. Presently over 125 drug developers, worldwide, are engaged in developing oncology precision medicines targeting various cancers; around 90% of these developers are headquartered in developed geographies.
2. Close to 55% of the oncology precision medicines have been commercialized; of these, close to 28% of the drugs target blood / hematologic type of cancer.

3. Around 85% oncology precision medicines in the preclinical and discovery stages of development are small molecules; of these, more than 30% of the drugs target kinase proteins.
4. In pursuit of expanding the oncology precision medicines pipeline, the partnership activity in this domain has witnessed substantial growth with an annualized rate of 16% over the last five years.
5. Close to one million patients have been recruited / enrolled in clinical trials, registered for the evaluation of oncology precision medicines, across different geographies.
6. Majority of the oncology precision medicine assay kits developers are headquartered in North America; further, more than 30% of the market is captured by large players established post-1990.
7. Around 80% of oncology precision medicine assay kits are diagnostic tests; over 55% of such kits can diagnose, prognose and predict various cancers and provide results within ten days.
8. Owing to the advantages offered by precision medicines in cancer, along with lesser side effects and high response rate, the preference for such drugs will steadily increase in foreseeable future.
9. With the rapid increase in the demand for gene-targeted drugs in the treatment of cancer, the opportunity for companies developing oncology precision medicines is poised to grow at a CAGR of close to 10%.
ONCOLOGY PRECISION MEDICINE MARKET: KEY SEGMENTS
Blood / Hematologic Cancer Occupies the Largest Share of the Oncology Precision Medicine Market
Based on target cancer, the market is segmented into bladder cancer, blood / hematologic cancer, breast cancer, cervical cancer, gastrointestinal cancer, head and neck squamous cell cancer, lung cancer, skin cancer and others. At present, blood / hematologic cancer segment holds the maximum share of the oncology precision medicine market. This can be attributed to the high incidence rate of blood / hematologic cancer, accounting for approximately 1.24 million cases worldwide. It is worth highlighting that the precision oncology market for gastrointestinal cancer is likely to grow at a relatively higher CAGR.
Oral Route of Administration is the Fastest Growing Segment of the Oncology Precision Medicine Market During the Forecast Period
Based on the route of administration, the market is segmented into oral and intravenous route of administration. It is worth highlighting that in the coming years, the oral route is anticipated to grow at a relatively faster pace. This can be attributed to the various advantages offered by oral routes of administration, such as non-invasiveness, higher patient compliance and ease of administration.
Biologics Occupy the Largest Share of the Oncology Precision Medicine Market
Based on the type of molecule, the market is segmented into small molecules and biologics. At present, biologics captures the highest share of the oncology precision medicine market. However, in the coming years, small molecules are anticipated to grow at a relatively faster pace. This can be attributed to the ability of small molecules to easily pass through the cell membranes, enabling selective targeting of biomarkers expressed on the tumor cells.
Kinase Inhibitor Segment is Likely to Dominate the Oncology Precision Medicine Market During the Forecast Period
Based on the drug class, the market is segmented into kinase inhibitors, enzyme inhibitors, immune checkpoint inhibitors and others. It is worth highlighting that, at present, kinase inhibitors hold a larger share of the oncology precision medicine market. This trend is likely to remain the same in the coming decade.
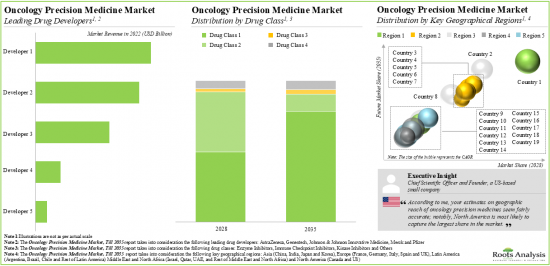
North America Accounts for the Largest Share of the Market
Based on key geographical regions, the market is segmented into North America, Europe, Asia, Middle East and North Africa, and Latin America. The majority of the share is expected to be captured by drug developers based in North America. It is worth highlighting that, over the years, the market in Asia-Pacific is expected to grow at a higher CAGR. This can be primarily attributed to the low cost investment for conducting clinical trials in Asian countries.
Example Players in the Oncology Precision Medicine Market
- AbbVie
- Anticancer Bioscience
- Astellas Pharma
- AstraZeneca
- Bayer
- Blueprint Medicines
- Bristol Myers Squibb
- Eli Lilly
- Erasca
- Genentech
- GlaxoSmithKline
- Hutchmed
- IDEAYA Biosciences
- Jiangsu Hengrui Pharmaceuticals
- Johnson & Johnson Innovative Medicine
- Merck
- Novartis
- Pfizer
- Repare Therapeutics
- Roche
- Seagen
- SpringWorks Therapeutics
- Takeda Pharmaceutical
- VERAXA Biotech GmbH
- VRise Therapeutics
ONCOLOGY PRECISION MEDICINE MARKET: RESEARCH COVERAGE
- Market Sizing and Opportunity Analysis: The report features an in-depth analysis of the oncology precision medicine market, focusing on key market segments, including [A] type of cancer targeted, [B] route of administration, [C] type of molecule, [D] drug class, [E] key geographical regions and [F] leading drug developers.
- Market Landscape: A comprehensive evaluation of commercialized and clinical stage oncology precision medicines, considering various parameters, such as [A] stage of development, [B] approval body, [C] approval region, [D] drug designation, [E] type of molecule, [F] drug class, [G] route of administration, [H] dosage regimen, [I] patient population and [K] type of cancer targeted. Furthermore, the chapter includes a detailed analysis of the current landscape of discovery and preclinical stage oncology precision medicines, based on several relevant parameters, such as [L] stage of development, [M] type of molecule, [N] drug class and [O] type of cancer targeted. Additionally, the chapter features information on various drug developers, along with analysis based on multiple parameters, such as [P] year of establishment, [Q] company size and [R] location of headquarters.
- Company Profiles: In-depth profiles of key industry players engaged in oncology precision medicine market, focusing on [A] company overviews, [B] financial information (if available), [C] oncology precision medicine portfolio, [D] recent developments and [E] an informed future outlook.
- Partnerships and Collaborations: An analysis of partnerships established in this sector, since 2018, covering clinical trial agreements, commercialization agreements, drug development agreements, drug development and commercialization agreements, drug distribution agreements, drug licensing agreements, manufacturing agreements, mergers / acquisitions, process development and manufacturing agreements, research agreements, research and development agreements, service agreements, technology utilization agreements and others.
- Clinical Trial Analysis: Examination of completed, ongoing, and planned clinical studies related to oncology precision medicine based on several parameters, such as [A] trial registration year, [B] number of patients enrolled, [C] trial phase, [D] trial status, [E] target patient population, [F] patient gender, [G] type of cancer targeted, [H] type of sponsor / collaborator, [I] study design, [J] most active sponsor / collaborator (leading industry and non-industry players based on the number of clinical trials sponsored), [K] emerging focus areas and [L] geography.
- Case Study: A general discussion on the precision oncology assay kit developers, providing detailed analysis on various parameters such as [A] stage of development, [B] regulatory certification / compliance, [C] regional availability, [D] type of test, [E] type of sample, [F] principle of biomarker detection, [G] turnaround time, [H] type of cancer targeted and [I] end-user. Further, the chapter features information on various assay kit developers, along with analysis based on multiple parameters, such as [J] year of establishment, [K] company size and [L] location of headquarters.
- Market Impact Analysis: The report analyzes various factors such as drivers, restraints, opportunities, and challenges affecting the market growth.
KEY QUESTIONS ANSWERED IN THIS REPORT
- How many companies are currently engaged in this market?
- Which are the leading companies in this market?
- What kind of partnership models are commonly adopted by industry stakeholders?
- What are the factors that are likely to influence the evolution of this market?
- What is the current and future market size?
- What is the CAGR of this market?
- How is the current and future market opportunity likely to be distributed across key market segments?
REASONS TO BUY THIS REPORT
- The report provides a comprehensive market analysis, offering detailed revenue projections of the overall market and its specific sub-segments. This information is valuable to both established market leaders and emerging entrants.
- Stakeholders can leverage the report to gain a deeper understanding of the competitive dynamics within the market. By analyzing the competitive landscape, businesses can make informed decisions to optimize their market positioning and develop effective go-to-market strategies.
- The report offers stakeholders a comprehensive overview of the market, including key drivers, barriers, opportunities, and challenges. This information empowers stakeholders to stay abreast of market trends and make data-driven decisions to capitalize on growth prospects.
ADDITIONAL BENEFITS
- Complimentary PPT Insights Packs
- Complimentary Excel Data Packs for all Analytical Modules in the Report
- 10% Free Content Customization
- Detailed Report Walkthrough Session with Research Team
- Free Updated report if the report is 6-12 months old or older
TABLE OF CONTENTS
1. PREFACE
- 1.1. Introduction
- 1.2. Market Share Insights
- 1.3. Key Market Insights
- 1.4. Report Coverage
- 1.5. Key Questions Answered
- 1.6. Chapter Outlines
2. RESEARCH METHODOLOGY
- 2.1. Chapter Overview
- 2.2. Research Assumptions
- 2.3. Project Methodology
- 2.4. Forecast Methodology
- 2.5. Robust Quality Control
- 2.6. Key Market Segmentations
- 2.7. Key Considerations
- 2.7.1. Demographics
- 2.7.2. Economic Factors
- 2.7.3. Government Regulations
- 2.7.4. Supply Chain
- 2.7.5. COVID Impact / Related Factors
- 2.7.6. Market Access
- 2.7.7. Healthcare Policies
- 2.7.8. Industry Consolidation
3. ECONOMIC AND OTHER PROJECT SPECIFIC CONSIDERATIONS
- 3.1. Chapter Overview
- 3.2. Market Dynamics
- 3.2.1. Time Period
- 3.2.1.1. Historical Trends
- 3.2.1.2. Current and Forecasted Estimates
- 3.2.2. Currency Coverage
- 3.2.2.1. Overview of Major Currencies Affecting the Market
- 3.2.2.2. Impact of Currency Fluctuations on the Industry
- 3.2.3. Foreign Exchange Impact
- 3.2.3.1. Evaluation of Foreign Exchange Rates and Their Impact on Market
- 3.2.3.2. Strategies for Mitigating Foreign Exchange Risk
- 3.2.4. Recession
- 3.2.4.1. Historical Analysis of Past Recessions and Lessons Learnt
- 3.2.4.2. Assessment of Current Economic Conditions and Potential Impact on the Market
- 3.2.5. Inflation
- 3.2.5.1. Measurement and Analysis of Inflationary Pressures in the Economy
- 3.2.5.2. Potential Impact of Inflation on the Market Evolution
- 3.2.1. Time Period
4. EXECUTIVE SUMMARY
5. INTRODUCTION
- 5.1. Chapter Overview
- 5.2. Precision Medicine
- 5.2.1. Evolution of Precision Medicine
- 5.3. Oncology Precision Medicine
- 5.3.1. Oncology Precision Medicine over Traditional Cancer Medicine
- 5.3.2. Steps Involved in Developing Oncology Precision Medicine
- 5.3.3. Advantages Associated with Oncology Precision Medicine
- 5.3.3.1. Benefits to the Patients
- 5.3.3.2. Benefits to the Healthcare Providers
- 5.3.3.3. Benefits to the Cancer Researchers
- 5.3.4. Challenges Associated with Oncology Precision Medicines
- 5.3.5. Future Perspectives
6. ONCOLOGY PRECISION MEDICINE: MARKET LANDSCAPE
- 6.1. Chapter Overview
- 6.2. Oncology Precision Medicine: Commercialized and Clinical Stage Drugs Market Landscape
- 6.2.1. Analysis by Stage of Development
- 6.2.2. Analysis by Approval Body
- 6.2.3. Analysis by Approval Region
- 6.2.4. Analysis by Drug Designation
- 6.2.5. Analysis by Type of Molecule
- 6.2.6. Analysis by Drug Class
- 6.2.7. Analysis by Route of Administration
- 6.2.8. Analysis by Dosage Regimen
- 6.2.9. Analysis by Patient Population
- 6.2.10. Analysis by Type of Cancer Targeted
- 6.2.11. Analysis by Stage of Development and Type of Cancer Targeted
- 6.3. Oncology Precision Medicine: Preclinical and Discovery Stage Drugs Market Landscape
- 6.3.1. Analysis by Stage of Development
- 6.3.2. Analysis by Type of Molecule
- 6.3.3. Analysis by Drug Class
- 6.3.4. Analysis by Type of Cancer Targeted
- 6.4. Oncology Precision Medicine: Developer Landscape
- 6.4.1. Analysis by Year of Establishment
- 6.4.2. Analysis by Company Size
- 6.4.3. Analysis by Location of Headquarters (Region)
- 6.4.4. Analysis by Location of Headquarters (Country)
- 6.4.5. Analysis by Company Size and Location of Headquarters (Region)
- 6.4.6. Most Active Players: Analysis by Number of Oncology Precision Medicines
7. DETAILED COMPANY PROFILES
- 7.1. Chapter Overview
- 7.2. AstraZeneca
- 7.2.1. Company Overview
- 7.2.2. Financial Information
- 7.2.3. Oncology Precision Medicine Portfolio
- 7.2.4. Recent Developments and Future Outlook
- 7.3. Genentech
- 7.3.1. Company Overview
- 7.3.2. Financial Information
- 7.3.3. Oncology Precision Medicine Portfolio
- 7.3.4. Recent Developments and Future Outlook
- 7.4. Jiangsu Hengrui Pharmaceuticals
- 7.4.1. Company Overview
- 7.4.2. Oncology Precision Medicine Portfolio
- 7.4.3. Recent Developments and Future Outlook
- 7.5. Johnson & Johnson Innovative Medicine
- 7.5.1. Company Overview
- 7.5.2. Financial Information
- 7.5.3. Oncology Precision Medicine Portfolio
- 7.5.4. Recent Developments and Future Outlook
- 7.6. Novartis
- 7.6.1. Company Overview
- 7.6.2. Financial Information
- 7.6.3. Oncology Precision Medicine Portfolio
- 7.6.4. Recent Developments and Future Outlook
- 7.7. Pfizer
- 7.7.1. Company Overview
- 7.7.2. Financial Information
- 7.7.3. Oncology Precision Medicine Portfolio
- 7.7.4. Recent Developments and Future Outlook
- 7.8. SpringWorks Therapeutics
- 7.8.1. Company Overview
- 7.8.2. Oncology Precision Medicine Portfolio
- 7.8.3. Recent Developments and Future Outlook
8. SHORT COMPANY PROFILES
- 8.1. Chapter Overview
- 8.2. AbbVie
- 8.3. Anticancer Bioscience
- 8.4. Astellas Pharma
- 8.5. Bayer
- 8.6. Blueprint Medicines
- 8.7. Bristol Myers Squibb
- 8.8. Eli Lilly
- 8.9. Erasca
- 8.10. GlaxoSmithKline
- 8.11. Hutchmed
- 8.12. IDEAYA Biosciences
- 8.13. Merck
- 8.14. Repare Therapeutics
- 8.15. Roche
- 8.16. Seagen
- 8.17. Takeda Pharmaceutical
- 8.18. VERAXA Biotech
- 8.19. VRise Therapeutics
9. PARTNERSHIPS AND COLLABORATIONS
- 9.1. Chapter Overview
- 9.2. Partnership Models
- 9.3. Oncology Precision Medicine: Partnerships and Collaborations
- 9.3.1. Analysis by Year of Partnership
- 9.3.2. Analysis by Type of Partnership
- 9.3.3. Analysis by Year and Type of Partnership
- 9.3.4. Analysis by Type of Partner
- 9.3.5. Analysis by Drug Involved
- 9.3.6. Analysis by Type of Cancer Targeted
- 9.3.7. Most Active Players: Analysis by Number of Partnerships
- 9.3.8. Analysis by Geography
- 9.3.8.1. Local and International Agreements
- 9.3.8.2. Intracontinental and Intercontinental Agreements
10. CLINICAL TRIAL ANALYSIS
- 10.1. Chapter Overview
- 10.2. Scope and Methodology
- 10.3. Oncology Precision Medicine: Clinical Trial Analysis
- 10.3.1. Analysis by Trial Registration Year
- 10.3.2. Analysis of Number of Patients Enrolled by Trial Registration Year
- 10.3.3. Analysis by Trial Phase
- 10.3.4. Analysis of Number of Patients Enrolled by Trial Phase
- 10.3.5. Analysis by Trial Registration Year and Trial Phase
- 10.3.6. Analysis by Trial Status
- 10.3.7. Analysis by Trial Registration Year and Trial Status
- 10.3.8. Analysis by Target Patient Population
- 10.3.9. Analysis by Patient Gender
- 10.3.10. Analysis by Type of Cancer Targeted
- 10.3.11. Analysis by Type of Sponsor / Collaborator
- 10.3.12. Analysis by Study Design
- 10.3.12.1. Analysis by Type of Trial Masking
- 10.3.12.2. Analysis by Type of Intervention Model
- 10.3.12.3. Analysis by Type of Intervention
- 10.3.12.4. Analysis by Trial Purpose
- 10.3.13. Most Active Sponsors / Collaborators: Analysis by Number of Clinical Trials
- 10.3.13.1. Analysis by Leading Industry Players
- 10.3.13.2. Analysis by Leading Non-Industry Players
- 10.3.14. Word Cloud Analysis: Emerging Focus Areas
- 10.3.15. Analysis by Geography
- 10.3.15.1. Analysis of Clinical Trials by Geography
- 10.3.15.2. Analysis of Clinical Trials by Geography and Trial Status
- 10.3.15.3. Analysis of Patients Enrolled by Geography and Trial Status
11. CASE STUDY: ONCOLOGY PRECISION MEDICINE ASSAY KITS
- 11.1. Chapter Overview
- 11.2. Oncology Precision Medicine: Assay Kits
- 11.2.1. Analysis by Stage of Development
- 11.2.2. Analysis by Regulatory Certification / Compliance
- 11.2.3. Analysis by Regional Availability
- 11.2.4. Analysis by Type of Test
- 11.2.5. Analysis by Type of Sample Used
- 11.2.6. Analysis by Principle of Biomarker Detection
- 11.2.7. Analysis by Turnaround Time
- 11.2.8. Analysis by Type of Cancer Targeted
- 11.2.9. Analysis by Turnaround Time and Type of Cancer Targeted
- 11.2.10. Analysis by End-user
- 11.2.11. Analysis by Regional Availability and End-user
- 11.2.12. Analysis by Type of Cancer Targeted and End-user
- 11.3. Oncology Precision Medicine Assay Kits: Developer Landscape
- 11.3.1. Analysis by Year of Establishment
- 11.3.2. Analysis by Company Size
- 11.3.3. Analysis by Location of Headquarters (Region)
- 11.3.4. Analysis by Location of Headquarters (Country)
- 11.3.5. Analysis by Company Size and Location of Headquarters (Region)
- 11.3.6. Analysis by Business Model
- 11.3.7. Most Active Players: Analysis by Number of Oncology Precision Medicine Assay Kits
12. CASE STUDY: TECHNOLOGIES USED IN PRECISION MEDICINE
- 12.1. Chapter Overview
- 12.2. Technologies Used in Precision Medicine
- 12.2.1. Next Generation Sequencing in Precision Medicine
- 12.2.2. Nanotechnology in Precision Medicine
- 12.2.3. Molecular Imaging Technologies in Precision Medicine
- 12.2.4. Omics Technologies in Precision Medicine
- 12.2.5. Artificial Intelligence (AI) in Precision Medicine
- 12.3. Conclusion
13. MARKET IMPACT ANALYSIS: DRIVERS, RESTRAINTS, OPPORTUNITIES AND CHALLENGES
- 13.1. Chapter Overview
- 13.2. Market Drivers
- 13.3. Market Restraints
- 13.4. Market Opportunities
- 13.5. Market Challenges
- 13.6. Conclusion
14. GLOBAL ONCOLOGY PRECISION MEDICINE MARKET
- 14.1. Chapter Overview
- 14.2. Assumptions and Methodology
- 14.3. Global Oncology Precision Medicine Market, Historical Trends (since 2018) and Forecasted Estimates (till 2035)
- 14.4. Scenario Analysis
- 14.4.1. Conservative Scenario
- 14.4.2. Optimistic Scenario
- 14.5. Key Market Segmentations
15. ONCOLOGY PRECISION MEDICINE MARKET, BY TYPE OF CANCER TARGETED
- 15.1. Chapter Overview
- 15.2. Key Assumptions and Methodology
- 15.3. Oncology Precision Medicine Market: Distribution by Type of Cancer Targeted, 2023, 2028 and 2035
- 15.3.1. Bladder Cancer: Forecasted Estimates (till 2035)
- 15.3.2. Blood / Hematologic Cancer: Forecasted Estimates (till 2035)
- 15.3.3. Breast Cancer: Forecasted Estimates (till 2035)
- 15.3.4. Cervical Cancer: Forecasted Estimates (till 2035)
- 15.3.5. Gastrointestinal Cancer: Forecasted Estimates (till 2035)
- 15.3.6. Head and Neck Squamous Cell Cancer: Forecasted Estimates (till 2035)
- 15.3.7. Lung Cancer: Forecasted Estimates (till 2035)
- 15.3.8. Skin Cancer: Forecasted Estimates (till 2035)
- 15.3.9. Other Cancers: Forecasted Estimates (till 2035)
- 15.4. Data Triangulation and Validation
16. ONCOLOGY PRECISION MEDICINE MARKET, BY ROUTE OF ADMINISTRATION
- 16.1. Chapter Overview
- 16.2. Key Assumptions and Methodology
- 16.3. Oncology Precision Medicine Market: Distribution by Route of Administration, 2023, 2028 and 2035
- 16.3.1. Oral: Forecasted Estimates (till 2035)
- 16.3.2. Intravenous: Forecasted Estimates (till 2035)
- 16.3.3. Others: Forecasted Estimates (till 2035)
- 16.4. Data Triangulation and Validation
17. ONCOLOGY PRECISION MEDICINE MARKET, BY TYPE OF MOLECULE
- 17.1. Chapter Overview
- 17.2. Key Assumptions and Methodology
- 17.3. Oncology Precision Medicine Market: Distribution by Type of Molecule, 2023, 2028 and 2035
- 17.3.1. Small Molecules: Forecasted Estimates (till 2035)
- 17.3.2. Biologics: Forecasted Estimates (till 2035)
- 17.4. Data Triangulation and Validation
18. ONCOLOGY PRECISION MEDICINE MARKET, BY DRUG CLASS
- 18.1. Chapter Overview
- 18.2. Key Assumptions and Methodology
- 18.3. Oncology Precision Medicine Market: Distribution by Drug Class, 2023, 2028 and 2035
- 18.3.1. Kinase Inhibitors: Forecasted Estimates (till 2035)
- 18.3.2. Enzyme Inhibitors: Forecasted Estimates (till 2035)
- 18.3.3. Immune Checkpoint Inhibitors: Forecasted Estimates (till 2035)
- 18.3.4. Others: Forecasted Estimates (till 2035)
- 18.4. Data Triangulation and Validation
19. ONCOLOGY PRECISION MEDICINE MARKET, BY KEY GEOGRAPHICAL REGIONS
- 19.1. Chapter Overview
- 19.2. Key Assumptions and Methodology
- 19.3. Oncology Precision Medicine Market: Distribution by Key Geographical Regions, 2023, 2028 and 2035
- 19.3.1. North America: Forecasted Estimates (till 2035)
- 19.3.1.1. US: Forecasted Estimates (till 2035)
- 19.3.1.2. Canada: Forecasted Estimates (till 2035)
- 19.3.2. Europe: Forecasted Estimates (till 2035)
- 19.3.2.1. France: Forecasted Estimates (till 2035)
- 19.3.2.2. Germany: Forecasted Estimates (till 2035)
- 19.3.2.3. Italy: Forecasted Estimates (till 2035)
- 19.3.2.4. Spain: Forecasted Estimates (till 2035)
- 19.3.2.5. UK: Forecasted Estimates (till 2035)
- 19.3.3. Asia: Forecasted Estimates (till 2035)
- 19.3.3.1. China: Forecasted Estimates (till 2035)
- 19.3.3.2. Japan: Forecasted Estimates (till 2035)
- 19.3.3.3. Korea: Forecasted Estimates (till 2035)
- 19.3.3.4. India: Forecasted Estimates (till 2035)
- 19.3.4. Middle East and North Africa: Forecasted Estimates (till 2035)
- 19.3.4.1. UAE: Forecasted Estimates (till 2035)
- 19.3.4.2. Israel: Forecasted Estimates (till 2035)
- 19.3.4.3. Qatar: Forecasted Estimates (till 2035)
- 19.3.4.4. Rest of Middle east and North Africa: Forecasted Estimates (till 2035)
- 19.3.5. Latin America: Forecasted Estimates (till 2035)
- 19.3.5.1. Brazil: Forecasted Estimates (till 2035)
- 19.3.5.2. Argentina: Forecasted Estimates (till 2035)
- 19.3.5.3. Chile: Forecasted Estimates (till 2035)
- 19.3.5.4. Rest of Latin America: Forecasted Estimates (till 2035)
- 19.3.1. North America: Forecasted Estimates (till 2035)
- 19.4. Data Triangulation and Validation
20. ONCOLOGY PRECISION MEDICINE MARKET, SALES FORECAST OF DRUGS
- 20.1. Chapter Overview
- 20.2. Key Assumptions and Methodology
- 20.3. Blockbuster Commercialzied Oncology Precision Medicine Market: Sales Forecast
- 20.3.1. ADCETRIS(R) Sales Forecast
- 20.3.2. Alecensa(R) Sales Forecast
- 20.3.3. ALUNBRIG(R) Sales Forecast
- 20.3.4. Avastin(R) Sales Forecast
- 20.3.5. Ayvakit(R) Sales Forecast
- 20.3.6. Braftovi(R)+ Mektovi(R) Sales Forecast
- 20.3.7. BRUKINSA(R) Sales Forecast
- 20.3.8. CALQUENCE(R) Sales Forecast
- 20.3.9. DARZALEX(R) Sales Forecast
- 20.3.10. Elunate(R) Sales Forecast
- 20.3.11. Empliciti(R) Sales Forecast
- 20.3.12. Enhertu(R) Sales Forecast
- 20.3.13. IBRANCE(R) Sales Forecast
- 20.3.14. ICLUSIG(R) Sales Forecast
- 20.3.15. IMBRUVICA(R) Sales Forecast
- 20.3.16. IMFINZI(R) Sales Forecast
- 20.3.17. INLYTA(R) Sales Forecast
- 20.3.18. Keytruda(R) Sales Forecast
- 20.3.19. Kadcyla(R) Sales Forecast
- 20.3.20. LENVIMA(R) / KISPLYX(R) Sales Forecast
- 20.3.21. Lumakras(R) / Lumykras(R) Sales Forecast
- 20.3.22. Mekinist(R) Sales Forecast
- 20.3.23. NERLYNX(R) Sales Forecast
- 20.3.24. NINLARO(R) Sales Forecast
- 20.3.25. Opdivo(R) Sales Forecast
- 20.3.26. Padcev(R) Sales Forecast
- 20.3.27. Piqray(R) Sales Forecast
- 20.3.28. Sprycel(R) Sales Forecast
- 20.3.29. Tabrecta(R) Sales Forecast
- 20.3.30. Tagrisso(R) Sales Forecast
- 20.3.31. Tasigna(R) Sales Forecast
- 20.3.32. Tecentriq(R) Sales Forecast
- 20.3.33. VENCLEXTA(R) Sales Forecast
- 20.3.34. Verzenio(R) / Verzenios Sales Forecast
- 20.3.35. Xospata(R) Sales Forecast
- 20.3.36. Xtandi(R) Sales Forecast
- 20.3.37. ZEJULA(R) Sales Forecast
- 20.4. NDA-filed Oncology Precision Medicine Market: Sales Forecast
- 20.4.1. Apatinib / Rivoceranib Sales Forecast
- 20.4.2. Elunate(R) Sales Forecast
- 20.5. Phase III Oncology Precision Medicine Market: Sales Forecast
- 20.5.1. Darovasertib / IDE196 Sales Forecast
- 20.5.1.1. Darovasertib / IDE196 Regional Sales Forecast
- 20.5.2. Elenestinib / BLU-263 Sales Forecast
- 20.5.2.1. Elenestinib / BLU-263 Regional Sales Forecast
- 20.5.3. Elunate(R) Sales Forecast
- 20.5.3.1. Elunate(R) Sales Forecast by Type of Cancer Targeted
- 20.5.3.2. Elunate(R) Regional Sales Forecast
- 20.5.4. ORPATHYS(R) Sales Forecast
- 20.5.4.1. ORPATHYS(R) Regional Sales Forecast
- 20.5.5. Pyrotinib Sales Forecast
- 20.5.5.1. Pyrotinib Sales Forecast by Type of Cancer Targeted
- 20.5.5.2. Pyrotinib Regional Sales Forecast
- 20.5.6. SYD985 / (Vic-) trastuzumab duocarmazine) Sales Forecast
- 20.5.6.1. SYD985 / (Vic-) trastuzumab duocarmazine) Regional Sales Forecast
- 20.5.7. ZOLINZA(R) Sales Forecast
- 20.5.7.1. ZOLINZA(R) Regional Sales Forecast
- 20.5.1. Darovasertib / IDE196 Sales Forecast
21. ONCOLOGY PRECISION MEDICINE MARKET, BY LEADING DRUG DEVELOPERS
- 21.1. Chapter Overview
- 21.2. Key Assumptions and Methodology
- 21.3. Oncology Precision Medicine Market: Distribution by Leading Drug Developers
- 21.4. Data Triangulation and Validattion
22. CONCLUSION
23. EXECUTIVE INSIGHTS
- 23.1. Chapter Overview
- 23.2. Company A
- 23.2.1. Company Snapshot
- 23.2.2. Interview Transcript
- 23.3. Company B
- 23.3.1. Company Snapshot
- 23.3.2. Interview Transcript
24. APPENDIX 1: TABULATED DATA
25. APPENDIX 2: LIST OF COMPANIES AND ORGANIZATIONS
List of Tables
- Table 6.1 Commercialized and Clinical Stage Oncology Precision Medicine: Information on Developer, Brand, Stage of Development, Approval Body and Approval Region
- Table 6.2 Commercialized and Clinical Stage Oncology Precision Medicine: Information on Drug Designation
- Table 6.3 Commercialized and Clinical Stage Oncology Precision Medicine: Information on Type of Molecule, Drug Class, Route of Administration, Dosage Regimen and Patient Population
- Table 6.4 Commercialized and Clinical Stage Oncology Precision Medicine: Information on Type of Cancer Targeted
- Table 6.5 Preclinical and Discovery Stage Oncology Precision Medicine: Information on Developer and Stage of Development
- Table 6.6 Preclinical and Discovery Stage Oncology Precision Medicine: Information on Type of Molecule and Drug Class
- Table 6.7 Preclinical and Discovery Stage Oncology Precision Medicine: Information on Type of Cancer Targeted
- Table 6.8 Oncology Precision Medicine: List of Developers
- Table 7.1 Oncology Precision Medicine: List of Companies Profiled
- Table 7.2 AstraZeneca: Company Snapshot
- Table 7.3 AstraZeneca: Oncology Precision Medicine Portfolio
- Table 7.4 AstraZeneca: Recent Developments and Future Outlook
- Table 7.5 Genentech: Company Snapshot
- Table 7.6 Genentech: Oncology Precision Medicine Portfolio
- Table 7.7 Jiangsu Hengrui Pharmaceuticals: Company Snapshot
- Table 7.8 Jiangsu Hengrui Pharmaceuticals: Oncology Precision Medicine Portfolio
- Table 7.9 Johnson & Johnson Innovative Medicine: Company Snapshot
- Table 7.10 Johnson & Johnson Innovative Medicine: Oncology Precision Medicine Portfolio
- Table 7.11 Johnson & Johnson Innovative Medicine: Recent Developments and Future Outlook
- Table 7.12 Novartis: Company Snapshot
- Table 7.13 Novartis: Oncology Precision Medicine Portfolio
- Table 7.14 Novartis: Recent Developments and Future Outlook
- Table 7.15 Pfizer: Company Snapshot
- Table 7.16 Pfizer: Oncology Precision Medicine Portfolio
- Table 7.17 Pfizer: Recent Developments and Future Outlook
- Table 7.18 SpringWorks Therapeutics: Company Snapshot
- Table 7.19 SpringWorks Therapeutics: Oncology Precision Medicine Portfolio
- Table 7.20 SpringWorks Therapeutics: Recent Developments and Future Outlook
- Table 8.1 Oncology Precision Medicine: List of Companies Profiled
- Table 8.2 Company Profile: AbbVie
- Table 8.3 Company Profile: Anticancer Biosciences
- Table 8.4 Company Profile: Astellas Pharma
- Table 8.5 Company Profile: Bayer
- Table 8.6 Company Profile: Blueprint Medicines
- Table 8.7 Company Profile: Bristol Myers Squibb
- Table 8.8 Company Profile: Eli Lilly
- Table 8.9 Company Profile: Erasca
- Table 8.10 Company Profile: GlaxoSmithKline
- Table 8.11 Company Profile: Hutchmed
- Table 8.12 Company Profile: IDEAYA Biosciences
- Table 8.13 Company Profile: Merck
- Table 8.14 Company Profile: Repare Therapeutics
- Table 8.15 Company Profile: Roche
- Table 8.16 Company Profile: Seagen
- Table 8.17 Company Profile: Takeda Pharmaceutical
- Table 8.18 Company Profile: VERAXA Biotech GmbH
- Table 8.19 Company Profile: VRise Therapeutics
- Table 9.1 Oncology Precision Medicine: List of Partnerships and Collaborations, since 2018
- Table 9.2 Partnerships and Collaborations: Information on Drug Involved and Type of Cancer Targeted
- Table 9.3 Partnerships and Collaborations: Information on Location of Headquarters (Country and Region) and Type of Agreement (Country and Region)
- Table 11.1 Oncology Precision Medicine Assay Kits: Information on Developer, Stage of Development, Regulatory Certification / Compliance and Regional Availability
- Table 11.2 Oncology Precision Medicine Assay Kits: Information on Type of Test, Type of Sample, Principle of Biomarker Detection and Turn-around Time
- Table 11.3 Oncology Precision Medicine Assay Kits: Information on Type of Cancer Targeted
- Table 11.4 Oncology Precision Medicine Assay Kits: Information on End-user
- Table 11.5 List of Oncology Precision Medicine Assay Kit Developers
- Table 21.1 List of Leading Oncology Precision Medicine Developers
- Table 23.1 Allarity Therapeutics: Company Snapshot
- Table 23.2 Elephas: Company Snapshot
- Table 24.1 Commercialized and Clinical Stage Oncology Precision Medicine: Distribution by Stage of Development
- Table 24.2 Commercialized and Clinical Stage Oncology Precision Medicine: Distribution by Approval Body
- Table 24.3 Commercialized and Clinical Stage Oncology Precision Medicine: Distribution by Approval Region
- Table 24.4 Commercialized and Clinical Stage Oncology Precision Medicine: Distribution by Drug Designation
- Table 24.5 Commercialized and Clinical Stage Oncology Precision Medicine: Distribution by Type of Molecule
- Table 24.6 Commercialized and Clinical Stage Oncology Precision Medicine: Distribution by Drug Class
- Table 24.7 Commercialized and Clinical Stage Oncology Precision Medicine: Distribution by Route of Administration
- Table 24.8 Commercialized and Clinical Stage Oncology Precision Medicine: Distribution by Dosage Regimen
- Table 24.9 Commercialized and Clinical Stage Oncology Precision Medicine: Distribution by Patient Population
- Table 24.10 Commercialized and Clinical Stage Oncology Precision Medicine: Distribution by Type of Cancer Targeted
- Table 24.11 Commercialized and Clinical Stage Oncology Precision Medicine: Distribution by Stage of Development and Type of Cancer Targeted
- Table 24.12 Preclinical and Discovery Stage Oncology Precision Medicine: Distribution by Stage of Development
- Table 24.13 Preclinical and Discovery Stage Oncology Precision Medicine: Distribution by Type of Molecule
- Table 24.14 Preclinical and Discovery Stage Oncology Precision Medicine: Distribution by Drug Class
- Table 24.15 Preclinical and Discovery Stage Oncology Precision Medicine: Distribution by Type of Cancer Targeted
- Table 24.16 Oncology Precision Medicine: Distribution of Drug Developers by Year of Establishment
- Table 24.17 Oncology Precision Medicine: Distribution of Drug Developers by Company Size
- Table 24.18 Oncology Precision Medicine: Distribution of Drug Developers by Location of Headquarters (Region)
- Table 24.19 Oncology Precision Medicine: Distribution of Drug Developers by Location of Headquarters (Country)
- Table 24.20 Oncology Precision Medicine: Distribution of Drug Developers by Company Size and Location of Headquarters (Region)
- Table 24.21 Most Active Developers: Distribution by Number of Oncology Precision Medicines
- Table 24.22 AstraZeneca: Annual Revenues, FY 2018 Onwards (USD Billion)
- Table 24.23 Roche (Parent Company of Genentech): Annual Revenues, FY 2018 Onwards (USD Billion)
- Table 24.24 Johnson & Johnson (Parent Company of Johnson & Johnson Innovative Medicine): Annual Revenues, FY 2018 Onwards (USD Billion)
- Table 24.25 Novartis: Annual Revenues, FY 2018 Onwards (USD Billion)
- Table 24.26 Pfizer: Annual Revenues, FY 2018 Onwards (USD Billion)
- Table 24.27 Partnerships and Collaborations: Cumulative Year-wise Trend, since 2018
- Table 24.28 Partnerships and Collaborations: Distribution by Type of Partnership
- Table 24.29 Partnerships and Collaborations: Distribution by Year and Type of Partnership, since 2018
- Table 24.30 Partnerships and Collaborations: Distribution by Type of Partner
- Table 24.31 Partnerships and Collaborations: Distribution by Drug Involved
- Table 24.32 Partnerships and Collaborations: Distribution by Type of Cancer Targeted
- Table 24.33 Most Active Players: Distribution by Number of Partnerships
- Table 24.34 Partnership and Collaborations: Local and International Agreements
- Table 24.35 Partnerships and Collaborations: Intracontinental and Intercontinental Agreements
- Table 24.36 Clinical Trial Analysis: Cumulative Year-wise Trend, since 2018
- Table 24.37 Clinical Trial Analysis: Distribution of Number of Patients Enrolled by Trial Registration Year, since 2018
- Table 24.38 Clinical Trial Analysis: Distribution by Trial Phase
- Table 24.39 Clinical Trial Analysis: Distribution of Number of Patients Enrolled by Trial Phase
- Table 24.40 Clinical Trial Analysis: Distribution by Trial Registration Year and Trial Phase, since 2018
- Table 24.41 Clinical Trial Analysis: Distribution by Trial Status
- Table 24.42 Clinical Trial Analysis: Distribution by Trial Registration Year and Trial Status, since 2018
- Table 24.43 Clinical Trial Analysis: Distribution by Target Patient Population
- Table 24.44 Clinical Trial Analysis: Distribution by Patient Gender
- Table 24.45 Clinical Trial Analysis: Distribution by Type of Cancer Targeted
- Table 24.46 Clinical Trial Analysis: Distribution by Type of Sponsor / Collaborator
- Table 24.47 Clinical Trial Analysis: Distribution by Type of Trial Masking
- Table 24.48 Clinical Trial Analysis: Distribution by Type of Intervention Model
- Table 24.49 Clinical Trial Analysis: Distribution by Type of Intervention
- Table 24.50 Clinical Trial Analysis: Distribution by Trial Purpose
- Table 24.51 Leading Industry Players: Distribution by Number of Clinical Trials
- Table 24.52 Leading Non-Industry Players: Distribution by Number of Clinical Trials
- Table 24.53 Clinical Trial Analysis: Distribution of Clinical Trials by Geography
- Table 24.54 Clinical Trial Analysis: Distribution of Clinical Trials by Geography and Trial Status
- Table 24.55 Clinical Trial Analysis: Distribution of Patients Enrolled by Geography and Trial Status
- Table 24.56 Oncology Precision Medicine Assay Kits: Distribution by Stage of Development
- Table 24.57 Oncology Precision Medicine Assay Kits: Distribution by Regulatory Certification / Compliance
- Table 24.58 Oncology Precision Medicine Assay Kits: Distribution by Regional Availability
- Table 24.59 Oncology Precision Medicine Assay Kits: Distribution by Type of Test
- Table 24.60 Oncology Precision Medicine Assay Kits: Distribution by Type of Sample Used
- Table 24.61 Oncology Precision Medicine Assay Kits: Distribution by Principle of Biomarker Detection
- Table 24.62 Oncology Precision Medicine Assay Kits: Distribution by Turnaround Time
- Table 24.63 Oncology Precision Medicine Assay Kits: Distribution by Type of Cancer Targeted
- Table 24.64 Oncology Precision Medicine Assay Kits: Distribution by Turnaround Time and Type of Cancer Targeted
- Table 24.65 Oncology Precision Medicine Assay Kits: Distribution by End-user
- Table 24.66 Oncology Precision Medicine Assay Kits: Distribution by Regional Availability and End-user
- Table 24.67 Oncology Precision Medicine Assay Kits: Distribution by Type of Cancer Targeted and End-user
- Table 24.68 Oncology Precision Medicine Assay Kit Developers: Distribution by Year of Establishment
- Table 24.69 Oncology Precision Medicine Assay Kit Developers: Distribution by Company Size
- Table 24.70 Oncology Precision Medicine Assay Kit Developers: Distribution by Location of Headquarters (Region)
- Table 24.71 Oncology Precision Medicine Assay Kit Developers: Distribution by Location of Headquarters (Country)
- Table 24.72 Oncology Precision Medicine Assay Kit Developers: Distribution by Company Size and Location of Headquarters (Region)
- Table 24.73 Oncology Precision Medicine Assay Kit Developers: Distribution by Business Model
- Table 24.74 Most Active Developers: Distribution by Number of Oncology Precision Medicine Assay Kits Developed
- Table 24.75 Global Oncology Precision Medicine Market, Historical Trends (since 2018) and Forecasted Estimates (till 2035) (USD Billion)
- Table 24.76 Global Oncology Precision Medicine Market, till 2035: Conservative Scenario (USD Billion)
- Table 24.77 Global Oncology Precision Medicine Market, till 2035: Optimistic Scenario (USD Billion)
- Table 24.78 Oncology Precision Medicine Market: Distribution by Type of Cancer Targeted, 2023, 2028 and 2035
- Table 24.79 Oncology Precision Medicine Market for Bladder Cancer, Conservative, Base and Optimistic Scenarios, till 2035 (USD Billion)
- Table 24.80 Oncology Precision Medicine Market for Blood / Hematologic Cancer, Conservative, Base and Optimistic Scenarios, till 2035 (USD Billion)
- Table 24.81 Oncology Precision Medicine Market for Breast Cancer, Conservative, Base and Optimistic Scenarios, till 2035 (USD Billion)
- Table 24.82 Oncology Precision Medicine Market for Cervical Cancer, Conservative, Base and Optimistic Scenarios, till 2035 (USD Billion)
- Table 24.83 Oncology Precision Medicine Market for Gastrointestinal Cancer, Conservative, Base and Optimistic Scenarios, till 2035 (USD Billion)
- Table 24.84 Oncology Precision Medicine Market for Head and Neck Squamous Cell Cancer, Conservative, Base and Optimistic Scenarios, till 2035 (USD Billion)
- Table 24.85 Oncology Precision Medicine Market for Lung Cancer, Conservative, Base and Optimistic Scenarios, till 2035 (USD Billion)
- Table 24.86 Oncology Precision Medicine Market for Skin Cancer, Conservative, Base and Optimistic Scenarios, till 2035 (USD Billion)
- Table 24.87 Oncology Precision Medicine Market for Other Cancers, Conservative, Base and Optimistic Scenarios, till 2035 (USD Billion)
- Table 24.88 Oncology Precision Medicine Market: Distribution by Route of Administration, 2023, 2028 and 2035
- Table 24.89 Oncology Precision Medicine Market for Oral, Conservative, Base and Optimistic Scenarios, till 2035 (USD Billion)
- Table 24.90 Oncology Precision Medicine Market for Intravenous, Conservative, Base and Optimistic Scenarios, till 2035 (USD Billion)
- Table 24.91 Oncology Precision Medicine Market for Others, Conservative, Base and Optimistic Scenarios, till 2035 (USD Billion)
- Table 24.92 Oncology Precision Medicine Market: Distribution by Type of Molecule, 2023, 2028 and 2035
- Table 24.93 Oncology Precision Medicine Market for Small Molecules, Conservative, Base and Optimistic Scenarios, till 2035 (USD Billion)
- Table 24.94 Oncology Precision Medicine Market for Biologics, Conservative, Base and Optimistic Scenarios, till 2035, (USD Billion)
- Table 24.95 Oncology Precision Medicine Market: Distribution by Drug Class, 2023, 2028 and 2035
- Table 24.96 Oncology Precision Medicine Market for Kinase Inhibitors, Conservative, Base and Optimistic Scenarios, till 2035 (USD Billion)
- Table 24.97 Oncology Precision Medicine Market for Enzyme Inhibitors, Conservative, Base and Optimistic Scenarios, till 2035 (USD Billion)
- Table 24.98 Oncology Precision Medicine Market for Immune Checkpoint Inhibitors, Conservative, Base and Optimistic Scenarios, till 2035 (USD Billion)
- Table 24.99 Oncology Precision Medicine Market for Others, Conservative, Base and Optimistic Scenarios, till 2035 (USD Billion)
- Table 24.100 Oncology Precision Medicine Market: Distribution by Key Geographical Regions, 2023, 2028 and 2035
- Table 24.101 Oncology Precision Medicine Market in North America, Conservative, Base and Optimistic Scenarios, till 2035 (USD Billion)
- Table 24.102 Oncology Precision Medicine Market in the US, Conservative, Base and Optimistic Scenarios, till 2035 (USD Billion)
- Table 24.103 Oncology Precision Medicine Market in Canada, Conservative, Base and Optimistic Scenarios, till 2035 (USD Billion)
- Table 24.104 Oncology Precision Medicine Market in Europe, Conservative, Base and Optimistic Scenarios, till 2035 (USD Billion)
- Table 24.105 Oncology Precision Medicine Market in France, Conservative, Base and Optimistic Scenarios, till 2035 (USD Billion)
- Table 24.106 Oncology Precision Medicine Market in Germany, Conservative, Base and Optimistic Scenarios, till 2035 (USD Billion)
- Table 24.107 Oncology Precision Medicine Market in Italy, Conservative, Base and Optimistic Scenarios, till 2035 (USD Billion)
- Table 24.108 Oncology Precision Medicine Market in Spain, Conservative, Base and Optimistic Scenarios, till 2035 (USD Billion)
- Table 24.109 Oncology Precision Medicine Market in UK, Conservative, Base and Optimistic Scenarios, till 2035 (USD Billion)
- Table 24.110 Oncology Precision Medicine Market in Asia, Conservative, Base and Optimistic Scenarios, till 2035 (USD Billion)
- Table 24.111 Oncology Precision Medicine Market in China, Conservative, Base and Optimistic Scenarios, till 2035 (USD Billion)
- Table 24.112 Oncology Precision Medicine Market in Japan, Conservative, Base and Optimistic Scenarios, till 2035 (USD Billion)
- Table 24.113 Oncology Precision Medicine Market in Korea, Conservative, Base and Optimistic Scenarios, till 2035 (USD Billion)
- Table 24.114 Oncology Precision Medicine Market in India, Conservative, Base and Optimistic Scenarios, till 2035 (USD Billion)
- Table 24.115 Oncology Precision Medicine Market in Middle East and North Africa, Conservative, Base and Optimistic Scenarios, till 2035 (USD Billion)
- Table 24.116 Oncology Precision Medicine Market in UAE, Conservative, Base and Optimistic Scenarios, till 2035 (USD Billion)
- Table 24.117 Oncology Precision Medicine Market in Israel, Conservative, Base and Optimistic Scenarios, till 2035 (USD Billion)
- Table 24.118 Oncology Precision Medicine Market in Qatar, Conservative, Base and Optimistic Scenarios, till 2035 (USD Billion)
- Table 24.119 Oncology Precision Medicine Market in Rest of Middle East and North Africa, Conservative, Base and Optimistic Scenarios, till 2035 (USD Billion)
- Table 24.120 Oncology Precision Medicine Market in Latin America, Conservative, Base and Optimistic Scenarios, till 2035 (USD Billion)
- Table 24.121 Oncology Precision Medicine Market in Brazil, Conservative, Base and Optimistic Scenarios, till 2035 (USD Billion)
- Table 24.122 Oncology Precision Medicine Market in Argentina, Conservative, Base and Optimistic Scenarios, till 2035 (USD Billion)
- Table 24.123 Oncology Precision Medicine Market in Chile, Conservative, Base and Optimistic Scenarios, till 2035 (USD Billion)
- Table 24.124 Oncology Precision Medicine Market in Rest of Latin America, Conservative, Base and Optimistic Scenarios, till 2035 (USD Billion)
- Table 24.125 Blockbuster Commercialized Oncology Precision Medicine Market: ADCETRIS(R) Sales Forecast, Conservative, Base and Optimistic Scenarios, till 2035 (USD Billion)
- Table 24.126 Blockbuster Commercialized Oncology Precision Medicine Market: Alecensa(R) Sales Forecast, Conservative, Base and Optimistic Scenarios, till 2035 (USD Billion)
- Table 24.127 Blockbuster Commercialized Oncology Precision Medicine Market: ALUNBRIG(R) Sales Forecast, Conservative, Base and Optimistic Scenarios, till 2035 (USD Billion)
- Table 24.128 Blockbuster Commercialized Oncology Precision Medicine Market: Avastin(R) Sales Forecast, Conservative, Base and Optimistic Scenarios, till 2035 (USD Billion)
- Table 24.129 Blockbuster Commercialized Oncology Precision Medicine Market: Ayvakit(R) Sales Forecast, Conservative, Base and Optimistic Scenarios, till 2035 (USD Billion)
- Table 24.130 Blockbuster Commercialized Oncology Precision Medicine Market: Braftovi(R)+ Mektovi(R) Sales Forecast, Conservative, Base and Optimistic Scenarios, till 2035 (USD Billion)
- Table 24.131 Blockbuster Commercialized Oncology Precision Medicine Market: BRUKINSA(R) Sales Forecast, Conservative, Base and Optimistic Scenarios, till 2035 (USD Billion)
- Table 24.132 Blockbuster Commercialized Oncology Precision Medicine Market: CALQUENCE(R) Sales Forecast, Conservative, Base and Optimistic Scenarios, till 2035 (USD Billion)
- Table 24.133 Blockbuster Commercialized Oncology Precision Medicine Market: DARZALEX(R) Sales Forecast, Conservative, Base and Optimistic Scenarios, till 2035 (USD Billion)
- Table 24.134 Blockbuster Commercialized Oncology Precision Medicine Market: Elunate(R) Sales Forecast, Conservative, Base and Optimistic Scenarios, till 2035 (USD Billion)
- Table 24.135 Blockbuster Commercialized Oncology Precision Medicine Market: Empliciti(R) Sales Forecast, Conservative, Base and Optimistic Scenarios, till 2035 (USD Billion)
- Table 24.136 Blockbuster Commercialized Oncology Precision Medicine Market: Enhertu(R) Sales Forecast, Conservative, Base and Optimistic Scenarios, till 2035 (USD Billion)
- Table 24.137 Blockbuster Commercialized Oncology Precision Medicine Market: IBRANCE(R) Sales Forecast, Conservative, Base and Optimistic Scenarios, till 2035 (USD Billion)
- Table 24.138 Blockbuster Commercialized Oncology Precision Medicine Market: ICLUSIG(R) Sales Forecast, Conservative, Base and Optimistic Scenarios, till 2035 (USD Billion)
- Table 24.139 Blockbuster Commercialized Oncology Precision Medicine Market: IMBRUVICA(R) Sales Forecast, Conservative, Base and Optimistic Scenarios, till 2035 (USD Billion)
- Table 24.140 Blockbuster Commercialized Oncology Precision Medicine Market: IMFINZI(R) Sales Forecast, Conservative, Base and Optimistic Scenarios, till 2035 (USD Billion)
- Table 24.141 Blockbuster Commercialized Oncology Precision Medicine Market: INLYTA(R) Sales Forecast, Conservative, Base and Optimistic Scenarios, till 2035 (USD Billion)
- Table 24.142 Blockbuster Commercialized Oncology Precision Medicine Market: Keytruda(R) Sales Forecast, Conservative, Base and Optimistic Scenarios, till 2035 (USD Billion)
- Table 24.143 Blockbuster Commercialized Oncology Precision Medicine Market: Kadcyla(R) Sales Forecast, Conservative, Base and Optimistic Scenarios, till 2035 (USD Billion)
- Table 24.144 Blockbuster Commercialized Oncology Precision Medicine Market: LENVIMA(R) / KISPLYX(R) Sales Forecast, Conservative, Base and Optimistic Scenarios, till 2035 (USD Billion)
- Table 24.145 Blockbuster Commercialized Oncology Precision Medicine Market: Lumakras(R) / Lumykras(R) Sales Forecast, Conservative, Base and Optimistic Scenarios, till 2035 (USD Billion)
- Table 24.146 Blockbuster Commercialized Oncology Precision Medicine Market: Mekinist(R) Sales Forecast, Conservative, Base and Optimistic Scenarios, till 2035 (USD Billion)
- Table 24.147 Blockbuster Commercialized Oncology Precision Medicine Market: NERLYNX(R) Sales Forecast, Conservative, Base and Optimistic Scenarios, till 2035 (USD Billion)
- Table 24.148 Blockbuster Commercialized Oncology Precision Medicine Market: NINLARO(R) Sales Forecast, Conservative, Base and Optimistic Scenarios, till 2035 (USD Billion)
- Table 24.149 Blockbuster Commercialized Oncology Precision Medicine Market: Opdivo(R) Sales Forecast, Conservative, Base and Optimistic Scenarios, till 2035 (USD Billion)
- Table 24.150 Blockbuster Commercialized Oncology Precision Medicine Market: Padcev(R) Sales Forecast, Conservative, Base and Optimistic Scenarios, till 2035 (USD Billion)
- Table 24.151 Blockbuster Commercialized Oncology Precision Medicine Market: Piqray(R) Sales Forecast, Conservative, Base and Optimistic Scenarios, till 2035 (USD Billion)
- Table 24.152 Blockbuster Commercialized Oncology Precision Medicine Market: Sprycel(R) Sales Forecast, Conservative, Base and Optimistic Scenarios, till 2035 (USD Billion)
- Table 24.153 Blockbuster Commercialized Oncology Precision Medicine Market: Tabrecta(R) Sales Forecast, Conservative, Base and Optimistic Scenarios, till 2035 (USD Billion)
- Table 24.154 Blockbuster Commercialized Oncology Precision Medicine Market: Tagrisso(R) Sales Forecast, Conservative, Base and Optimistic Scenarios, till 2035 (USD Billion)
- Table 24.155 Blockbuster Commercialized Oncology Precision Medicine Market: Tasigna(R) Sales Forecast, Conservative, Base and Optimistic Scenarios, till 2035 (USD Billion)
- Table 24.156 Blockbuster Commercialized Oncology Precision Medicine Market: Tecentriq(R) Sales Forecast, Conservative, Base and Optimistic Scenarios, till 2035 (USD Billion)
- Table 24.157 Blockbuster Commercialized Oncology Precision Medicine Market: VENCLEXTA(R) Sales Forecast, Conservative, Base and Optimistic Scenarios, till 2035 (USD Billion)
- Table 24.158 Blockbuster Commercialized Oncology Precision Medicine Market: Verzenio(R) / Verzenios Sales Forecast, Conservative, Base and Optimistic Scenarios, till 2035 (USD Billion)
- Table 24.159 Blockbuster Commercialized Oncology Precision Medicine Market: Xospata(R) Sales Forecast, Conservative, Base and Optimistic Scenarios, till 2035 (USD Billion)
- Table 24.160 Blockbuster Commercialized Oncology Precision Medicine Market: XTANDI(R) Sales Forecast, Conservative, Base and Optimistic Scenarios, till 2035 (USD Billion)
- Table 24.161 Blockbuster Commercialized Oncology Precision Medicine Market: ZEJULA(R) Sales Forecast, Conservative, Base and Optimistic Scenarios, till 2035 (USD Billion)
- Table 24.162 NDA-filed Oncology Precision Medicine Market: Apatinib / Rivoceranib Sales Forecast, Conservative, Base and Optimistic Scenarios, till 2035 (USD Billion)
- Table 24.163 NDA-filed Oncology Precision Medicine Market: Elunate(R) Sales Forecast, Conservative, Base and Optimistic Scenarios, till 2035 (USD Billion)
- Table 24.164 Phase III Oncology Precision Medicine Market: Darovasertib / IDE196 Sales Forecast, Conservative, Base and Optimistic Scenarios, till 2035 (USD Billion)
- Table 24.165 Phase III Oncology Precision Medicine Market: Darovasertib / IDE196 Regional Sales Forecast, Conservative, Base and Optimistic Scenarios, till 2035 (USD Billion)
- Table 24.166 Phase III Oncology Precision Medicine Market: Elenestinib / BLU-263 Sales Forecast, Conservative, Base and Optimistic Scenarios, till 2035 (USD Billion)
- Table 24.167 Phase III Oncology Precision Medicine Market: Elenestinib / BLU-263 Regional Sales Forecast, Conservative, Base and Optimistic Scenarios, till 2035 (USD Billion)
- Table 24.168 Phase III Oncology Precision Medicine Market: Elunate(R) Sales Forecast, Conservative, Base and Optimistic Scenarios, till 2035 (USD Billion)
- Table 24.169 Phase III Oncology Precision Medicine Market: Elunate(R) Sales Forecast by Type of Cancer Targeted, Conservative, Base and Optimistic Scenarios, till 2035 (USD Billion)
- Table 24.170 Phase III Oncology Precision Medicine Market: Elunate(R) Regional Sales Forecast, Conservative, Base and Optimistic Scenarios, till 2035 (USD Billion)
- Table 24.171 Phase III Oncology Precision Medicine Market: ORPATHYS(R) Sales Forecast, Conservative, Base and Optimistic Scenarios, till 2035 (USD Billion)
- Table 24.172 Phase III Oncology Precision Medicine Market: ORPATHYS(R) Regional Sales Forecast, Conservative, Base and Optimistic Scenarios, till 2035 (USD Billion)
- Table 24.173 Phase III Oncology Precision Medicine Market: Pyrotinib Sales Forecast, Conservative, Base and Optimistic Scenarios, till 2035 (USD Billion)
- Table 24.174 Phase III Oncology Precision Medicine Market: Pyrotinib Sales Forecast by Type of Cancer Targeted, Conservative, Base and Optimistic Scenarios, till 2035 (USD Billion)
- Table 24.175 Phase III Oncology Precision Medicine Market: Pyrotinib Regional Sales Forecast, Conservative, Base and Optimistic Scenarios, till 2035 (USD Billion)
- Table 24.176 Phase III Oncology Precision Medicine Market: SYD985 / (Vic-)trastuzumab duocarmazine) Sales Forecast, Conservative, Base and Optimistic Scenarios, till 2035 (USD Billion)
- Table 24.177 Phase III Oncology Precision Medicine Market: SYD985 / (Vic-) trastuzumab duocarmazine) Regional Sales Forecast, Conservative, Base and Optimistic Scenarios, till 2035 (USD Billion)
- Table 24.178 Phase III Oncology Precision Medicine Market: ZOLINZA(R) Sales Forecast, Conservative, Base and Optimistic Scenarios, till 2035 (USD Billion)
- Table 24.179 Phase III Oncology Precision Medicine Market: ZOLINZA(R) Regional Sales Forecast, Conservative, Base and Optimistic Scenarios, till 2035 (USD Billion)
- Table 24.180 Oncology Precision Medicine Market: Distribution by Leading Drug Developers (based on sales of oncology precision medicines (USD Billion)
List of Figures
- Figure 2.1 Research Methodology: Research Assumptions
- Figure 2.2 Research Methodology: Project Methodology
- Figure 2.3 Research Methodology: Forecast Methodology
- Figure 2.4 Research Methodology: Robust Quality Control
- Figure 2.5 Research Methodology: Key Market Segmentations
- Figure 4.1 Executive Summary: Market Landscape
- Figure 4.2 Executive Summary: Partnerships and Collaborations
- Figure 4.3 Executive Summary: Clinical Trial Analysis
- Figure 4.4 Executive Summary: Market Forecast and Opportunity Analysis
- Figure 5.1 Evolution of Precision Medicine
- Figure 5.2 Oncology Precision Medicine over Traditional Cancer Medicine
- Figure 5.3 Steps Involved in Developing Oncology Precision Medicines
- Figure 5.4 Challenges Associated with Oncology Precision Medicines
- Figure 6.1 Commercialized and Clinical Stage Oncology Precision Medicine: Distribution by Stage of Development
- Figure 6.2 Commercialized and Clinical Stage Oncology Precision Medicine: Distribution by Approval Body
- Figure 6.3 Commercialized and Clinical Stage Oncology Precision Medicine: Distribution by Approval Region
- Figure 6.4 Commercialized and Clinical Stage Oncology Precision Medicine: Distribution by Drug Designation
- Figure 6.5 Commercialized and Clinical Stage Oncology Precision Medicine: Distribution by Type of Molecule
- Figure 6.6 Commercialized and Clinical Stage Oncology Precision Medicine: Distribution by Drug Class
- Figure 6.7 Commercialized and Clinical Stage Oncology Precision Medicine: Distribution by Route of Administration
- Figure 6.8 Commercialized and Clinical Stage Oncology Precision Medicine: Distribution by Dosage Regimen
- Figure 6.9 Commercialized and Clinical Stage Oncology Precision Medicine: Distribution by Patient Population
- Figure 6.10 Commercialized and Clinical Stage Oncology Precision Medicine: Distribution by Type of Cancer Targeted
- Figure 6.11 Commercialized and Clinical Stage Oncology Precision Medicine: Distribution by Stage of Development and Type of Cancer Targeted
- Figure 6.12 Preclinical and Discovery Stage Oncology Precision Medicine: Distribution by Stage of Development
- Figure 6.13 Preclinical and Discovery Stage Oncology Precision Medicine: Distribution by Type of Molecule
- Figure 6.14 Preclinical and Discovery Stage Oncology Precision Medicine: Distribution by Drug Class
- Figure 6.15 Preclinical and Discovery Stage Oncology Precision Medicine: Distribution by Type of Cancer Targeted
- Figure 6.16 Oncology Precision Medicine: Distribution of Drug Developers by Year of Establishment
- Figure 6.17 Oncology Precision Medicine: Distribution of Drug Developers by Company Size
- Figure 6.18 Oncology Precision Medicine: Distribution of Drug Developers by Location of Headquarters (Region)
- Figure 6.19 Oncology Precision Medicine: Distribution of Drug Developers by Location of Headquarters (Country)
- Figure 6.20 Oncology Precision Medicine: Distribution of Drug Developers by Company Size and Location of Headquarters (Region)
- Figure 6.21 Most Active Developers: Distribution by Number of Oncology Precision Medicines
- Figure 7.1 AstraZeneca: Annual Revenues, FY 2018 Onwards (USD Billion)
- Figure 7.2 Roche (Parent Company of Genentech): Annual Revenues, FY 2018 Onwards (USD Billion)
- Figure 7.3 Johnson & Johnson (Parent Company of Johnson & Johnson Innovative Medicine): Annual Revenues, FY 2018 Onwards (USD Billion)
- Figure 7.4 Novartis: Annual Revenues, FY 2018 Onwards (USD Billion)
- Figure 7.5 Pfizer: Annual Revenues, FY 2018 Onwards (USD Billion)
- Figure 9.1 Partnerships and Collaborations: Cumulative Year-wise Trend, since 2018
- Figure 9.2 Partnerships and Collaborations: Distribution by Type of Partnership
- Figure 9.3 Partnerships and Collaborations: Distribution by Year and Type of Partnership, since 2018
- Figure 9.4 Partnerships and Collaborations: Distribution by Type of Partner
- Figure 9.5 Partnerships and Collaborations: Distribution by Drug Involved
- Figure 9.6 Partnerships and Collaborations: Distribution by Type of Cancer Targeted
- Figure 9.7 Most Active Players: Distribution by Number of Partnerships
- Figure 9.8 Partnership and Collaborations: Local and International Agreements
- Figure 9.9 Partnerships and Collaborations: Intracontinental and Intercontinental Agreements
- Figure 10.1 Clinical Trial Analysis: Cumulative Year-wise Trend, since 2018
- Figure 10.2 Clinical Trial Analysis: Distribution of Number of Patients Enrolled by Trial Registration Year, since 2018
- Figure 10.3 Clinical Trial Analysis: Distribution by Trial Phase
- Figure 10.4 Clinical Trial Analysis: Distribution of Number of Patients Enrolled by Trial Phase
- Figure 10.5 Clinical Trial Analysis: Distribution by Trial Registration Year and Trial Phase, since 2018
- Figure 10.6 Clinical Trial Analysis: Distribution by Trial Status
- Figure 10.7 Clinical Trial Analysis: Distribution by Trial Registration Year and Trial Status, since 2018
- Figure 10.8 Clinical Trial Analysis: Distribution by Target Patient Population
- Figure 10.9 Clinical Trial Analysis: Distribution by Patient Gender
- Figure 10.10 Clinical Trial Analysis: Distribution by Type of Cancer Targeted
- Figure 10.11 Clinical Trial Analysis: Distribution by Type of Sponsor / Collaborator
- Figure 10.12 Clinical Trial Analysis: Distribution by Type of Trial Masking
- Figure 10.13 Clinical Trial Analysis: Distribution by Type of Intervention Model
- Figure 10.14 Clinical Trial Analysis: Distribution by Type of Intervention
- Figure 10.15 Clinical Trial Analysis: Distribution by Trial Purpose
- Figure 10.16 Leading Industry Players: Distribution by Number of Clinical Trials
- Figure 10.17 Leading Non-Industry Players: Distribution by Number of Clinical Trials
- Figure 10.18 Word Cloud Analysis: Emerging Focus Areas
- Figure 10.19 Clinical Trial Analysis: Distribution of Clinical Trials by Geography
- Figure 10.20 Clinical Trial Analysis: Distribution of Clinical Trials by Geography and Trial Status
- Figure 10.21 Clinical Trial Analysis: Distribution of Patients Enrolled by Geography and Trial Status
- Figure 11.1 Oncology Precision Medicine Assay Kits: Distribution by Stage of Development
- Figure 11.2 Oncology Precision Medicine Assay Kits: Distribution by Regulatory Certification / Compliance
- Figure 11.3 Oncology Precision Medicine Assay Kits: Distribution by Regional Availability
- Figure 11.4 Oncology Precision Medicine Assay Kits: Distribution by Type of Test
- Figure 11.5 Oncology Precision Medicine Assay Kits: Distribution by Type of Sample Used
- Figure 11.6 Oncology Precision Medicine Assay Kits: Distribution by Principle of Biomarker Detection
- Figure 11.7 Oncology Precision Medicine Assay Kits: Distribution by Turnaround Time
- Figure 11.8 Oncology Precision Medicine Assay Kits: Distribution by Type of Cancer Targeted
- Figure 11.9 Oncology Precision Medicine Assay Kits: Distribution by Turnaround Time and Type of Cancer Targeted
- Figure 11.10 Oncology Precision Medicine Assay Kits: Distribution by End-user
- Figure 11.11 Oncology Precision Medicine Assay Kits: Distribution by Regional Availability and End-user
- Figure 11.12 Oncology Precision Medicine Assay Kits: Distribution by Type of Cancer Targeted and End-user
- Figure 11.13 Oncology Precision Medicine Assay Kit Developers: Distribution by Year of Establishment
- Figure 11.14 Oncology Precision Medicine Assay Kit Developers: Distribution by Company Size
- Figure 11.15 Oncology Precision Medicine Assay Kit Developers: Distribution by Location of Headquarters (Region)
- Figure 11.16 Oncology Precision Medicine Assay Kit Developers: Distribution by Location of Headquarters (Country)
- Figure 11.17 Oncology Precision Medicine Assay Kit Developers: Distribution by Company Size and Location of Headquarters (Region)
- Figure 11.18 Oncology Precision Medicine Assay Kit Developers: Distribution by Business Model
- Figure 11.19 Most Active Developers: Distribution by Number of Oncology Precision Medicine Assay Kits Developed
- Figure 12.1 Applications of NGS in Oncology Precision Medicine
- Figure 12.2 Applications of Nanotechnology in Oncology Precision Medicine
- Figure 12.3 Applications of Molecular Imaging Technologies in Oncology Precision Medicine
- Figure 12.4 Applications of Omics Technologies in Oncology Precision Medicine
- Figure 12.5 Applications of AI in Oncology Precision Medicine
- Figure 13.1 Oncology Precision Medicine: Market Drivers
- Figure 13.2 Oncology Precision Medicine: Market Restraints
- Figure 13.3 Oncology Precision Medicine: Market Opportunities
- Figure 13.4 Oncology Precision Medicine: Market Challenges
- Figure 14.1 Global Oncology Precision Medicine Market, Historical Trends (since 2018) and Forecasted Estimates (till 2035) (USD Billion)
- Figure 14.2 Global Oncology Precision Medicine Market, till 2035: Conservative Scenario (USD Billion)
- Figure 14.3 Global Oncology Precision Medicine Market, till 2035: Optimistic Scenario (USD Billion)
- Figure 15.1 Oncology Precision Medicine Market: Distribution by Type of Cancer Targeted, 2023, 2028 and 2035
- Figure 15.2 Oncology Precision Medicine Market for Bladder Cancer, till 2035 (USD Billion)
- Figure 15.3 Oncology Precision Medicine Market for Blood / Hematologic Cancer, till 2035 (USD Billion)
- Figure 15.4 Oncology Precision Medicine Market for Breast Cancer, till 2035 (USD Billion)
- Figure 15.5 Oncology Precision Medicine Market for Cervical Cancer, till 2035 (USD Billion)
- Figure 15.6 Oncology Precision Medicine Market for Gastrointestinal Cancer, till 2035 (USD Billion)
- Figure 15.7 Oncology Precision Medicine Market for Head and Neck Squamous Cancer, till 2035 (USD Billion)
- Figure 15.8 Oncology Precision Medicine Market for Lung Cancer, till 2035 (USD Billion)
- Figure 15.9 Oncology Precision Medicine Market for Skin Cancer, till 2035 (USD Billion)
- Figure 15.10 Oncology Precision Medicine Market for Other Cancers, till 2035 (USD Billion)
- Figure 16.1 Oncology Precision Medicine Market: Distribution by Route of Administration, 2023, 2028 and 2035
- Figure 16.2 Oncology Precision Medicine Market for Oral, till 2035 (USD Billion)
- Figure 16.3 Oncology Precision Medicine Market for Intravenous, till 2035 (USD Billion)
- Figure 16.4 Oncology Precision Medicine Market for Others, till 2035 (USD Billion)
- Figure 17.1 Oncology Precision Medicine Market: Distribution by Type of Molecule, 2023, 2028 and 2035
- Figure 17.2 Oncology Precision Medicine Market for Small Molecules, till 2035 (USD Billion)
- Figure 17.3 Oncology Precision Medicine Market for Biologics, till 2035, (USD Billion)
- Figure 18.1 Oncology Precision Medicine Market: Distribution by Drug Class, 2023, 2028 and 2035
- Figure 18.2 Oncology Precision Medicine Market for Kinase Inhibitors, till 2035 (USD Billion)
- Figure 18.3 Oncology Precision Medicine Market for Enzyme Inhibitors, till 2035 (USD Billion)
- Figure 18.4 Oncology Precision Medicine Market for Immune Checkpoint Inhibitors, till 2035 (USD Billion)
- Figure 18.5 Oncology Precision Medicine Market for Others, till 2035 (USD Billion)
- Figure 19.1 Oncology Precision Medicine Market: Distribution by Key Geographical Regions, 2023, 2028 and 2035
- Figure 19.2 Oncology Precision Medicine Market in North America, till 2035 (USD Billion)
- Figure 19.3 Oncology Precision Medicine Market in the US, till 2035 (USD Billion)
- Figure 19.4 Oncology Precision Medicine Market in Canada, till 2035 (USD Billion)
- Figure 19.5 Oncology Precision Medicine Market in Europe, till 2035 (USD Billion)
- Figure 19.6 Oncology Precision Medicine Market in France, till 2035 (USD Billion)
- Figure 19.7 Oncology Precision Medicine Market in Germany, till 2035 (USD Billion)
- Figure 19.8 Oncology Precision Medicine Market in Italy, till 2035 (USD Billion)
- Figure 19.9 Oncology Precision Medicine Market in Spain, till 2035 (USD Billion)
- Figure 19.10 Oncology Precision Medicine Market in UK, till 2035 (USD Billion)
- Figure 19.11 Oncology Precision Medicine Market in Asia, till 2035 (USD Billion)
- Figure 19.12 Oncology Precision Medicine Market in China, till 2035 (USD Billion)
- Figure 19.13 Oncology Precision Medicine Market in Japan, till 2035 (USD Billion)
- Figure 19.14 Oncology Precision Medicine Market in Korea, till 2035 (USD Billion)
- Figure 19.15 Oncology Precision Medicine Market in India, till 2035 (USD Billion)
- Figure 19.16 Oncology Precision Medicine Market in Middle East and North Africa, till 2035 (USD Billion)
- Figure 19.17 Oncology Precision Medicine Market in UAE, till 2035 (USD Billion)
- Figure 19.18 Oncology Precision Medicine Market in Israel, till 2035 (USD Billion)
- Figure 19.19 Oncology Precision Medicine Market in Qatar, till 2035 (USD Billion)
- Figure 19.20 Oncology Precision Medicine Market in Rest of Middle East and North Africa, till 2035 (USD Billion)
- Figure 19.21 Oncology Precision Medicine Market in Latin America, till 2035 (USD Billion)
- Figure 19.22 Oncology Precision Medicine Market in Brazil, till 2035 (USD Billion)
- Figure 19.18 Oncology Precision Medicine Market in Israel, till 2035 (USD Billion)
- Figure 19.19 Oncology Precision Medicine Market in Chile, till 2035 (USD Billion)
- Figure 19.20 Oncology Precision Medicine Market in Rest of Latin America, till 2035 (USD Billion)
- Figure 20.1 Blockbuster Commercialized Oncology Precision Medicine Market: ADCETRIS(R) Sales Forecast, till 2035 (USD Billion)
- Figure 20.2 Blockbuster Commercialized Oncology Precision Medicine Market: Alecensa(R) Sales Forecast, till 2035 (USD Billion)
- Figure 20.3 Blockbuster Commercialized Oncology Precision Medicine Market: ALUNBRIG(R) Sales Forecast, till 2035 (USD Billion)
- Figure 20.4 Blockbuster Commercialized Oncology Precision Medicine Market: Avastin(R) Sales Forecast, till 2035 (USD Billion)
- Figure 20.5 Blockbuster Commercialized Oncology Precision Medicine Market: Ayvakit(R) Sales Forecast, till 2035 (USD Billion)
- Figure 20.6 Blockbuster Commercialized Oncology Precision Medicine Market: Braftovi(R)+ Mektovi(R) Sales Forecast, till 2035 (USD Billion)
- Figure 20.7 Blockbuster Commercialized Oncology Precision Medicine Market: BRUKINSA(R) Sales Forecast, till 2035 (USD Billion)
- Figure 20.8 Blockbuster Commercialized Oncology Precision Medicine Market: CALQUENCE(R) Sales Forecast, till 2035 (USD Billion)
- Figure 20.9 Blockbuster Commercialized Oncology Precision Medicine Market: DARZALEX(R) Sales Forecast, till 2035 (USD Billion)
- Figure 20.10 Blockbuster Commercialized Oncology Precision Medicine Market: Elunate(R) Sales Forecast, till 2035 (USD Billion)
- Figure 20.11 Blockbuster Commercialized Oncology Precision Medicine Market: Empliciti(R) Sales Forecast, till 2035 (USD Billion)
- Figure 20.12 Blockbuster Commercialized Oncology Precision Medicine Market: Enhertu(R) Sales Forecast, till 2035 (USD Billion)
- Figure 20.13 Blockbuster Commercialized Oncology Precision Medicine Market: IBRANCE(R) Sales Forecast, till 2035 (USD Billion)
- Figure 20.14 Blockbuster Commercialized Oncology Precision Medicine Market: ICLUSIG(R) Sales Forecast, till 2035 (USD Billion)
- Figure 20.15 Blockbuster Commercialized Oncology Precision Medicine Market: IMBRUVICA(R) Sales Forecast, till 2035 (USD Billion)
- Figure 20.16 Blockbuster Commercialized Oncology Precision Medicine Market: IMFINZI(R) Sales Forecast, till 2035 (USD Billion)
- Figure 20.17 Blockbuster Commercialized Oncology Precision Medicine Market: INLYTA(R) Sales Forecast, till 2035 (USD Billion)
- Figure 20.18 Blockbuster Commercialized Oncology Precision Medicine Market: Keytruda(R) Sales Forecast, till 2035 (USD Billion)
- Figure 20.19 Blockbuster Commercialized Oncology Precision Medicine Market: Kadcyla(R) Sales Forecast, till 2035 (USD Billion)
- Figure 20.20 Blockbuster Commercialized Oncology Precision Medicine Market: LENVIMA(R) / KISPLYX(R) Sales Forecast, till 2035 (USD Billion)
- Figure 20.21 Blockbuster Commercialized Oncology Precision Medicine Market: Lumakras(R) / Lumykras(R) Sales Forecast, till 2035 (USD Billion)
- Figure 20.22 Blockbuster Commercialized Oncology Precision Medicine Market: Mekinist(R) Sales Forecast, till 2035 (USD Billion)
- Figure 20.23 Blockbuster Commercialized Oncology Precision Medicine Market: NERLYNX(R) Sales Forecast, till 2035 (USD Billion)
- Figure 20.24 Blockbuster Commercialized Oncology Precision Medicine Market: NINLARO(R) Sales Forecast, till 2035 (USD Billion)
- Figure 20.25 Blockbuster Commercialized Oncology Precision Medicine Market: Opdivo(R) Sales Forecast, till 2035 (USD Billion)
- Figure 20.26 Blockbuster Commercialized Oncology Precision Medicine Market: Padcev(R) Sales Forecast, till 2035 (USD Billion)
- Figure 20.27 Blockbuster Commercialized Oncology Precision Medicine Market: Piqray(R) Sales Forecast, till 2035 (USD Billion)
- Figure 20.28 Blockbuster Commercialized Oncology Precision Medicine Market: Sprycel(R) Sales Forecast, till 2035 (USD Billion)
- Figure 20.29 Blockbuster Commercialized Oncology Precision Medicine Market: Tabrecta(R) Sales Forecast, till 2035 (USD Billion)
- Figure 20.30 Blockbuster Commercialized Oncology Precision Medicine Market: Tagrisso(R) Sales Forecast, till 2035 (USD Billion)
- Figure 20.31 Blockbuster Commercialized Oncology Precision Medicine Market: Tasigna(R) Sales Forecast, till 2035 (USD Billion)
- Figure 20.32 Blockbuster Commercialized Oncology Precision Medicine Market: Tecentriq(R) Sales Forecast, till 2035 (USD Billion)
- Figure 20.33 Blockbuster Commercialized Oncology Precision Medicine Market: VENCLEXTA(R) Sales Forecast, till 2035 (USD Billion)
- Figure 20.34 Blockbuster Commercialized Oncology Precision Medicine Market: Verzenio(R) / Verzenios Sales Forecast, till 2035 (USD Billion)
- Figure 20.35 Blockbuster Commercialized Oncology Precision Medicine Market: Xospata(R) Sales Forecast, till 2035 (USD Billion)
- Figure 20.36 Blockbuster Commercialized Oncology Precision Medicine Market: XTANDI(R) Sales Forecast, till 2035 (USD Billion)
- Figure 20.37 Blockbuster Commercialized Oncology Precision Medicine Market: ZEJULA(R) Sales Forecast, till 2035 (USD Billion)
- Figure 20.38 NDA-filed Oncology Precision Medicine Market: Apatinib / Rivoceranib Sales Forecast, till 2035 (USD Billion)
- Figure 20.39 NDA-filed Oncology Precision Medicine Market: Elunate(R) Sales Forecast, till 2035 (USD Billion)
- Figure 20.40 Phase III Oncology Precision Medicine Market: Darovasertib / IDE196 Sales Forecast, till 2035 (USD Billion)
- Figure 20.41 Phase III Oncology Precision Medicine Market: Darovasertib / IDE196 Regional Sales Forecast, till 2035 (USD Billion)
- Figure 20.42 Phase III Oncology Precision Medicine Market: Elenestinib / BLU-263 Sales Forecast, till 2035 (USD Billion)
- Figure 20.43 Phase III Oncology Precision Medicine Market: Elenestinib / BLU-263 Regional Sales Forecast, till 2035 (USD Billion)
- Figure 20.44 Phase III Oncology Precision Medicine Market: Elunate(R) Sales Forecast, till 2035 (USD Billion)
- Figure 20.45 Phase III Oncology Precision Medicine Market: Elunate(R) Sales Forecast by Type of Cancer Targeted, till 2035 (USD Billion)
- Figure 20.46 Phase III Oncology Precision Medicine Market: Elunate(R) Regional Sales Forecast, till 2035 (USD Billion)
- Figure 20.47 Phase III Oncology Precision Medicine Market: ORPATHYS(R) Sales Forecast, till 2035 (USD Billion)
- Figure 20.48 Phase III Oncology Precision Medicine Market: ORPATHYS(R) Regional Sales Forecast, till 2035 (USD Billion)
- Figure 20.49 Phase III Oncology Precision Medicine Market: Pyrotinib Sales Forecast, till 2035 (USD Billion)
- Figure 20.50 Phase III Oncology Precision Medicine Market: Pyrotinib Sales Forecast by Type of Cancer Targeted, till 2035 (USD Billion)
- Figure 20.51 Phase III Oncology Precision Medicine Market: Pyrotinib Regional Sales Forecast, till 2035 (USD Billion)
- Figure 20.52 Phase III Oncology Precision Medicine Market: SYD985 / (Vic-)trastuzumab duocarmazine) Sales Forecast, till 2035 (USD Billion)
- Figure 20.53 Phase III Oncology Precision Medicine Market: SYD985 / (Vic-)trastuzumab duocarmazine) Regional Sales Forecast, till 2035 (USD Billion)
- Figure 20.54 Phase III Oncology Precision Medicine Market: ZOLINZA(R) Sales Forecast, till 2035 (USD Billion)
- Figure 20.55 Phase III Oncology Precision Medicine Market: ZOLINZA(R) Regional Sales Forecast, till 2035 (USD Billion)
- Figure 21.1 Oncology Precision Medicine Market: Distribution by Leading Drug Developers (based on sales of oncology precision medicines in the year 2022 (USD Billion))
- Figure 22.1 Conclusion: Market Landscape
- Figure 22.2 Conclusion: Partnerships and Collaborations
- Figure 22.3 Conclusion: Clinical Trial Analysis
- Figure 22.4 Conclusion: Case Study Oncology Precision Medicine Assay Kits
- Figure 22.5 Conclusion: Market Forecast and Opportunity Analysis

