
PUBLISHER: Roots Analysis | PRODUCT CODE: 1737052

PUBLISHER: Roots Analysis | PRODUCT CODE: 1737052
Companion Diagnostics Development Market Distribution By Type of Services Offered, Analytical Techniques Used, Target Therapeutic Area, End User and Key Geographical Regions
COMPANION DIAGNOSTICS (CDX) DEVELOPMENT MARKET: OVERVIEW
As per Roots Analysis, the global companion diagnostics (CDx) development market is estimated to grow from USD 892 million in current year to USD 1,796 million by 2035, at a CAGR of 7.3% during the forecast period, till 2035.
The market sizing and opportunity analysis has been segmented across the following parameters:
Type of Services Offered
- Feasibility Studies
- Assay Development
- Analytical Validation
- Clinical Validation
- Manufacturing
Analytical Techniques Used
- NGS
- PCR
- IHC
- Flow Cytometry
- Others
Target Therapeutic Area
- Oncological Disorders
- Non-oncological Disorders
End User
- Industry Players
- Non-industry Players
Key Geographical Regions
- North America
- Europe
- Asia-Pacific
COMPANION DIAGNOSTICS (CDX) DEVELOPMENT MARKET: GROWTH AND TRENDS
A companion diagnostic is a type of in-vitro diagnostic (IVD) device / test that enables researchers to collect crucial information for the safe and efficient use of a compatible drug or biological product. Recently, there has been a gradual shift towards understanding the molecular mechanisms involved in disease pathogenesis, and the information collected from companion diagnostic tools aids in the development of targeted therapies to treat these diseases. As a result, companion diagnostics have become an integral part of the healthcare sector to provide information about the unique genetic profiles of patients that further allow clinicians to develop treatment plans. It is worth noting that, since 2022, the FDA has approved close to 44 CDx diagnostics. Of these, three CDx-targeted therapies have received approval for advanced ovarian cancer, breast cancer, and non-small cell lung cancer.
Using these companion diagnostics to collect disease-specific information helps increase the success rate of target-specific therapies and improve overall patient outcomes. However, the development of such tests is a long process that starts from the identification of a suitable biomarker (specific to a particular disease indication) and extends to validating a precise method for detecting and quantifying its presence in biological samples. Given the complexities involved in the development of such diagnostic tests, drug developers prefer outsourcing this process to contract service providers having the necessary expertise.
Presently, numerous companies claim to offer a variety of services for diagnostic development, including biomarker identification and discovery, biomarker selection and validation, assay development, analytical validation, clinical validation, commercialization, manufacturing, services related to companion diagnostic kits, reagent development and regulatory assistance.
COMPANION DIAGNOSTICS (CDX) DEVELOPMENT MARKET: KEY INSIGHTS
The report delves into the current state of the companion diagnostics (CDx) development market and identifies potential growth opportunities within the industry. Some key findings from the report include:
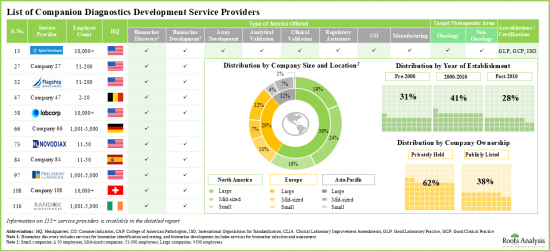
- Over 155 service providers presently claim to have the required expertise to support multiple steps involved in companion diagnostic development; ~30% of these are established players with more than 500 employees.
- Companies offer services to develop analytical tests to identify disease specific biomarkers; oncology is the more popular area wherein developers are exploring personalized diagnostic regimens.
- In pursuit of building a competitive edge in this field, stakeholders are actively upgrading their existing capabilities and adding new competencies in order to enhance their respective service portfolios.
- Close to 300 companion diagnostic products, based on various analytical platforms, are available / under development to facilitate biomarker detection from different types of biological specimens.
- More than 80% of the companion diagnostic products have received approval for the treatment of oncological disorders; of these, 95% of the products are currently intended for use with drugs targeting solid tumors.
- The rising interest of stakeholders is evident from the rise in partnership activity; in fact, more than 80 agreements related to companion diagnostic development services were inked in the last two years.
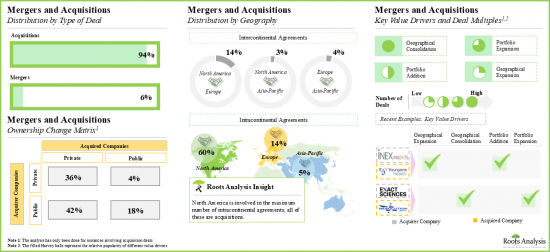
- The surge in mergers and acquisitions is driven by the increasing demand for CDx; 65% of acquisition agreements were signed to incorporate additional capabilities into their existing portfolio offerings.
- As drug developers continue to build a robust portfolio of biomarker-based targeted therapies, they are actively seeking partnerships with CDx service providers, in order to leverage the latter's expertise in this domain.
- Over the years, several big pharma players have sponsored multiple biomarker focused clinical trials; the use of companion diagnostic tests to stratify patient population in these trials offers significant cost reduction (~60%).
- The advent of bioinformatics and artificial intelligence tools has led to the development of over 125 software applications that integrate clinical and diagnostic data to deliver personalized experiences to patients.
- Over 115 players currently offer software applications for diagnostic, therapeutic and analytical purposes; these solutions are also capable of handling variable data types across a range of therapeutic areas.
- The companion diagnostic development value chain involves several drug and diagnostics developers, service providers, along with other key stakeholders, each having a discrete set of priorities and requirements.
- The companion diagnostic development services market is anticipated to grow at a CAGR of 7.3%, till 2035; North America is expected to capture the majority share (over 65%) of the market by 2035.
COMPANION DIAGNOSTICS (CDX) DEVELOPMENT MARKET: KEY SEGMENTS
Clinical Validation Service Segment Occupies the Largest Share of the Companion Diagnostics (CDx) Development Market
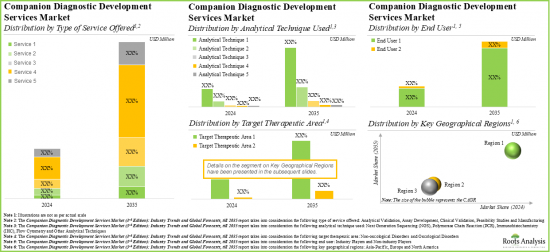
Based on the type of services offered, the market is segmented into feasibility studies, assay development, analytical validation, clinical validation and manufacturing. At present, the clinical validation service segment holds the maximum share of the global companion diagnostics (CDx) development market. Additionally, the analytical validation service segment is likely to grow at a faster pace during the forecasted period.
By Analytical Techniques Used, IHC (Immunohistochemistry) is the Fastest Growing Segment of the Global Companion Diagnostics (CDx) Development Market
Based on the analytical techniques used, the market is segmented into NGS, PCR, IHC, flow cytometry and others. Currently, the next generation sequencing (NGS) segment captures the highest proportion of the global companion diagnostics (CDx) development market owing to the various benefits offered by this analytical technique, such as lower sample input, higher throughput and greater sensitivity. Further, the companion diagnostics (CDx) development market for the IHC segment is likely to grow at a relatively higher CAGR.
Oncological Disorders Segment Occupies the Largest Share of the Companion Diagnostics (CDx) Development Market by Target Therapeutic Area
Based on the target therapeutic area, the market is segmented into oncological disorders and non-oncological disorders. At present, companion diagnostics for oncological disorders hold the maximum share of the companion diagnostics (CDx) development market. This trend is likely to remain the same during the forecasted period. Further, it is worth highlighting that the companion diagnostics (CDx) development market for non-oncological disorders segment is likely to grow at a relatively higher CAGR.
Currently, the Industry Players Segment Holds the Largest Share of the Companion Diagnostics (CDx) Development Market
Based on end user, the global market is segmented into industry players and non-industry players. Currently, the industry players segment holds the largest market share. However, the companion diagnostics (CDx) development market for non-industry players segment is expected to witness substantial growth in the coming years.
North America Accounts for the Largest Share of the Market
Based on key geographical regions, the market is segmented into North America, Europe and Asia-Pacific. Currently, North America dominates the global companion diagnostics (CDx) development market and accounts for the largest revenue share. However, the market in Europe is expected to grow at a higher CAGR in the coming years.
Example Players in the Companion Diagnostics (CDx) Development Market
- Almac Diagnostics
- BGI Genomics
- Eurofins
- Geneuity Clinical Research Services
- Labcorp
- MEDICAL & BIOLOGICAL LABORATORIES
- Q2 Solutions
- QIAGEN
- Quest Diagnostics
- ResearchDx
COMPANION DIAGNOSTICS (CDX) DEVELOPMENT MARKET: RESEARCH COVERAGE
- Market Sizing and Opportunity Analysis: The report features an in-depth analysis of the global companion diagnostics (CDx) development market, focusing on key market segments, including [A] type of services offered, [B] analytical techniques used, [C] target therapeutic area, [D] end user and [E] key geographical regions.
- Service Providers Market Landscape: A comprehensive evaluation of the companion diagnostics (CDx) development industry players, based on several relevant parameters, such as [A] year of establishment, [B] company size, [C] ownership, [D] geographical location of headquarters, [E] types of services offered, [F] affiliated services, [G] AI support, [H] analytical techniques used, [I] therapeutic areas and [J] regulatory certifications / accreditations.
- Company Competitiveness Analysis: A comprehensive competitive analysis of service providers in the companion diagnostics (CDx) development industry, examining factors, such as [A] developer strength and [B] product portfolio strength.
- Detailed Company Profiles: In-depth profiles of key service providers engaged in the companion diagnostics (CDx) development market, focusing on [A] overview of the company, [B] financial information (if available), [C] service portfolio, and [D] recent developments and [E] an informed future outlook.
- Short Company Profiles: Tabulated profiles of key service providers engaged in the companion diagnostics (CDx) development market, focusing on [A] overview of the company and [B] service portfolio.
- Companion Diagnostic Products Market Landscape: A comprehensive evaluation of the companion diagnostic products, based on several relevant parameters, such as [A] analytical techniques used, [B] target disease indication, [C] therapeutic areas, [D] type of biomarker detected, [E] type of sample used, [F] regulatory authority involved, [G] expediated review designation, [H] leading companion diagnostic developers and [I] most popular companion drugs. Additionally, a comprehensive evaluation of the companion diagnostic developers, based on several relevant parameters, such as [J] year of establishment, [K] company size, [L] ownership and [M] geographical location of headquarters.
- Partnerships and Collaborations: An insightful analysis of the deals inked by stakeholders in the companion diagnostics (CDx) development market, based on several parameters, such as [A] year of partnership, [B] type of partnership, [C] type of technology, [D] target therapeutic area, [E] type of partner, [F] most active players (in terms of the number of partnerships signed) and [G] geographical distribution of partnership activity.
- Likely Partner Analysis: An in-depth analysis of 300+ drug developers sponsoring clinical trials of therapies targeting several disease-specific biomarkers, shortlisted based on relevant parameters, such as [A] number of biomarker-focused clinical trials sponsored and [B] time to market their proprietary personalized medicine products.
- Mergers and Acquisitions: An in-depth analysis of various mergers and acquisitions in this domain, based on relevant parameters, such as [A] year of agreement, [B] type of deal, [C] geographical location of headquarters, [D] company size, [E] key value drivers and [F] acquisition deal multiples (based on revenues). Additionally, an ownership change matrix provides a summary of the involvement of private and public sector companies in this domain.
- Stakeholder Needs Analysis: An insightful analysis of the current and long-term needs of different stakeholders, along with the key areas of concern associated with this industry.
- Value Chain Analysis: An in-depth analysis of the companion diagnostics value chain, based on various relevant parameters, such as [A] various steps of development operations and [B] the cost requirements across each step.
- Big Pharma Initiatives: An in-depth analysis of oncology clinical trials sponsored by prominent big pharmaceutical companies in the companion diagnostics domain, based on various relevant parameters, such as [A] trial registration year, [B] phase of development, [C] trial sponsors, [D] recruitment status, [E] therapy design, [F] enrolled patient population, [G] popularity of biomarkers and [H] popularity of target indications.
- Case Study: A detailed discussion on the current market landscape of precision medicine software solutions that offer intelligent insights to diagnostic developers, service providers, patients and healthcare experts, based on [A] type of platform utilized, [B] purpose of software solution, [C] type of data processed, [D] therapeutic area, and [E] types of end users. Additionally, a comprehensive evaluation of software solutions developers, based on several relevant parameters, such as [A] year of establishment, [B] company size, [c] ownership and [D] geographical location of headquarters.
- Market Impact Analysis: A thorough analysis of various factors, such as drivers, restraints, opportunities, and existing challenges that are likely to impact market growth.
KEY QUESTIONS ANSWERED IN THIS REPORT
- How many companies are currently engaged in this market?
- Which are the leading companies in this market?
- What factors are likely to influence the evolution of this market?
- What is the current and future market size?
- What is the CAGR of this market?
- How is the current and future market opportunity likely to be distributed across key market segments?
REASONS TO BUY THIS REPORT
- The report provides a comprehensive market analysis, offering detailed revenue projections of the overall market and its specific sub-segments. This information is valuable to both established market leaders and emerging entrants.
- Stakeholders can leverage the report to gain a deeper understanding of the competitive dynamics within the market. By analyzing the competitive landscape, businesses can make informed decisions to optimize their market positioning and develop effective go-to-market strategies.
- The report offers stakeholders a comprehensive overview of the market, including key drivers, barriers, opportunities, and challenges. This information empowers stakeholders to stay abreast of market trends and make data-driven decisions to capitalize on growth prospects.
ADDITIONAL BENEFITS
- Complimentary PPT Insights Packs
- Complimentary Excel Data Packs for all Analytical Modules in the Report
- 15% Free Content Customization
- Detailed Report Walkthrough Session with Research Team
- Free Updated report if the report is 6-12 months old or older
TABLE OF CONTENTS
1. PREFACE
- 1.1. Introduction
- 1.2. Market Share Insights
- 1.3. Key Market Insights
- 1.4. Report Coverage
- 1.5. Key Questions Answered
- 1.6. Chapter Outlines
2. RESEARCH METHODOLOGY
- 2.1. Chapter Overview
- 2.2. Research Assumptions
- 2.3. Project Methodology
- 2.4. Forecast Methodology
- 2.5. Robust Quality Control
- 2.6. Key Market Segmentations
- 2.7. Key Considerations
- 2.7.1. Demographics
- 2.7.2. Economic Factors
- 2.7.3. Government Regulations
- 2.7.4. Supply Chain
- 2.7.5. COVID Impact / Related Factors
- 2.7.6. Market Access
- 2.7.7. Healthcare Policies
- 2.7.8. Industry Consolidation
3. ECONOMIC AND OTHER PROJECT SPECIFIC CONSIDERATIONS
- 3.1. Chapter Overview
- 3.2. Market Dynamics
- 3.2.1. Time Period
- 3.2.1.1. Historical Trends
- 3.2.1.2. Current and Forecasted Estimates
- 3.2.2. Currency Coverage
- 3.2.2.1. Overview of Major Currencies Affecting the Market
- 3.2.2.2. Impact of Currency Fluctuations on the Industry
- 3.2.3. Foreign Exchange Impact
- 3.2.3.1. Evaluation of Foreign Exchange Rates and Their Impact on Market
- 3.2.3.2. Strategies for Mitigating Foreign Exchange Risk
- 3.2.4. Recession
- 3.2.4.1. Historical Analysis of Past Recessions and Lessons Learnt
- 3.2.4.2. Assessment of Current Economic Conditions and Potential Impact on the Market
- 3.2.5. Inflation
- 3.2.5.1. Measurement and Analysis of Inflationary Pressures in the Economy
- 3.2.5.2. Potential Impact of Inflation on the Market Evolution
- 3.2.1. Time Period
4. EXECUTIVE SUMMARY
5. INTRODUCTION
- 5.1. Chapter Overview
- 5.2. Evolution of Personalized Medicines
- 5.3. An Overview of Companion Diagnostics
- 5.3.1. Development of Companion Diagnostics
- 5.3.2. Analytical Techniques Used in Companion Diagnostic Tests
- 5.3.2.1. Immunohistochemistry
- 5.3.2.2. In-situ Hybridization
- 5.3.2.3. Polymerase Chain Reaction
- 5.3.2.4. DNA Sequencing / Next Generation Sequencing
- 5.3.3. Advantages of Companion Diagnostics
- 5.4. Applications of Companion Diagnostics across Different Therapeutic Areas
- 5.4.1. Oncological Disorders
- 5.4.2. Infectious Diseases
- 5.4.3. Neurological Disorders
- 5.5. Regulatory Review and Approval Process for Companion Diagnostics
- 5.6. Existing Challenges and Need for Outsourcing
- 5.7. Basic Guidelines for Selecting a Contract Diagnostics Organization (CDO)
- 5.8. Future Perspectives
6. COMPANION DIAGNOSTICS DEVELOPMENT SERVICE PROVIDERS: MARKET LANDSCAPE
- 6.1. Chapter Overview
- 6.2. Companion Diagnostics Development Service Providers: List of Players
- 6.2.1. Analysis by Year of Establishment
- 6.2.2. Analysis by Company Size
- 6.2.3. Analysis by Location of Headquarters
- 6.2.4. Analysis by Company Size and Location of Headquarters (Region)
- 6.2.5. Analysis by Company Ownership
- 6.2.6. Analysis by Type of Services Offered
- 6.2.7. Analysis by Type of Affiliated Service Offered
- 6.2.8. Analysis by AI Support
- 6.2.9. Analysis by Type of Analytical Techniques Used
- 6.2.10. Analysis by Target Therapeutic Area
- 6.2.11. Analysis by Regulatory Accreditation / Certification
- 6.2.12. Analysis by Type of Services Offered, Company Size and Location of Headquarters (Region)
- 6.2.13. Analysis by Analytical Technique Used, Company Size and Location of Headquarters (Region)
7. COMPANY COMPETITIVENESS ANALYSIS
- 7.1. Chapter Overview
- 7.2. Assumptions and Key Parameters
- 7.3. Methodology
- 7.4. Companion Diagnostics Service Providers: Company Competitiveness Analysis
- 7.4.1. Companion Diagnostics Service Providers based in North America
- 7.4.2. Companion Diagnostics Service Providers based in Europe
- 7.4.3. Companion Diagnostics Service Providers based in Asia-Pacific
8. COMPANION DIAGNOSTICS DEVELOPMENT SERVICE PROVIDERS: DETAILED COMPANY PROFILES
- 8.1. Chapter Overview
- 8.2. Key Players in North America
- 8.2.1. Geneuity Clinical Research Services
- 8.2.1.1. Company Overview
- 8.2.1.2. Service Portfolio
- 8.2.1.3. Recent Developments and Future Outlook
- 8.2.2. Labcorp
- 8.2.2.1. Company Overview
- 8.2.2.2. Service Portfolio
- 8.2.2.3. Recent Developments and Future Outlook
- 8.2.3. Q2 Solutions
- 8.2.3.1. Company Overview
- 8.2.3.2. Service Portfolio
- 8.2.3.3. Recent Developments and Future Outlook
- 8.2.4. Quest Diagnostics
- 8.2.4.1. Company Overview
- 8.2.4.2. Service Portfolio
- 8.2.4.3. Recent Developments and Future Outlook
- 8.2.5. ResearchDx
- 8.2.5.1. Company Overview
- 8.2.5.2. Service Portfolio
- 8.2.5.3. Recent Developments and Future Outlook
- 8.2.1. Geneuity Clinical Research Services
- 8.3. Key Players in Europe
- 8.3.1. Almac Diagnostic Services
- 8.3.1.1. Company Overview
- 8.3.1.2. Service Portfolio
- 8.3.1.3. Recent Developments and Future Outlook
- 8.3.2. Eurofins
- 8.3.2.1. Company Overview
- 8.3.2.2. Service Portfolio
- 8.3.2.3. Recent Developments and Future Outlook
- 8.3.3. QIAGEN
- 8.3.3.1. Company Overview
- 8.3.3.2. Service Portfolio
- 8.3.3.3. Recent Developments and Future Outlook
- 8.3.1. Almac Diagnostic Services
- 8.4. Key Players in Asia-Pacific
- 8.4.1. BGI Genomics
- 8.4.1.1. Company Overview
- 8.4.1.2. Service Portfolio
- 8.4.1.3. Recent Developments and Future Outlook
- 8.4.2. MEDICAL & BIOLOGICAL LABORATORIES (MBL)
- 8.4.2.1. Company Overview
- 8.4.2.2. Service Portfolio
- 8.4.2.3. Recent Developments and Future Outlook
- 8.4.1. BGI Genomics
9. COMPANION DIAGNOSTICS DEVELOPMENT SERVICE PROVIDERS: SHORT COMPANY PROFILES
- 9.1. Chapter Overview
- 9.2. Key Players in North America
- 9.2.1. Agilent Technologies
- 9.2.1.1. Company Overview
- 9.2.1.2. Service Portfolio
- 9.2.2. Creative Biolabs
- 9.2.2.1. Company Overview
- 9.2.2.2. Service Portfolio
- 9.2.3. ICON Specialty Laboratories
- 9.2.3.1. Company Overview
- 9.2.3.2. Service Portfolio
- 9.2.4. NeoGenomics Laboratories
- 9.2.4.1. Company Overview
- 9.2.4.2. Service Portfolio
- 9.2.1. Agilent Technologies
- 9.3. Key Players in Europe
- 9.3.1. Cerba Research
- 9.3.1.1. Company Overview
- 9.3.1.2. Service Portfolio
- 9.3.2. Randox Biosciences
- 9.3.2.1. Company Overview
- 9.3.2.2. Service Portfolio
- 9.3.3. Roche
- 9.3.3.1. Company Overview
- 9.3.3.2. Service Portfolio
- 9.3.4. Siemens Healthineers
- 9.3.4.1. Company Overview
- 9.3.4.2. Service Portfolio
- 9.3.5. Unilabs
- 9.3.5.1. Company Overview
- 9.3.5.2. Service Portfolio
- 9.3.1. Cerba Research
- 9.4. Key Players in Asia-Pacific
- 9.4.1. Abnova
- 9.4.1.1. Company Overview
- 9.4.1.2. Service Portfolio
- 9.4.2. Celemics
- 9.4.2.1. Company Overview
- 9.4.2.2. Service Portfolio
- 9.4.3. MEDx Translational Medicine
- 9.4.3.1. Company Overview
- 9.4.3.2. Service Portfolio
- 9.4.4. Novogene
- 9.4.4.1. Company Overview
- 9.4.4.2. Service Portfolio
- 9.4.5. Shuwen Biotech
- 9.4.5.1. Company Overview
- 9.4.5.2. Service Portfolio
- 9.4.1. Abnova
10. COMPANION DIAGNOSTIC PRODUCTS: MARKET LANDSCAPE
- 10.1. Chapter Overview
- 10.2. Companion Diagnostics: List of Marketed / Investigational Products
- 10.2.1. Analysis by Type of Sample Used
- 10.2.2. Analysis by Type of Biomarker Detected
- 10.2.3. Analysis by Analytical Technique Used
- 10.2.4. Analysis by Target Disease Indication
- 10.2.5. Analysis by Target Therapeutic Area
- 10.2.6. Analysis by Commercial Availability and Target Therapeutic Area
- 10.2.7. Marketed Products: Analysis by Year of FDA Approval
- 10.2.8. Marketed Products: Analysis by Year of Other Regulatory Approval
- 10.2.9. Marketed Products: Analysis by Regulatory Authority Involved
- 10.2.10. Most Popular Companion Drugs: Analysis by Number of Companion Diagnostic Products
- 10.3. Companion Diagnostics: List of Developers
- 10.3.1. Analysis by Year of Establishment
- 10.3.2. Analysis by Company Size
- 10.3.3. Analysis by Location of Headquarters
- 10.3.4. Analysis by Company Ownership
- 10.3.5. Most Active Players: Analysis by Number of Marketed Products
11. PARTNERSHIPS AND COLLABORATIONS
- 11.1. Chapter Overview
- 11.2. Partnership Models
- 11.3. Companion Diagnostic Development Service Providers: Partnerships and Collaborations
- 11.3.1. Analysis by Year of Partnership
- 11.3.2. Analysis by Type of Partnership
- 11.3.3. Analysis by Year and Type of Partnership
- 11.3.4. Analysis by Type of Technology
- 11.3.5. Analysis by Target Therapeutic Area
- 11.3.6. Analysis by Type of Partner
- 11.3.7. Analysis by Year of Partnership and Type of Partner
- 11.3.8. Most Active Players: Analysis by Number of Partnerships
- 11.3.9. Analysis by Geography
- 11.3.9.1. Local and International Agreements
- 11.3.9.2. Intercontinental and Intracontinental Agreements
12. LIKELY PARTNER ANALYSIS
- 12.1. Chapter Overview
- 12.2. Scoring Criteria and Key Assumptions
- 12.3. Scope and Methodology
- 12.4. Likely Partners for Companion Diagnostics Service Providers: Alzheimer's Disease
- 12.4.1. Industry Players Focused on Amyloid Beta Biomarker
- 12.4.1.1. Regional Distribution of Amyloid Beta Biomarker Focused Clinical Trials Sponsored by Industry Players
- 12.4.2. Non-Industry Players Focused on Amyloid Beta Biomarker
- 12.4.2.1. Regional Distribution of Amyloid Beta Biomarker Focused Clinical Trials Sponsored by Non-Industry Players
- 12.4.3. Industry Players Focused on Tau Biomarker
- 12.4.3.1. Regional Distribution of Tau Biomarker Focused Clinical Trials Sponsored by Industry Players
- 12.4.4. Non-Industry Players Focused on Tau Biomarker
- 12.4.4.1. Regional Distribution of Tau Biomarker Focused Clinical Trials Sponsored by Non-Industry Players
- 12.4.1. Industry Players Focused on Amyloid Beta Biomarker
- 12.5. Likely Partners for Companion Diagnostics Service Providers: Breast Cancer
- 12.5.1. Industry Players Focused on BRCA Biomarker
- 12.5.1.1. Regional Distribution of BRCA Biomarker Focused Clinical Trials Sponsored by Industry Players
- 12.5.2. Non-Industry Players Focused on BRCA Biomarker
- 12.5.2.1. Regional Distribution of BRCA Biomarker Focused Clinical Trials Sponsored by Non-Industry Players
- 12.5.3. Industry Players Focused on HER Biomarker
- 12.5.3.1. Regional Distribution of HER Biomarker Focused Clinical Trials Sponsored by Industry Players
- 12.5.4. Non-Industry Players Focused on HER Biomarker
- 12.5.4.1. Regional Distribution of HER Biomarker Focused Clinical Trials Sponsored by Non-Industry Players
- 12.5.5. Industry Players Focused on PD-L1 Biomarker
- 12.5.5.1. Regional Distribution of PD-L1 Biomarker Focused Clinical Trials Sponsored by Industry Players
- 12.5.6. Non-Industry Players Focused on PD-L1 Biomarker
- 12.5.6.1. Regional Distribution of PD-L1 Biomarker Focused Clinical Trials Sponsored by Non-Industry Players
- 12.5.7. Industry Players Focused on HR Biomarker
- 12.5.7.1. Regional Distribution of HR Biomarker Focused Clinical Trials Sponsored by Industry Players
- 12.5.8. Non-Industry Players Focused on HR Biomarker
- 12.5.8.1. Regional Distribution of HR Biomarker Focused Clinical Trials Sponsored by Non-Industry Players
- 12.5.1. Industry Players Focused on BRCA Biomarker
- 12.6. Likely Partners for Companion Diagnostics Service Providers: Colorectal Cancer
- 12.6.1. Industry Players Focused on BRAF Biomarker
- 12.6.1.1. Regional Distribution of BRAF Biomarker Focused Clinical Trials Sponsored by Industry Players
- 12.6.2. Non-Industry Players Focused on BRAF Biomarker
- 12.6.2.1. Regional Distribution of BRAF Biomarker Focused Clinical Trials Sponsored by Non-Industry Players
- 12.6.3. Industry Players Focused on EGFR Biomarker
- 12.6.3.1. Regional Distribution of EGFR Biomarker Focused Clinical Trials Sponsored by Industry Players
- 12.6.4. Non-Industry Players Focused on EGFR Biomarker
- 12.6.4.1. Regional Distribution of EGFR Biomarker Focused Clinical Trials Sponsored by Non-Industry Players
- 12.6.5. Industry Players Focused on KRAS Biomarker
- 12.6.5.1. Regional Distribution of KRAS Biomarker Focused Clinical Trials Sponsored by Industry Players
- 12.6.6. Non-Industry Players Focused on KRAS Biomarker
- 12.6.6.1. Regional Distribution of KRAS Biomarker Focused Clinical Trials Sponsored by Non-Industry Players
- 12.6.7. Industry Players Focused on MSI / dMMR Biomarker
- 12.6.7.1. Regional Distribution of MSI / dMMR Biomarker Focused Clinical Trials Sponsored by Industry Players
- 12.6.8. Non-Industry Players Focused on MSI / dMMR Biomarker
- 12.6.8.1. Regional Distribution of MSI / dMMR Biomarker Focused Clinical Trials Sponsored by Non-Industry Players
- 12.6.1. Industry Players Focused on BRAF Biomarker
- 12.7. Likely Partners for Companion Diagnostic Service Providers: Lung Cancer
- 12.7.1. Industry Players Focused on ALK Biomarker
- 12.7.1.1. Regional Distribution of ALK Biomarker Focused Clinical Trials Sponsored by Industry Players
- 12.7.2. Non-Industry Players Focused on ALK Biomarker
- 12.7.2.1. Regional Distribution of ALK Biomarker Focused Clinical Trials Sponsored by Non-Industry Players
- 12.7.3. Industry Players Focused on AST Biomarker
- 12.7.3.1. Regional Distribution of AST Biomarker Focused Clinical Trials Sponsored by Industry Players
- 12.7.4. Non-Industry Players Focused on AST Biomarker
- 12.7.4.1. Regional Distribution of AST Biomarker Focused Clinical Trials Sponsored by Non-Industry Players
- 12.7.5. Industry Players Focused on EGFR Biomarker
- 12.7.5.1. Regional Distribution of EGFR Biomarker Focused Clinical Trials Sponsored by Industry Players
- 12.7.6. Non-Industry Players Focused on EGFR Biomarker
- 12.7.6.1. Regional Distribution of EGFR Biomarker Focused Clinical Trials Sponsored by Non-Industry Players
- 12.7.7. Industry Players Focused on PD-L1 Biomarker
- 12.7.7.1. Regional Distribution of PD-L1 Biomarker Focused Clinical Trials Sponsored by Industry Players
- 12.7.8. Non-Industry Players Focused on PD-L1 Biomarker
- 12.7.8.1. Regional Distribution of PD-L1 Biomarker Focused Clinical Trials Sponsored by Non-Industry Players
- 12.7.9. Industry Players Focused on RET Biomarker
- 12.7.9.1. Regional Distribution of RET Biomarker Focused Clinical Trials Sponsored by Industry Players
- 12.7.10. Non-Industry Players Focused on RET Biomarker
- 12.7.10.1. Regional Distribution of RET Biomarker Focused Clinical Trials Sponsored by Non-Industry Players
- 12.7.1. Industry Players Focused on ALK Biomarker
- 12.8. Likely Partners for Companion Diagnostics Service Providers: HIV
- 12.8.1. Industry Players Focused on CCR5 Biomarker
- 12.8.1.1. Regional Distribution of CCR5 Biomarker Focused Clinical Trials Sponsored by Industry Players
- 12.8.2. Non-Industry Players Focused on CCR5 Biomarker
- 12.8.2.1. Regional Distribution of CCR5 Biomarker Focused Clinical Trials Sponsored by Non-Industry Players
- 12.8.1. Industry Players Focused on CCR5 Biomarker
- 12.9. Likely Partners for Companion Diagnostics Service Providers: Ovarian Cancer
- 12.9.1. Industry Players Focused on BRCA Biomarker
- 12.9.1.1. Regional Distribution of BRCA Biomarker Focused Clinical Trials Sponsored by Industry Players
- 12.9.2. Non-Industry Players Focused on BRCA Biomarker
- 12.9.2.1. Regional Distribution of BRCA Biomarker Focused Clinical Trials Sponsored by Non-Industry Players
- 12.9.3. Industry Players Focused on CA-125 Biomarker
- 12.9.3.1. Regional Distribution of CA-125 Biomarker Focused Clinical Trials Sponsored by Industry Players
- 12.9.4. Non-Industry Players Focused on CA-125 Biomarker
- 12.9.4.1. Regional Distribution of CA-125 Biomarker Focused Clinical Trials Sponsored by Non-Industry Players
- 12.9.1. Industry Players Focused on BRCA Biomarker
- 12.10. Likely Partners for Companion Diagnostics Service Providers: Prostate Cancer
- 12.10.1. Industry Players Focused on AR-V7 Biomarker
- 12.10.1.1. Regional Distribution of AR-V7 Biomarker Focused Clinical Trials Sponsored by Industry Players
- 12.10.2. Non-Industry Players Focused on AR-V7 Biomarker
- 12.10.2.1. Regional Distribution of AR-V7 Biomarker Focused Clinical Trials Sponsored by Non-Industry Players
- 12.10.3. Industry Players Focused on PTEN Biomarker
- 12.10.3.1. Regional Distribution of PTEN Biomarker Focused Clinical Trials Sponsored by Industry Players
- 12.10.4. Non-Industry Players Focused on PTEN Biomarker
- 12.10.4.1. Regional Distribution of PTEN Biomarker Focused Clinical Trials Sponsored by Non-Industry Players
- 12.10.1. Industry Players Focused on AR-V7 Biomarker
13. MERGERS AND ACQUISITONS
- 13.1. Chapter Overview
- 13.2. Merger and Acquisition Models
- 13.3. Companion Diagnostic Development Service Providers: Mergers and Acquisitions
- 13.3.1. Analysis by Year of Deal
- 13.3.2. Analysis by Type of Deal
- 13.3.3. Analysis by Geography
- 13.3.3.1. Local and International Agreements
- 13.3.3.2. Intercontinental and Intracontinental Agreements
- 13.3.4. Ownership Change Matrix
- 13.3.5. Key Value Drivers of Acquisitions
- 13.3.6. Key Players: Analysis by Number of Mergers and Acquisitions
- 13.3.7. Key Acquisitions: Deal Multiples
14. STAKEHOLDER NEEDS ANALYSIS
- 14.1. Chapter Overview
- 14.2. Companion Diagnostics: Interests / Needs of Different Stakeholders
- 14.3. Comparison of Interests / Needs of Various Stakeholders
- 14.3.1. Interests / Needs of Drug Developers
- 14.3.2. Interests / Needs of Companion Diagnostics Developers
- 14.3.3. Interests / Needs of Regulatory Authorities
- 14.3.4. Interests / Needs of Testing Laboratories
- 14.3.5. Interests / Needs of Payers / Insurance Providers
- 14.3.6. Interests / Needs of Physicians
- 14.3.7. Interests / Needs of Patients
- 14.4. Overall Summary
15. VALUE CHAIN ANALYSIS
- 15.1. Chapter Overview
- 15.2. Companion Diagnostics Value Chain
- 15.3. Cost Distribution Across the Value Chain
- 15.3.1. Cost Associated with Research and Product Development
- 15.3.2. Cost Associated with Manufacturing and Assembly
- 15.3.3. Cost Associated with Clinical Trials, FDA Approval and Other Administrative Tasks
- 15.3.4. Cost Associated with Payer Negotiation and KOL Engagement
- 15.3.5. Cost Associated with Marketing and Sales
16. CLINICAL RESEARCH ON CANCER BIOMARKERS: BIG PHARMA INITIATIVES
- 16.1. Chapter Overview
- 16.2. Methodology
- 16.3. Clinical Trial Analysis
- 16.3.1. List of Likely Drug Candidates for IVD Developers
- 16.4. Cumulative Distribution of Biomarker-based Trials by Registration Year, Since 2016
- 16.4.1. Analysis of Biomarker-based Trials of Most Popular Biomarkers
- 16.4.2. Analysis of Biomarker-based Trials of Moderately Popular Biomarkers
- 16.4.3. Analysis of Biomarker-based Trials of Less Popular / Preliminary Stage Biomarkers
- 16.4.4. Word Cloud of Other Emerging Biomarkers
- 16.4.5. Cumulative Distribution of Trials by Registration Year and Most Popular Biomarkers
- 16.4.6. Cumulative Distribution of Trials by Registration Year and Moderately Popular Biomarkers
- 16.4.7. Cumulative Distribution of Trials by Registration Year and Less Popular Biomarkers
- 16.5. Distribution of Biomarker-based Trials by Most Popular Indications
- 16.5.1. Distribution of Biomarker-based Trials by Moderately Popular Indications
- 16.5.2. Distribution of Biomarker-based Trials by Less Popular Other Indications
- 16.5.3. Word Cloud of Other Emerging Indications in Biomarker-based Clinical Trials
- 16.5.4. Cumulative Distribution of Trials by Registration Year and Most Popular Indication
- 16.5.5. Cumulative Distribution of Trials by Registration Year and Moderately Popular Indications
- 16.5.6. Cumulative Distribution of Trials by Registration Year and Less Popular / Preliminary Stage Indications
- 16.6. Analysis of Biomarker-based Trials by Phase of Development
- 16.6.1. Analysis of Biomarker-based Trials by Phase of Development and Most Popular Biomarkers
- 16.6.2. Analysis of Biomarker-based Trials by Phase of Development and Moderately Popular Biomarkers
- 16.6.3. Analysis of Biomarker-based Trials by Phase of Development and Less Popular Other Biomarkers
- 16.6.4. Analysis of Biomarker-based Trials by Phase of Development and Most Popular Indications
- 16.6.5. Analysis of Biomarker-based Trials by Phase of Development and Moderately Popular Indications
- 16.6.6. Analysis of Biomarker-based Trials by Phase of Development and Less Popular Other Indications
- 16.7. Analysis of Biomarker-based Trials by Sponsor
- 16.7.1. Analysis of Biomarker-based Trials by Sponsor and Most Popular Biomarkers
- 16.7.2. Analysis of Biomarker-based Trials by Sponsor and Moderately Popular Biomarkers
- 16.7.3. Analysis of Biomarker-based Trials by Sponsor and Most Popular Indications
- 16.7.4. Analysis of Biomarker-based Trials by Sponsor and Moderately Popular Indications
- 16.8. Analysis of Biomarker-based Trials by Recruitment Status
- 16.9. Analysis of Biomarker-based Trials by Therapy Design
- 16.10. Analysis of Biomarker-based Trials by Geography
- 16.10.1. Analysis of Biomarker-based Trials by Trial Phase and Recruitment Status
- 16.11. Clinical Trials Summary: Analysis by Biomarker and Most Popular Indications
- 16.12. Clinical Trials Summary: Analysis by Biomarker and Moderately Popular Indications
- 16.13. Clinical Trials Summary: Analysis by Biomarker and Preliminary Stage Indications
17. CASE STUDY ON PRECISION MEDICINE SOFTWARE SOLUTIONS
- 17.1. Chapter Overview
- 17.2. Precision Medicine Software Solutions: List of Players
- 17.2.1. Analysis by Year of Establishment
- 17.2.2. Analysis by Company Size
- 17.2.3. Analysis by Location of Headquarters (Region)
- 17.2.4. Analysis by Company Size and Location of Headquarters (Region)
- 17.3. Precision Medicine Software Solutions: List of Software
- 17.3.1. Analysis by Status of Development
- 17.3.2. Analysis by Type of Platform
- 17.3.3. Analysis by Regulatory Accreditation Received
- 17.3.4. Analysis by Target Therapeutic Area
- 17.3.5. Analysis by Type of Data Handled
- 17.3.6. Analysis by Purpose of Software
- 17.3.7. Analysis by End-User
- 17.3.8. Most Active Players: Distribution by Number of Software
18. MARKET IMPACT ANALYSIS: DRIVERS, RESTRAINTS, OPPORTUNITIES AND CHALLENGES
- 18.1. Chapter Overview
- 18.2. Market Drivers
- 18.3. Market Restraints
- 18.4. Market Opportunities
- 18.5. Market Challenges
- 18.6. Conclusion
19. GLOBAL COMPANION DIAGNOSTICS DEVELOPMENT SERVICES MARKET
- 19.1. Chapter Overview
- 19.2. Key Assumptions and Methodology
- 19.3. Global Companion Diagnostics Development Services Market, Historical Trends (Since 2019) and Forecasted Estimates (Till 2035)
- 19.3.1. Scenario Analysis
- 19.3.1.1. Conservative Scenario
- 19.3.1.2. Optimistic Scenario
- 19.3.1. Scenario Analysis
- 19.4. Key Market Segmentations
20. COMPANION DIAGNOSTICS DEVELOPMENT SERVICES MARKET, BY TYPE OF SERVICE OFFERED
- 20.1. Chapter Overview
- 20.2. Key Assumptions and Methodology
- 20.3. Feasibility Studies: Historical Trends (Since 2019) and Forecasted Estimates (Till 2035)
- 20.4. Assay Development: Historical Trends (Since 2019) and Forecasted Estimates (Till 2035)
- 20.5. Analytical Validation: Historical Trends (Since 2019) and Forecasted Estimates (Till 2035)
- 20.6. Clinical Validation: Historical Trends (Since 2019) and Forecasted Estimates (Till 2035)
- 20.7. Manufacturing: Historical Trends (Since 2019) and Forecasted Estimates (Till 2035)
- 20.8. Data Triangulation and Validation
21. COMPANION DIAGNOSTICS DEVELOPMENT SERVICES MARKET, BY TYPE OF ANALYTICAL TECHNIQUE USED
- 21.1. Chapter Overview
- 21.2. Key Assumptions and Methodology
- 21.3. NGS: Historical Trends (Since 2019) and Forecasted Estimates (Till 2035)
- 21.4. PCR: Historical Trends (Since 2019) and Forecasted Estimates (Till 2035)
- 21.5. IHC: Historical Trends (Since 2019) and Forecasted Estimates (Till 2035)
- 21.6. Flow Cytometry: Historical Trends (Since 2019) and Forecasted Estimates (Till 2035)
- 21.7. Other Analytical Techniques: Historical Trends (Since 2019) and Forecasted Estimates (Till 2035)
- 21.8. Data Triangulation and Validation
22. COMPANION DIAGNOSTICS DEVELOPMENT SERVICES MARKET, BY TARGET THERAPEUTIC AREA
- 22.1. Chapter Overview
- 22.2. Key Assumptions and Methodology
- 22.3. Oncological Disorders: Historical Trends (Since 2019) and Forecasted Estimates (Till 2035)
- 22.4. Non-oncological Disorders: Historical Trends (Since 2019) and Forecasted Estimates (Till 2035)
- 22.5. Data Triangulation and Validation
23. COMPANION DIAGNOSTICS DEVELOPMENT SERVICES MARKET, BY END USER
- 23.1. Chapter Overview
- 23.2. Key Assumptions and Methodology
- 23.3. Industry Players: Historical Trends (Since 2019) and Forecasted Estimates (Till 2035)
- 23.4. Non-Industry Players: Historical Trends (Since 2019) and Forecasted Estimates (Till 2035)
- 23.5. Data Triangulation and Validation
24. COMPANION DIAGNOSTICS DEVELOPMENT SERVICES MARKET, BY KEY GEOGRAPHICAL REGIONS
- 24.1. Chapter Overview
- 24.2. Key Assumptions and Methodology
- 24.3. North America: Historical Trends (Since 2019) and Forecasted Estimates (Till 2035)
- 24.3.1. US: Historical Trends (Since 2019) and Future Estimates (Till 2035)
- 24.3.2. Canada: Historical Trends (Since 2019) and Future Estimates (Till 2035)
- 24.4. Europe: Historical Trends (Since 2019) and Forecasted Estimates (Till 2035)
- 24.4.1. Germany: Historical Trends (Since 2019) and Future Estimates (Till 2035)
- 24.4.2. UK: Historical Trends (Since 2019) and Future Estimates (Till 2035)
- 24.4.3. Belgium: Historical Trends (Since 2019) and Future Estimates (Till 2035)
- 24.4.4. Switzerland: Historical Trends (Since 2019) and Future Estimates (Till 2035)
- 24.4.5. Other European Countries: Historical Trends (Since 2019) and Future Estimates (Till 2035)
- 24.5. Asia-Pacific: Historical Trends (Since 2019) and Forecasted Estimates (Till 2035)
- 24.5.1. China: Historical Trends (Since 2019) and Future Estimates (Till 2035)
- 24.5.2. Other Asia-Pacific Countries: Historical Trends (Since 2019) and Future Estimates (Till 2035)
- 24.6. Data Triangulation and Validation
25. CONCLUDING REMARKS
26. EXECUTIVE INSIGHTS
- 26.1. Chapter Overview
- 26.2. Apollo Hospital Educational and Research Foundation, and Urvogelbio
- 26.2.1. Company Snapshot
- 26.2.2. Interview Transcript: M.V. Sasidhar, Chief Scientific Officer (Apollo Hospital Educational and Research Foundation) and Founder (Urvogelbio)
- 26.3. MEDICAL & BIOLOGICAL LABORATORIES
- 26.3.1. Company Snapshot
- 26.3.2. Interview Transcript: Keita Takahashi (Manager of Sales and Marketing Division), Kyoko Fukushima (Manager of Companion Diagnostic Development Services) and Kyo Shirai (Sales and Marketing Division)
- 26.4. Genomenon
- 26.4.1. Company Snapshot
- 26.4.2. Interview Transcript: Mike Klein, Chief Executive Officer; Mark Kiel, Founder and Chief Scientific Officer; and Candace Chapman, Vice President of Marketing
- 26.5. Tymora Analytical Operations
- 26.5.1. Company Snapshot
- 26.5.2. Interview Transcript: Anton Iliuk, President and Chief Technology Officer
- 26.6. Novodiax
- 26.6.1. Company Snapshot
- 26.6.2. Interview Transcript: Paul Kortschak, Former Senior Vice President
- 26.7. OWL Metabolomics
- 26.7.1. Company Snapshot
- 26.7.2. Interview Transcript: Pablo Ortiz, Chief Executive Officer
- 26.8. NeoGenomics Laboratories
- 26.8.1. Company Snapshot
- 26.8.2. Interview Transcript: Lawrence M. Weiss, Former Chief Scientific Officer
27. APPENDIX 1: TABULATED DATA
28. APPENDIX 2: LIST OF COMPANIES AND ORGANIZATIONS
List of Tables
- Table 6.1 Companion Diagnostics Service Providers: List of Players
- Table 6.2 Companion Diagnostics Development Service Providers: Information on Type of Services Offered
- Table 6.3 Companion Diagnostics Development Service Providers: Information on Type of Affiliated Services Offered and AI Support
- Table 6.4 Companion Diagnostics Development Service Providers: Information on Analytical Techniques Used
- Table 6.5 Companion Diagnostics Development Service Providers: Information on Target Therapeutic Area
- Table 6.6 Companion Diagnostics Development Service Providers: Information on Regulatory Certifications / Accreditations
- Table 8.1 Companion Diagnostic Development Service Providers: List of Companies Profiled
- Table 8.2 Geneuity Clinical Research Services: Company Overview
- Table 8.3 Geneuity Clinical Research Services: Service Portfolio
- Table 8.4 Labcorp: Company Overview
- Table 8.5 Labcorp: Service Portfolio
- Table 8.6 Labcorp: Recent Developments and Future Outlook
- Table 8.7 Q2 Solutions: Company Overview
- Table 8.8 Q2 Solutions: Service Portfolio
- Table 8.9 Quest Diagnostics: Company Overview
- Table 8.10 Quest Diagnostics: Service Portfolio
- Table 8.11 Quest Diagnostics: Recent Developments and Future Outlook
- Table 8.12 ResearchDx: Company Overview
- Table 8.13 ResearchDx: Service Portfolio
- Table 8.14 ResearchDx: Recent Developments and Future Outlook
- Table 8.15 Almac Diagnostic Services: Company Overview
- Table 8.16 Almac Diagnostic Services: Service Portfolio
- Table 8.17 Almac Diagnostic Services: Recent Developments and Future Outlook
- Table 8.18 Eurofins: Company Overview
- Table 8.19 Eurofins: Service Portfolio
- Table 8.20 QIAGEN: Company Overview
- Table 8.21 QIAGEN: Service Portfolio
- Table 8.22 QIAGEN: Recent Developments and Future Outlook
- Table 8.23 BGI Genomics: Company Overview
- Table 8.24 BGI Genomics: Service Portfolio
- Table 8.25 MEDICAL & BIOLOGICAL LABORATORIES: Company Overview
- Table 8.26 MEDICAL & BIOLOGICAL LABORATORIES: Service Portfolio
- Table 9.1 Companion Diagnostic Development Service Providers: List of Companies Profiled
- Table 9.2 Agilent Technologies: Company Overview
- Table 9.3 Agilent Technologies: Service Portfolio
- Table 9.4 Creative Biolabs: Company Overview
- Table 9.5 Creative Biolabs: Service Portfolio
- Table 9.6 ICON Specialty Laboratories: Company Overview
- Table 9.7 ICON Specialty Laboratories: Service Portfolio
- Table 9.8 NeoGenomics Laboratories: Company Overview
- Table 9.9 NeoGenomics Laboratories: Service Portfolio
- Table 9.10 Cerba Research: Company Overview
- Table 9.11 Cerba Research: Service Portfolio
- Table 9.12 Randox Biosciences: Company Overview
- Table 9.13 Randox Biosciences: Service Portfolio
- Table 9.14 Roche: Company Overview
- Table 9.15 Roche: Service Portfolio
- Table 9.16 Siemens Healthineers: Company Overview
- Table 9.17 Siemens Healthineers: Service Portfolio
- Table 9.18 Unilabs: Company Overview
- Table 9.19 Unilabs: Service Portfolio
- Table 9.20 Abnova: Company Overview
- Table 9.21 Abnova: Service Portfolio
- Table 9.22 Celemics: Company Overview
- Table 9.23 Celemics: Service Portfolio
- Table 9.24 MEDx Translational Medicine: Company Overview
- Table 9.25 MEDx Translational Medicine: Service Portfolio
- Table 9.26 Novogene: Company Overview
- Table 9.27 Novogene: Service Portfolio
- Table 9.28 Shuwen Biotech: Company Overview
- Table 9.29 Shuwen Biotech: Service Portfolio
- Table 10.1 Companion Diagnostics: Information on Developer, Sample Used, Type of Biomarker, Analytical Technique Used, Target Disease Indication and Target Therapeutic Area
- Table 10.2 Companion Diagnostics: Information on Developer, Commercial Availability, FDA Approval Year, Other Regulatory Approval Year, Companion Drug (Generic Name)
- Table 10.3 Companion Diagnostics: List of Developers
- Table 11.1 Companion Diagnostics Development Service Providers: List of Partnerships and Collaborations, Since 2021
- Table 12.1 Industry Players Focused on Amyloid Beta Biomarker: Potential Partners for Companion Diagnostic Service Providers
- Table 12.2 Non-Industry Players Focused on Amyloid Beta Biomarker: Potential Partners for Companion Diagnostic Service Providers
- Table 12.3 Industry Players Focused on Tau Biomarker: Potential Partners for Companion Diagnostic Service Providers
- Table 12.4 Non-Industry Players Focused on Tau Biomarker: Potential Partners for Companion Diagnostic Service Providers
- Table 12.5 Industry Players Focused on BRCA Biomarker: Potential Partners for Companion Diagnostic Service Providers
- Table 12.6 Non-Industry Players Focused on BRCA Biomarker: Potential Partners for Companion Diagnostic Service Providers
- Table 12.7 Industry Players Focused on HER Biomarker: Potential Partners for Companion Diagnostic Service Providers
- Table 12.8 Non-Industry Players Focused on HER Biomarker: Potential Partners for Companion Diagnostic Service Providers
- Table 12.9 Industry Players Focused on PD-L1 Biomarker: Potential Partners for Companion Diagnostic Service Providers
- Table 12.10 Non-Industry Players Focused on PD-L1 Biomarker: Potential Partners for Companion Diagnostic Service Providers
- Table 12.11 Industry Players Focused on HR Biomarker: Potential Partners for Companion Diagnostic Service Providers
- Table 12.12 Non-Industry Players Focused on HR Biomarker: Potential Partners for Companion Diagnostic Service Providers
- Table 12.13 Industry Players Focused on BRAF Biomarker: Potential Partners for Companion Diagnostic Service Providers
- Table 12.14 Non-Industry Players Focused on BRAF Biomarker: Potential Partners for Companion Diagnostic Service Providers
- Table 12.15 Industry Players Focused on EGFR Biomarker: Potential Partners for Companion Diagnostic Service Providers
- Table 12.16 Non-Industry Players Focused on EGFR Biomarker: Potential Partners for Companion Diagnostic Service Providers
- Table 12.17 Industry Players Focused on KRAS Biomarker: Potential Partners for Companion Diagnostic Service Providers
- Table 12.18 Non-Industry Players Focused on KRAS Biomarker: Potential Partners for Companion Diagnostic Service Providers
- Table 12.19 Industry Players Focused on MSI / dMMR Biomarker: Potential Partners for Companion Diagnostic Service Providers
- Table 12.20 Non-Industry Players Focused on MSI / dMMR Biomarker: Potential Partners for Companion Diagnostic Service Providers
- Table 12.21 Industry Players Focused on ALK Biomarker: Potential Partners for Companion Diagnostic Service Providers
- Table 12.22 Non-Industry Players Focused on ALK Biomarker: Potential Partners for Companion Diagnostic Service Providers
- Table 12.23 Industry Players Focused on AST Biomarker: Potential Partners for Companion Diagnostic Service Providers
- Table 12.24 Non-Industry Players Focused on AST Biomarker: Potential Partners for Companion Diagnostic Service Providers
- Table 12.25 Industry Players Focused on EGFR Biomarker: Potential Partners for Companion Diagnostic Service Providers
- Table 12.26 Non-Industry Players Focused on EGFR Biomarker: Potential Partners for Companion Diagnostic Service Providers
- Table 12.27 Industry Players Focused on PD-L1 Biomarker: Potential Partners for Companion Diagnostic Service Providers
- Table 12.28 Non-Industry Players Focused on PD-L1 Biomarker: Potential Partners for Companion Diagnostic Service Providers
- Table 12.29 Industry Players Focused on RET Biomarker: Potential Partners for Companion Diagnostic Service Providers
- Table 12.30 Non-Industry Players Focused on RET Biomarker: Potential Partners for Companion Diagnostic Service Providers
- Table 12.31 Industry Players Focused on CCR5 Biomarker: Potential Partners for Companion Diagnostic Service Providers
- Table 12.32 Non-Industry Players Focused on CCR5 Biomarker: Potential Partners for Companion Diagnostic Service Providers
- Table 12.33 Industry Players Focused on BRCA Biomarker: Potential Partners for Companion Diagnostic Service Providers
- Table 12.34 Non-Industry Players Focused on BRCA Biomarker: Potential Partners for Companion Diagnostic Service Providers
- Table 12.35 Industry Players Focused on CA-125 Biomarker: Potential Partners for Companion Diagnostic Service Providers
- Table 12.36 Non-Industry Players Focused on CA-125 Biomarker: Potential Partners for Companion Diagnostic Service Providers
- Table 12.37 Industry Players Focused on AR-V7 Biomarker: Potential Partners for Companion Diagnostic Service Providers
- Table 12.38 Non-Industry Players Focused on AR-V7 Biomarker: Potential Partners for Companion Diagnostic Service Providers
- Table 12.39 Industry Players Focused on PTEN Biomarker: Potential Partners for Companion Diagnostic Service Providers
- Table 12.40 Non-Industry Players Focused on PTEN Biomarker: Potential Partners for Companion Diagnostic Service Providers
- Table 13.1 Companion Diagnostic Development Services: List of Mergers and Acquisitions, Since 2017
- Table 13.2 Acquisitions: Key Value Drivers
- Table 13.3 Key Acquisitions: Deal Multiples
- Table 14.1 Comparison of Relevance of Interests / Needs of Stakeholders
- Table 16.1 List of Likely Drug Candidates / Potential Collaborators for Diagnostic Developers
- Table 16.2 List of Biomarkers across Moderately Popular Indications
- Table 16.3 List of Biomarkers Across Emerging Indications
- Table 17.1 Precision Medicine Software Developers: Information on Year of Establishment, Company Size and Location of Headquarters
- Table 17.2 Precision Medicine Software: Information on Software, Developer, AI Integration, Type of Platform, Regulatory Accreditation and Status of Development
- Table 17.3 Precision Medicine Software: Information on Target Therapeutic Area, Purpose of Software and End-User
- Table 26.1 Apollo Hospital Educational and Research Foundation, and Urvogelbio: Company Snapshot
- Table 26.2 MEDICAL & BIOLOGICAL LABORATORIES: Company Snapshot
- Table 26.3 Genomenon: Company Snapshot
- Table 26.4 Tymora Analytical Operations: Company Snapshot
- Table 26.5 Novodiax: Company Snapshot
- Table 26.6 OWL Metabolomics: Company Snapshot
- Table 26.7 NeoGenomics Laboratories: Company Snapshot
- Table 27.1 Companion Diagnostics Development Service Providers: Distribution by Year of Establishment
- Table 27.2 Companion Diagnostics Development Service Providers: Distribution by Company Size
- Table 27.3 Companion Diagnostics Development Service Providers: Distribution by Location of Headquarters
- Table 27.4 Companion Diagnostics Development Service Providers: Distribution by Company Size and Location of Headquarters (Region)
- Table 27.5 Companion Diagnostics Development Service Providers: Distribution by Company Ownership
- Table 27.6 Companion Diagnostics Development Service Providers: Distribution by Type of Services Offered
- Table 27.7 Companion Diagnostics Development Service Providers: Distribution by Type of Affiliated Services Offered
- Table 27.8 Companion Diagnostics Development Service Providers: Distribution by AI Support
- Table 27.9 Companion Diagnostics Development Service Providers: Distribution by Analytical Techniques Used
- Table 27.10 Companion Diagnostics Development Service Providers: Distribution by Target Therapeutic Area
- Table 27.11 Companion Diagnostics Development Service Providers: Distribution by Regulatory Accreditations / Certifications
- Table 27.12 Companion Diagnostics: Distribution by Type of Sample Used
- Table 27.13 Companion Diagnostics: Distribution by Type of Biomarker Detected
- Table 27.14 Companion Diagnostics: Distribution by Analytical Technique Used
- Table 27.15 Companion Diagnostics: Distribution by Target Disease Indication
- Table 27.16 Companion Diagnostics: Distribution by Target Therapeutic Area
- Table 27.17 Companion Diagnostics: Distribution by Commercial Availability and Target Therapeutic Area
- Table 27.18 Companion Diagnostics: Distribution by Year of FDA Approval
- Table 27.19 Companion Diagnostics: Distribution by Year of Other Regulatory Approval
- Table 27.20 Companion Diagnostics: Distribution of Regulatory Authority Involved
- Table 27.21 Companion Diagnostics: Most Popular Companion Drugs
- Table 27.22 Companion Diagnostics Developers: Distribution by Year of Establishment
- Table 27.23 Companion Diagnostics Developers: Distribution by Company Size
- Table 27.24 Companion Diagnostics Developers: Distribution by Location of Headquarters
- Table 27.25 Companion Diagnostic Developers: Distribution by Company Ownership
- Table 27.26 Most Active Players: Distribution by Number of Marketed Products
- Table 27.27 Partnerships and Collaborations: Cumulative Year-wise Trend, Since 2017
- Table 27.28 Partnerships and Collaborations: Distribution by Type of Partnership
- Table 27.29 Partnerships and Collaborations: Distribution by Year and Type of Partnership, Since 2021
- Table 27.30 Partnerships and Collaborations: Distribution by Type of Technology
- Table 27.31 Partnerships and Collaborations: Distribution by Target Therapeutic Area
- Table 27.32 Partnerships and Collaborations: Distribution by Type of Partner
- Table 27.33 Partnerships and Collaborations: Distribution by Year of Partnership and Type of Partner
- Table 27.34 Most Active Players: Distribution by Number for Partnerships
- Table 27.35 Partnerships and Collaborations: Local and International Agreements
- Table 27.36 Partnerships and Collaborations: Intercontinental and Intracontinental Agreements
- Table 27.37 Likely Partner Analysis: Distribution of Industry Players Focused on Amyloid Beta Biomarker by Likelihood of Partnership
- Table 27.38 Regional Distribution of Amyloid Beta Biomarker Focused Clinical Trials Sponsored by Industry Players
- Table 27.39 Likely Partner Analysis: Distribution of Non-Industry Players Focused on Amyloid Beta Biomarkers by Likelihood of Partnership
- Table 27.40 Regional Distribution of Amyloid Beta Biomarker Focused Clinical Trials Sponsored by Non-Industry Players
- Table 27.41 Likely Partner Analysis: Distribution of Industry Players Focused on Tau Biomarker by Likelihood of Partnership
- Table 27.42 Regional Distribution of Tau Biomarker Focused Clinical Trials Sponsored by Industry Players
- Table 27.43 Likely Partner Analysis: Distribution of Non-Industry Players Focused on Tau Biomarker by Likelihood of Partnership
- Table 27.44 Regional Distribution of Tau Biomarker Focused Clinical Trials Sponsored by Non-Industry Players
- Table 27.45 Likely Partner Analysis: Distribution of Industry Players Focused on BRCA Biomarker by Likelihood of Partnership
- Table 27.46 Regional Distribution of BRCA Biomarker Focused Clinical Trials Sponsored by Industry Players
- Table 27.47 Likely Partner Analysis: Distribution of Non-Industry Players Focused on BRCA Biomarker by Likelihood of Partnership
- Table 27.48 Regional Distribution of BRCA Biomarker Focused Clinical Trials Sponsored by Non-Industry Players
- Table 27.49 Likely Partner Analysis: Distribution of Industry Players Focused on HER Biomarker by Likelihood of Partnership
- Table 27.50 Regional Distribution of HER Biomarker Focused Clinical Trials Sponsored by Industry Players
- Table 27.51 Likely Partner Analysis: Distribution of Non-Industry Players Focused on HER Biomarker by Likelihood of Partnership
- Table 27.52 Regional Distribution of HER Biomarker Focused Clinical Trials Sponsored by Non-Industry Players
- Table 27.53 Likely Partner Analysis: Distribution of Industry Players Focused on PD-L1 Biomarker by Likelihood of Partnership
- Table 27.54 Regional Distribution of PD-L1 Biomarker Focused Clinical Trials Sponsored by Industry Players
- Table 27.55 Likely Partner Analysis: Distribution of Non-Industry Players Focused on PD-L1 Biomarker by Likelihood of Partnership
- Table 27.56 Regional Distribution of PD-L1 Biomarker Focused Clinical Trials Sponsored by Non-Industry Players
- Table 27.57 Likely Partner Analysis: Distribution of Industry Players Focused on HR Biomarker by Likelihood of Partnership
- Table 27.58 Regional Distribution of HR Biomarker Focused Clinical Trials Sponsored by Industry Players
- Table 27.59 Likely Partner Analysis: Distribution of Non-Industry Players Focused on HR Biomarker by Likelihood of Partnership
- Table 27.60 Regional Distribution of HR Biomarker Focused Clinical Trials Sponsored by Non-Industry Players
- Table 27.61 Likely Partner Analysis: Distribution of Industry Players Focused on BRAF Biomarker by Likelihood of Partnership
- Table 27.62 Regional Distribution of BRAF Biomarker Focused Clinical Trials Sponsored by Industry Players
- Table 27.63 Likely Partner Analysis: Distribution of Non-Industry Players Focused on BRAF Biomarker by Likelihood of Partnership
- Table 27.64 Regional Distribution of BRAF Biomarker Focused Clinical Trials Sponsored by Non-Industry Players
- Table 27.65 Likely Partner Analysis: Distribution of Industry Players Focused on EGFR Biomarker by Likelihood of Partnership
- Table 27.66 Regional Distribution of EGFR Biomarker Focused Clinical Trials Sponsored by Industry Players
- Table 27.67 Likely Partner Analysis: Distribution of Non-Industry Players Focused on EGFR Biomarker by Likelihood of Partnership
- Table 27.68 Regional Distribution of EGFR Biomarker Focused Clinical Trials Sponsored by Non-Industry Players
- Table 27.69 Likely Partner Analysis: Distribution of Industry Players Focused on KRAS Biomarker by Likelihood of Partnership
- Table 27.70 Regional Distribution of KRAS Biomarker Focused Clinical Trials Sponsored by Industry Players
- Table 27.71 Likely Partner Analysis: Distribution of Non-Industry Players Focused on KRAS Biomarker by Likelihood of Partnership
- Table 27.72 Regional Distribution of KRAS Biomarker Focused Clinical Trials Sponsored by Non-Industry Players
- Table 27.73 Likely Partner Analysis: Distribution of Industry Players Focused on MSI / dMMR Biomarker by Likelihood of Partnership
- Table 27.74 Regional Distribution of MSI / dMMR Biomarker Focused Clinical Trials Sponsored by Industry Players
- Table 27.75 Likely Partner Analysis: Distribution of Industry Players Focused on ALK Biomarker by Likelihood of Partnership
- Table 27.76 Regional Distribution of ALK Biomarker Focused Clinical Trials Sponsored by Industry Players
- Table 27.77 Likely Partner Analysis: Distribution of Non-Industry Players Focused on ALK Biomarker by Likelihood of Partnership
- Table 27.78 Regional Distribution of ALK Biomarker Focused Clinical Trials Sponsored by Non-Industry Players
- Table 27.79 Likely Partner Analysis: Distribution of Industry Players Focused on AST Biomarker by Likelihood of Partnership
- Table 27.80 Regional Distribution of AST Biomarker Focused Clinical Trials Sponsored by Industry Players
- Table 27.81 Likely Partner Analysis: Distribution of Non-Industry Players Focused on AST Biomarker by Likelihood of Partnership
- Table 27.82 Regional Distribution of AST Biomarker Focused Clinical Trials Sponsored by Non-Industry Players
- Table 27.83 Likely Partner Analysis: Distribution of Industry Players Focused on EGFR Biomarker by Likelihood of Partnership
- Table 27.84 Regional Distribution of EGFR Biomarker Focused Clinical Trials Sponsored by Industry Players
- Table 27.85 Likely Partner Analysis: Distribution of Non-Industry Players Focused on EGFR Biomarker by Likelihood of Partnership
- Table 27.86 Regional Distribution of EGFR Biomarker Focused Clinical Trials Sponsored by Non-Industry Players
- Table 27.87 Likely Partner Analysis: Distribution of Industry Players Focused on PD-L1 Biomarker by Likelihood of Partnership
- Table 27.88 Regional Distribution of PD-L1 Biomarker Focused Clinical Trials Sponsored by Industry Players
- Table 27.89 Likely Partner Analysis: Distribution of Non-Industry Players Focused on PD-L1 Biomarker by Likelihood of Partnership
- Table 27.90 Regional Distribution of PD-L1 Biomarker Focused Clinical Trials Sponsored by Non-Industry Players
- Table 27.91 Likely Partner Analysis: Distribution of Non-Industry Players Focused on RET Biomarker by Likelihood of Partnership
- Table 27.92 Regional Distribution of RET Biomarker Focused Clinical Trials Sponsored by Non-Industry Players
- Table 27.93 Likely Partner Analysis: Distribution of Industry Players Focused on CCR5 Biomarker by Likelihood of Partnership
- Table 27.94 Regional Distribution of CCR5 Biomarker Focused Clinical Trials Sponsored by Industry Players
- Table 27.95 Likely Partner Analysis: Distribution of Non-Industry Players Focused on CCR5 Biomarker by Likelihood of Partnership
- Table 27.96 Regional Distribution of CCR5 Biomarker Focused Clinical Trials Sponsored by Non-Industry Players
- Table 27.97 Likely Partner Analysis: Distribution of Industry Players Focused on BRCA Biomarker by Likelihood of Partnership
- Table 27.98 Regional Distribution of BRCA Biomarker Focused Clinical Trials Sponsored by Industry Players
- Table 27.99 Likely Partner Analysis: Distribution of Non-Industry Players Focused on BRCA Biomarker by Likelihood of Partnership
- Table 27.100 Regional Distribution of BRCA Biomarker Focused Clinical Trials Sponsored by Non-Industry Players
- Table 27.101 Likely Partner Analysis: Distribution of Industry Players Focused on CA-125 Biomarker by Likelihood of Partnership
- Table 27.102 Regional Distribution of CA-125 Biomarker Focused Clinical Trials Sponsored by Industry Players
- Table 27.103 Likely Partner Analysis: Distribution of Non-Industry Players Focused on CA-125 Biomarker by Likelihood of Partnership
- Table 27.104 Regional Distribution of CA-125 Biomarker Focused Clinical Trials Sponsored by Non-Industry Players
- Table 27.105 Likely Partner Analysis: Distribution of Industry Players Focused on AR-V7 Biomarker by Likelihood of Partnership
- Table 27.106 Regional Distribution of AR-V7 Biomarker Focused Clinical Trials Sponsored by Industry Players
- Table 27.107 Regional Distribution of AR-V7 Biomarker Focused Clinical Trials Sponsored by Non-Industry Players
- Table 27.108 Likely Partner Analysis: Distribution of Industry Players Focused on PTEN Biomarker by Likelihood of Partnership
- Table 27.109 Regional Distribution of PTEN Biomarker Focused Clinical Trials Sponsored by Industry Players
- Table 27.110 Likely Partner Analysis: Distribution of Non-Industry Players Focused on PTEN Biomarker by Likelihood of Partnership
- Table 27.111 Regional Distribution of PTEN Biomarker Focused Clinical Trials Sponsored by Non-Industry Players
- Table 27.112 Mergers and Acquisitions: Cumulative Year-Wise Trend, Since 2017
- Table 27.113 Mergers and Acquisitions: Distribution by Type of Deal
- Table 27.114 Mergers and Acquisitions: Local and International Agreements
- Table 27.115 Mergers and Acquisitions: Intercontinental and Intracontinental Agreements
- Table 27.116 Acquisitions: Ownership Change Matrix
- Table 27.117 Acquisitions: Distribution by Key Value Drivers
- Table 27.118 Key Players: Distribution by Number of Mergers and Acquisitions
- Table 27.119 Clinical Trial Analysis: Distribution by Trial Registration Year
- Table 27.120 Clinical Trial Analysis: Distribution of Trials of the Most Popular Biomarkers by Trial Registration Year
- Table 27.121 Clinical Trial Analysis: Distribution of Trials of the Moderately Popular Biomarkers by Trials Registration Year
- Table 27.122 Clinical Trial Analysis: Distribution of Trials of the Less Popular and Other Biomarkers by Trial Registration Year
- Table 27.123 Clinical Trial Analysis: Distribution of Trial of the Most Popular Indications by Trial Registration Year
- Table 27.124 Clinical Trial Analysis: Distribution of Trial of the Moderately Popular Indications by Trial Registration Year
- Table 27.125 Clinical Trial Analysis: Distribution of Trial of the Less Popular and Other Indications by Trial Registration Year
- Table 27.126 Clinical Trial Analysis: Distribution by Trial Phase of Development
- Table 27.127 Clinical Trial Analysis: Distribution of Trials of the Most Popular Biomarkers by Phase of Development
- Table 27.128 Clinical Trial Analysis: Distribution of Trials of the Moderately Popular Biomarkers by Phase of Development
- Table 27.129 Clinical Trial Analysis: Distribution of Trials of the Less Popular and Other Biomarkers by Phase of Development
- Table 27.130 Clinical Trial Analysis: Distribution of Trials of the Most Popular Indications by Phase of Development
- Table 27.131 Clinical Trial Analysis: Distribution of Trials of the Moderately Popular Indications by Phase of Development
- Table 27.132 Clinical Trial Analysis: Distribution of Trials of the Less Popular / Emerging Indications by Phase of Development
- Table 27.133 Clinical Trial Analysis: Distribution of Trials by Sponsor
- Table 27.134 Clinical Trial Analysis: Distribution of Trials by Recruitment Status
- Table 27.135 Clinical Trial Analysis: Distribution of Trials by Therapy Design
- Table 27.136 Precision Medicine Software Developers: Distribution by Year of Establishment
- Table 27.137 Precision Medicine Software Developers: Distribution by Company Size
- Table 27.138 Precision Medicine Software Developers: Distribution by Location of Headquarters (Region)
- Table 27.139 Precision Medicine Software Developers: Distribution by Location of Headquarters
- Table 27.140 Precision Medicine Software Developers: Distribution by Company Size and Location of Headquarters (Region)
- Table 27.141 Precision Medicine Software: Distribution by Status of Development
- Table 27.142 Precision Medicine Software: Distribution by Status of Development and Location of Developer
- Table 27.143 Precision Medicine Software Developers: Distribution by Type of Platform
- Table 27.144 Precision Medicine Software: Distribution by Regulatory Accreditation Received
- Table 27.145 Precision Medicine Software: Distribution by Target Therapeutic Area
- Table 27.146 Precision Medicine Software: Distribution by Status of Development and Target Therapeutic Area
- Table 27.147 Precision Medicine Software: Distribution by Type of Data Handled
- Table 27.148 Precision Medicine Software: Distribution by Status of Development and Type of Data Handled
- Table 27.149 Precision Medicine Software: Distribution by Type of Data Handled and Target Therapeutic Area
- Table 27.150 Precision Medicine Software: Distribution by Purpose of Software
- Table 27.151 Precision Medicine Software: Distribution by Type of End-User
- Table 27.152 Global Companion Diagnostic Development Services Market, Historical Trends (Since 2019) (USD Billion)
- Table 27.153 Global Companion Diagnostic Development Services Market, Forecasted Estimates (Till 2035): Conservative, Base and Optimistic Scenarios (USD Billion)
- Table 27.154 Companion Diagnostic Development Services Market: Distribution by Type of Service Offered
- Table 27.155 Companion Diagnostic Development Services Market for Feasibility Studies, Historical Trends (Since 2019) (USD Million)
- Table 27.156 Companion Diagnostic Development Services Market for Feasibility Studies, Forecasted Estimates (Till 2035), Conservative, Base and Optimistic Scenarios (USD Million)
- Table 27.157 Companion Diagnostic Development Services Market for Assay Development, Historical Trends (Since 2019) (USD Million)
- Table 27.158 Companion Diagnostic Development Services Market for Assay Development, Forecasted Estimates (Till 2035), Conservative, Base and Optimistic Scenarios (USD Million)
- Table 27.159 Companion Diagnostic Development Services Market for Analytical Validation, Historical Trends (Since 2019) (USD Million)
- Table 27.160 Companion Diagnostic Development Services Market for Analytical Validation, Forecasted Estimates (Till 2035), Conservative, Base and Optimistic Scenarios (USD Million)
- Table 27.161 Companion Diagnostic Development Services Market for Clinical Validation, Historical Trends (Since 2019) (USD Million)
- Table 27.162 Companion Diagnostic Development Services Market for Clinical Validation, Forecasted Estimates (Till 2035), Conservative, Base and Optimistic Scenarios (USD Million)
- Table 27.163 Companion Diagnostic Development Services Market for Manufacturing, Historical Trends (Since 2019) (USD Million)
- Table 27.164 Companion Diagnostic Development Services Market for Manufacturing, Forecasted Estimates (Till 2035), Conservative, Base and Optimistic Scenarios (USD Million)
- Table 27.165 Companion Diagnostic Development Services Market: Distribution by Analytical Technique Used
- Table 27.166 Companion Diagnostic Development Services Market for NGS, Historical Trends (Since 2019) (USD Million)
- Table 27.167 Companion Diagnostic Development Services Market for NGS, Forecasted Estimates (Till 2035), Conservative, Base and Optimistic Scenarios (USD Million)
- Table 27.168 Companion Diagnostic Development Services Market for PCR, Historical Trends (Since 2019) (USD Million)
- Table 27.169 Companion Diagnostic Development Services Market for PCR, Forecasted Estimates (Till 2035), Conservative, Base and Optimistic Scenarios (USD Million)
- Table 27.170 Companion Diagnostic Development Services Market for IHC, Historical Trends (Since 2019) (USD Million)
- Table 27.171 Companion Diagnostic Development Services Market for IHC, Forecasted Estimates (Till 2035), Conservative, Base and Optimistic Scenarios (USD Million)
- Table 27.172 Companion Diagnostic Development Services Market for Flow Cytometry, Historical Trends (Since 2019) (USD Million)
- Table 27.173 Companion Diagnostic Development Services Market for Flow Cytometry, Forecasted Estimates (Till 2035), Conservative, Base and Optimistic Scenarios (USD Million)
- Table 27.174 Companion Diagnostic Development Services Market for Other Analytical Techniques, Historical Trends (Since 2019) (USD Million)
- Table 27.175 Companion Diagnostic Development Services Market for Other Analytical Techniques, Forecasted Estimates (Till 2035), Conservative, Base and Optimistic Scenarios (USD Million)
- Table 27.176 Companion Diagnostic Development Services Market: Distribution by Target Therapeutic Area
- Table 27.177 Companion Diagnostic Development Services Market for Oncological Disorders, Historical Trends (Since 2019) (USD Million)
- Table 27.178 Companion Diagnostic Development Services Market for Oncological Disorders, Forecasted Estimates (Till 2035), Conservative, Base and Optimistic Scenarios (USD Million)
- Table 27.179 Companion Diagnostic Development Services Market for Non-oncological Disorders, Historical Trends (Since 2019) (USD Million)
- Table 27.180 Companion Diagnostic Development Services Market for Non-oncological Disorders, Forecasted Estimates (Till 2035), Conservative, Base and Optimistic Scenarios (USD Million)
- Table 27.181 Companion Diagnostic Development Services Market: Distribution by End User
- Table 27.182 Companion Diagnostic Development Services Market for Industry Players, Historical Trends (Since 2019) (USD Million)
- Table 27.183 Companion Diagnostic Development Services Market for Industry Players, Forecasted Estimates (Till 2035), Conservative, Base and Optimistic Scenarios (USD Million)
- Table 27.184 Companion Diagnostic Development Services Market for Non-Industry Players, Historical Trends (Since 2019) (USD Million)
- Table 27.185 Companion Diagnostic Development Services Market for Non-Industry Players, Forecasted Estimates (Till 2035), Conservative, Base and Optimistic Scenarios (USD Million)
- Table 27.186 Companion Diagnostic Development Services Market: Distribution by Key Geographical Regions
- Table 27.187 Companion Diagnostic Development Services Market in North America, Historical Trends (Since 2019) (USD Million)
- Table 27.188 Companion Diagnostic Development Services Market in North America, Forecasted Estimates (Till 2035), Conservative, Base and Optimistic Scenarios (USD Million)
- Table 27.189 Companion Diagnostic Development Services Market in the US, Historical Trends (Since 2019) (USD Million)
- Table 27.190 Companion Diagnostic Development Services Market in the US, Forecasted Estimates (Till 2035), Conservative, Base and Optimistic Scenarios (USD Million)
- Table 27.191 Companion Diagnostic Development Services Market in Canada, Historical Trends (Since 2019) (USD Million)
- Table 27.192 Companion Diagnostic Development Services Market in Canada, Forecasted Estimates (Till 2035), Conservative, Base and Optimistic Scenarios (USD Million)
- Table 27.193 Companion Diagnostic Development Services Market in Europe, Historical Trends (Since 2019) (USD Million)
- Table 27.194 Companion Diagnostic Development Services Market in Europe, Forecasted Estimates (Till 2035), Conservative, Base and Optimistic Scenarios (USD Million)
- Table 27.195 Companion Diagnostic Development Services Market in Germany, Historical Trends (Since 2019) (USD Million)
- Table 27.196 Companion Diagnostic Development Services Market in Germany, Forecasted Estimates (Till 2035), Conservative, Base and Optimistic Scenarios (USD Million)
- Table 27.197 Companion Diagnostic Development Services Market in the UK, Historical Trends (Since 2019) (USD Million)
- Table 27.198 Companion Diagnostic Development Services Market in the UK, Forecasted Estimates (Till 2035), Conservative, Base and Optimistic Scenarios (USD Million)
- Table 27.199 Companion Diagnostic Development Services Market in Switzerland, Historical Trends (Since 2019) (USD Million)
- Table 27.200 Companion
List of Figures
- Figure 2.1 Research Methodology: Project Methodology
- Figure 2.2 Research Methodology: Forecast Methodology
- Figure 2.3 Research Methodology: Robust Quality Control
- Figure 2.4 Research Methodology: Key Market Segmentation
- Figure 3.1 Lessons Learnt from Past Recessions
- Figure 4.1 Executive Summary: Overall Market Landscape of Companion Diagnostics Development Service Providers
- Figure 4.2 Executive Summary: Market Landscape of Companion Diagnostics Products
- Figure 4.3 Executive Summary: Partnerships and Collaborations
- Figure 4.4 Executive Summary: Likely Partner Analysis
- Figure 4.5 Executive Summary: Mergers and Acquisitions
- Figure 4.6 Executive Summary: Market Forecast and Opportunity Analysis
- Figure 5.1 Personalized Medicine: Evolution, Since 2012
- Figure 5.2 Companion Diagnostics: Role in Clinical Trials
- Figure 5.3 Advantages of Companion Diagnostics
- Figure 5.4 Failure Rates: Distribution by Type of Drug Class
- Figure 5.5 Companion Diagnostics: Existing Challenges and Need for Outsourcing
- Figure 5.6 Key Factors to Consider while Selecting a CDO Partner
- Figure 6.1 Companion Diagnostics Development Service Providers: Distribution by Year of Establishment
- Figure 6.2 Companion Diagnostics Development Service Providers: Distribution by Company Size
- Figure 6.3 Companion Diagnostics Development Service Providers: Distribution by Location of Headquarters
- Figure 6.4 Companion Diagnostics Development Service Providers: Distribution by Company Size and Location of Headquarters (Region)
- Figure 6.5 Companion Diagnostics Development Service Providers: Distribution by Company Ownership
- Figure 6.6 Companion Diagnostics Development Service Providers: Distribution by Type of Services Offered
- Figure 6.7 Companion Diagnostics Development Service Providers: Distribution by Type of Affiliated Services Offered
- Figure 6.8 Companion Diagnostics Development Service Providers: Distribution by AI Support
- Figure 6.9 Companion Diagnostics Development Service Providers: Distribution by Analytical Techniques Used
- Figure 6.10 Companion Diagnostics Development Service Providers: Distribution by Target Therapeutic Area
- Figure 6.11 Companion Diagnostics Development Service Providers: Distribution by Regulatory Accreditations / Certifications
- Figure 6.12 Companion Diagnostics Development Service Providers: Distribution by Type of Services Offered, Company Size and Location of Headquarters (Region)
- Figure 6.13 Companion Diagnostics Development Service Providers: Distribution by Analytical Techniques Used, Company Size and Location of Headquarters (Region)
- Figure 7.1 Competitiveness Analysis of Companion Diagnostics Development Service Providers Based in North America
- Figure 7.2 Competitiveness Analysis of Companion Diagnostics Development Service Providers Based in Europe
- Figure 7.3 Competitiveness Analysis of Companion Diagnostics Development Service Providers Based in Asia-Pacific
- Figure 10.1 Companion Diagnostics: Distribution by Type of Sample Used
- Figure 10.2 Companion Diagnostics: Distribution by Type of Biomarker Detected
- Figure 10.3 Companion Diagnostics: Distribution by Analytical Technique Used
- Figure 10.4 Companion Diagnostics: Distribution by Target Disease Indication
- Figure 10.5 Companion Diagnostics: Distribution by Therapeutic Area
- Figure 10.6 Companion Diagnostics: Distribution by Commercial Availability and Therapeutic Area
- Figure 10.7 Companion Diagnostics: Distribution by Year of FDA Approval
- Figure 10.8 Companion Diagnostics: Distribution by Year of Other Regulatory Approval
- Figure 10.9 Companion Diagnostics: Distribution of Regulatory Authority Involved
- Figure 10.10 Companion Diagnostics: Most Popular Companion Drugs
- Figure 10.11 Companion Diagnostics Developers: Distribution by Year of Establishment
- Figure 10.12 Companion Diagnostics Developers: Distribution by Company Size
- Figure 10.13 Companion Diagnostics Developers: Distribution by Location of Headquarters
- Figure 10.14 Companion Diagnostic Developers: Distribution by Company Ownership
- Figure 10.15 Most Active Players: Distribution by Number of Marketed Products
- Figure 11.1 Partnerships and Collaborations: Cumulative Year-wise Trend, Since 2017
- Figure 11.2 Partnerships and Collaborations: Distribution by Type of Partnership
- Figure 11.3 Partnerships and Collaborations: Distribution by Year and Type of Partnership, Since 2021
- Figure 11.4 Partnerships and Collaborations: Distribution by Type of Technology
- Figure 11.5 Partnerships and Collaborations: Distribution by Target Therapeutic Area
- Figure 11.6 Partnerships and Collaborations: Distribution by Type of Partner
- Figure 11.7 Partnerships and Collaborations: Distribution by Year of Partnership and Type of Partner
- Figure 11.8 Most Active Players: Distribution by Number for Partnerships
- Figure 11.9 Partnerships and Collaborations: Local and International Agreements
- Figure 11.10 Partnerships and Collaborations: Intercontinental and Intracontinental Agreements
- Figure 12.1 Likely Partner Analysis: Distribution of Industry Players Focused on Amyloid Beta Biomarker by Likelihood of Partnership
- Figure 12.2 Regional Distribution of Amyloid Beta Biomarker Focused Clinical Trials Sponsored by Industry Players
- Figure 12.3 Likely Partner Analysis: Distribution of Non-Industry Players Focused on Amyloid Beta Biomarkers by Likelihood of Partnership
- Figure 12.4 Regional Distribution of Amyloid Beta Biomarker Focused Clinical Trials Sponsored by Non-Industry Players
- Figure 12.5 Likely Partner Analysis: Distribution of Industry Players Focused on Tau Biomarker by Likelihood of Partnership
- Figure 12.6 Regional Distribution of Tau Biomarker Focused Clinical Trials Sponsored by Industry Players
- Figure 12.7 Likely Partner Analysis: Distribution of Non-Industry Players Focused on Tau Biomarkers by Likelihood of Partnership
- Figure 12.8 Regional Distribution of Tau Biomarker Focused Clinical Trials Sponsored by Non- Industry Players
- Figure 12.9 Likely Partner Analysis: Distribution of Industry Players Focused on BRCA Biomarker by Likelihood of Partnership
- Figure 12.10 Regional Distribution of BRCA Biomarker Focused Clinical Trials Sponsored by Industry Players
- Figure 12.11 Likely Partner Analysis: Distribution of Non-Industry Players Focused on BRCA Biomarker by Likelihood of Partnership
- Figure 12.12 Regional Distribution of BRCA Biomarker Focused Clinical Trials Sponsored by Non-Industry Players
- Figure 12.13 Likely Partner Analysis: Distribution of Industry Players Focused on HER Biomarker by Likelihood of Partnership
- Figure 12.14 Regional Distribution of HER Biomarker Focused Clinical Trials Sponsored by Industry Players
- Figure 12.15 Likely Partner Analysis: Distribution of Non-Industry Players Focused on HER Biomarkers by Likelihood of Partnership
- Figure 12.16 Regional Distribution of HER Biomarker Focused Clinical Trials Sponsored by Non-Industry Players
- Figure 12.17 Likely Partner Analysis: Distribution of Industry Players Focused on PD-L1 Biomarker by Likelihood of Partnership
- Figure 12.18 Regional Distribution of PD-L1 Biomarker Focused Clinical Trials Sponsored by Industry Players
- Figure 12.19 Likely Partner Analysis: Distribution of Non-Industry Players Focused on PD-L1 Biomarker by Likelihood of Partnership
- Figure 12.20 Regional Distribution of PD-L1 Biomarker Focused Clinical Trials Sponsored by Non-Industry Players
- Figure 12.21 Likely Partner Analysis: Distribution of Industry Players Focused on HR Biomarker by Likelihood of Partnership
- Figure 12.22 Regional Distribution of HR Biomarker Focused Clinical Trials Sponsored by Industry Players
- Figure 12.23 Likely Partner Analysis: Distribution of Non-Industry Players Focused on HR Biomarker by Likelihood of Partnership
- Figure 12.24 Regional Distribution of HR Biomarker Focused Clinical Trials Sponsored by Non- Industry Players
- Figure 12.25 Likely Partner Analysis: Distribution of Industry Players Focused on BRAF Biomarker by Likelihood of Partnership
- Figure 12.26 Regional Distribution of BRAF Biomarker Focused Clinical Trials Sponsored by Industry Players
- Figure 12.27 Likely Partner Analysis: Distribution of Non-Industry Players Focused on BRAF Biomarker by Likelihood of Partnership
- Figure 12.28 Regional Distribution of BRAF Biomarker Focused Clinical Trials Sponsored by Non-Industry Players
- Figure 12.29 Likely Partner Analysis: Distribution of Industry Players Focused on EGFR Partnership
- Figure 12.30 Regional Distribution of EGFR Biomarker Focused Clinical Trials Sponsored by Industry Players
- Figure 12.31 Likely Partner Analysis: Distribution of Non-Industry Players Focused on EGFR Biomarker by Likelihood of Partnership
- Figure 12.32 Regional Distribution of EGFR Biomarker Focused Clinical Trials Sponsored by Non-Industry Players
- Figure 12.33 Likely Partner Analysis: Distribution of Industry Players Focused on KRAS Biomarker by Likelihood of Partnership
- Figure 12.34 Regional Distribution of KRAS Biomarker Focused Clinical Trials Sponsored by Industry Players
- Figure 12.35 Likely Partner Analysis: Distribution of Non-Industry Players Focused on KRAS Biomarker by Likelihood of Partnership
- Figure 12.36 Regional Distribution of KRAS Biomarker Focused Clinical Trials Sponsored by Non-Industry Players
- Figure 12.37 Likely Partner Analysis: Distribution of Industry Players Focused on MSI / dMMR Biomarker by Likelihood of Partnership
- Figure 12.38 Regional Distribution of MSI /dMMR Biomarker Focused Clinical Trials Sponsored by Industry Players
- Figure 12.39 Likely Partner Analysis: Distribution of Non-Industry Players Focused on MSI / dMMR Biomarker by Likelihood of Partnership
- Figure 12.40 Regional Distribution of MSI /dMMR Biomarker Focused Clinical Trials Sponsored by Non-Industry Players
- Figure 12.41 Likely Partner Analysis: Distribution of Industry Players Focused on ALK Biomarker by Likelihood of Partnership
- Figure 12.42 Regional Distribution of ALK Biomarker Focused Clinical Trials Sponsored by Industry Players
- Figure 12.43 Likely Partner Analysis: Distribution of Non-Industry Players Focused on ALK Biomarker by Likelihood of Partnership
- Figure 12.44 Regional Distribution of ALK Biomarker Focused Clinical Trials Sponsored by Non-Industry Players
- Figure 12.45 Likely Partner Analysis: Distribution of Industry Players Focused on AST Biomarker by Likelihood of Partnership
- Figure 12.46 Regional Distribution of AST Biomarker Focused Clinical Trials Sponsored by Industry Players
- Figure 12.47 Likely Partner Analysis: Distribution of Non-Industry Players Focused on AST Biomarker by Likelihood of Partnership
- Figure 12.48 Regional Distribution of AST Biomarker Focused Clinical Trials Sponsored by Non-Industry Players
- Figure 12.49 Likely Partner Analysis: Distribution of Industry Players Focused on EGFR Biomarker by Likelihood of Partnership
- Figure 12.50 Regional Distribution of EGFR Biomarker Focused Clinical Trials Sponsored by Industry Players
- Figure 12.51 Likely Partner Analysis: Distribution of Non-Industry Players Focused on EGFR Biomarker by Likelihood of Partnership
- Figure 12.52 Regional Distribution of EGFR Biomarker Focused Clinical Trials Sponsored by Non-Industry Players
- Figure 12.53 Likely Partner Analysis: Distribution of Industry Players Focused on PD-L1 Biomarker by Likelihood of Partnership
- Figure 12.54 Regional Distribution of PD-L1 Biomarker Focused Clinical Trials Sponsored by Industry Players
- Figure 12.55 Likely Partner Analysis: Distribution of Non-Industry Players Focused on PD-L1 Biomarker by Likelihood of Partnership
- Figure 12.56 Regional Distribution of PD-L1 Biomarker Focused Clinical Trials Sponsored by Non-Industry Players
- Figure 12.57 Likely Partner Analysis: Distribution of Industry Players Focused on RET Biomarker by Likelihood of Partnership
- Figure 12.58 Regional Distribution of RET Biomarker Focused Clinical Trials Sponsored by Industry Players
- Figure 12.59 Likely Partner Analysis: Distribution of Non-Industry Players Focused on RET Biomarker by Likelihood of Partnership
- Figure 12.60 Regional Distribution of RET Biomarker Focused Clinical Trials Sponsored by Non-Industry Players
- Figure 12.61 Likely Partner Analysis: Distribution of Industry Players Focused on CCR5 Biomarker by Likelihood of Partnership
- Figure 12.62 Regional Distribution of CCR5 Biomarker Focused Clinical Trials Sponsored by Industry Players
- Figure 12.63 Likely Partner Analysis: Distribution of Non-Industry Players Focused on CCR5 Biomarker by Likelihood of Partnership
- Figure 12.64 Regional Distribution of CCR5 Biomarker Focused Clinical Trials Sponsored by Non-Industry Players
- Figure 12.65 Likely Partner Analysis: Distribution of Industry Players Focused on BRCA Biomarker by Likelihood of Partnership
- Figure 12.66 Regional Distribution of BRCA Biomarker Focused Clinical Trials Sponsored by Industry Players
- Figure 12.67 Likely Partner Analysis: Distribution of Non-Industry Players Focused on BRCA Biomarker by Likelihood of Partnership
- Figure 12.68 Regional Distribution of BRCA Biomarker Focused Clinical Trials Sponsored by Non-Industry Players
- Figure 12.69 Likely Partner Analysis: Distribution of Industry Players Focused on CA-125 Biomarker by Likelihood of Partnership
- Figure 12.70 Regional Distribution of CA-125 Biomarker Focused Clinical Trials Sponsored by Industry Players
- Figure 12.71 Likely Partner Analysis: Distribution of Non-Industry Players Focused on CA-125 Biomarker by Likelihood of Partnership
- Figure 12.72 Regional Distribution of CA-125 Biomarker Focused Clinical Trials Sponsored by Non-Industry Players
- Figure 12.73 Likely Partner Analysis: Distribution of Industry Players Focused on AR-V7 Biomarker by Likelihood of Partnership
- Figure 12.74 Regional Distribution of AR-V7 Biomarker Focused Clinical Trials Sponsored by Industry Players
- Figure 12.75 Regional Distribution of AR-V7 Biomarker Focused Clinical Trials Sponsored by Non-Industry Players
- Figure 12.76 Likely Partner Analysis: Distribution of Industry Players Focused on PTEN Biomarker by Likelihood of Partnership
- Figure 12.77 Regional Distribution of PTEN Biomarker Focused Clinical Trials Sponsored by Industry Players
- Figure 12.78 Likely Partner Analysis: Distribution of Non-Industry Players Focused on PTEN Biomarker by Likelihood of Partnership
- Figure 12.79 Regional Distribution of PTEN Biomarker Focused Clinical Trials Sponsored by Non-Industry Players
- Figure 13.1 Mergers and Acquisitions: Cumulative Year-Wise Trend, Since 2017
- Figure 13.2 Mergers and Acquisitions: Distribution by Type of Deal
- Figure 13.3 Mergers and Acquisitions: Local and International Agreements
- Figure 13.4 Mergers and Acquisitions: Intercontinental and Intracontinental Agreements
- Figure 13.5 Acquisitions: Ownership Change Matrix
- Figure 13.6 Acquisitions: Distribution by Key Value Drivers
- Figure 13.7 Key Players: Distribution by Number of Mergers and Acquisitions
- Figure 14.1 Companion Diagnostics: Stakeholder Interests / Needs
- Figure 14.2 Interests / Needs of Drug Developers
- Figure 14.3 Interests / Needs of Companion Diagnostic Developers
- Figure 14.4 Interests / Needs of Regulatory Authorities
- Figure 14.5 Interests / Needs of Testing Laboratories
- Figure 14.6 Interests / Needs of Payers / Insurance Providers
- Figure 14.7 Interests / Needs of Physicians
- Figure 14.8 Interests / Needs of Patients
- Figure 14.9 Interests / Needs of Companion Diagnostic Developers: Current and Future Relevance
- Figure 14.10 Interests / Needs of Drug Developers: Current and Future Relevance
- Figure 14.11 Interests / Needs of Regulatory Authorities: Current and Future Relevance
- Figure 14.12 Interests / Needs of Testing Laboratories: Current and Future Relevance
- Figure 14.13 Interests / Needs of Payers: Current and Future Relevance
- Figure 14.14 Interests / Needs of Physicians: Current and Future Relevance
- Figure 14.15 Interests / Needs of Patients: Current and Future Relevance
- Figure 14.16 Stakeholder Needs Analysis: Overall Summary
- Figure 15.1 The Companion Diagnostics Value Chain
- Figure 15.2 Cost Distribution Across Value Chain
- Figure 15.3 Costs Associated with Research and Product Development
- Figure 15.4 Costs Associated with Manufacturing and Assembly
- Figure 15.5 Costs Associated with Clinical Trials, FDA Approval and Other Administrative Tasks
- Figure 15.6 Costs Associated with Payer Negotiation and KoL Engagement
- Figure 15.7 Costs Associated with Marketing and Sales
- Figure 16.1 Clinical Trial Analysis: Distribution by Trial Registration Year
- Figure 16.2 Clinical Trial Analysis: Distribution by Most Popular Biomarkers
- Figure 16.3 Clinical Trial Analysis: Distribution by Moderately Popular Biomarkers
- Figure 16.4 Clinical Trial Analysis: Distribution by Less Popular / Preliminary Stage Biomarkers
- Figure 16.5 Other Emerging Biomarkers: Word Cloud
- Figure 16.6 Clinical Trial Analysis: Distribution of Trials of the Most Popular Biomarkers by Trial Registration Year
- Figure 16.7 Clinical Trial Analysis: Distribution of Trials of the Moderately Popular Biomarkers by Trials Registration Year
- Figure 16.8 Clinical Trial Analysis: Distribution of Trials of the Less Popular and Other Biomarkers by Trial Registration Year
- Figure 16.9 Clinical Trial Analysis: Distribution of Trials by Most Popular Indications
- Figure 16.10 Clinical Trial Analysis: Distribution of Trials of the Moderately Popular Indications
- Figure 16.11 Clinical Trial Analysis: Distribution of Trials of the Less Popular and Other Indications
- Figure 16.12 Less Popular and Other Indications: Word Cloud
- Figure 16.13 Clinical Trial Analysis: Distribution of Trial of the Most Popular Indications by Trial Registration Year
- Figure 16.14 Clinical Trial Analysis: Distribution of Trial of the Moderately Popular Indications by Trial Registration Year
- Figure 16.15 Clinical Trial Analysis: Distribution of Trial of the Less Popular and Other Indications by Trial Registration Year
- Figure 16.16 Clinical Trial Analysis: Distribution by Trial Phase of Development
- Figure 16.17 Clinical Trial Analysis: Distribution of Trials of the Most Popular Biomarkers by Phase of Development
- Figure 16.18 Clinical Trial Analysis: Distribution of Trials of the Moderately Popular Biomarkers by Phase of Development
- Figure 16.19 Clinical Trial Analysis: Distribution of Trials of the Less Popular and Other Biomarkers by Phase of Development
- Figure 16.20 Clinical Trial Analysis: Distribution of Trials of the Most Popular Indications by Phase of Development
- Figure 16.21 Clinical Trial Analysis: Distribution of Trials of the Moderately Popular Indications by Phase of Development
- Figure 16.22 Clinical Trial Analysis: Distribution of Trials of the Less Popular / Emerging Indications by Phase of Development
- Figure 16.23 Clinical Trial Analysis: Distribution of Trials by Sponsor
- Figure 16.24 Clinical Trial Analysis: Distribution of Trials of the Most Popular Biomarkers by Sponsor
- Figure 16.25 Clinical Trial Analysis: Distribution of Trials of the Moderately Popular Biomarkers by Sponsor
- Figure 16.26 Clinical Trial Analysis: Distribution of Trials of the Most Popular Indications by Sponsor
- Figure 16.27 Clinical Trial Analysis: Distribution of Trials of the Moderately Popular Indications by Sponsor
- Figure 16.28 Clinical Trial Analysis: Distribution of Trials by Recruitment Status
- Figure 16.29 Clinical Trial Analysis: Distribution of Trials by Therapy Design
- Figure 16.30 Clinical Trial Analysis: Distribution by Geography
- Figure 16.31 Clinical Trial Analysis: Distribution by Enrolled Patient Population
- Figure 16.32 Clinical Trial Analysis: Distribution of Trials of the Lung Cancer by Affiliated Biomarkers
- Figure 16.33 Clinical Trial Analysis: Distribution of Trials of the Breast Cancer by Affiliated Biomarkers
- Figure 16.34 Clinical Trial Analysis: Distribution of Trials of the Lymphoma by Affiliated Biomarkers
- Figure 16.35 Clinical Trial Analysis: Distribution of Trials of the Ovarian Cancer by Affiliated Biomarkers
- Figure 16.36 Clinical Trial Analysis: Distribution of Trials of the Prostate Cancer by Affiliated Biomarkers
- Figure 16.37 Clinical Trial Analysis: Distribution of Trials of the Melanoma by Affiliated Biomarkers
- Figure 16.38 Clinical Trial Analysis: Distribution of Trials of the Colon / Colorectal Cancer by Affiliated Biomarkers
- Figure 16.39 Clinical Trial Analysis: Distribution of Trials of the Head and Neck Cancer by Affiliated Biomarkers
- Figure 17.1 Precision Medicine Software Developers: Distribution by Year of Establishment
- Figure 17.2 Precision Medicine Software Developers: Distribution by Company Size
- Figure 17.3 Precision Medicine Software Developers: Distribution by Location of Headquarters (Region)
- Figure 17.4 Precision Medicine Software Developers: Distribution by Company Size and Location of Headquarters (Region)
- Figure 17.5 Precision Medicine Software: Distribution by Status of Development
- Figure 17.6 Precision Medicine Software Developers: Distribution by Type of Platform
- Figure 17.7 Precision Medicine Software: Distribution by Regulatory Accreditation Received
- Figure 17.8 Precision Medicine Software Developers: Distribution by Target Therapeutic Area
- Figure 17.9 Precision Medicine Software: Distribution by Status of Development and Target Therapeutic Area
- Figure 17.10 Precision Medicine Software Developers: Distribution by Type of Data Handled
- Figure 17.11 Precision Medicine Software: Distribution by Status of Development and Type of Data Handled
- Figure 17.12 Precision Medicine Software: Distribution by Type of Data Handled and Target Therapeutic Area
- Figure 17.13 Precision Medicine Software Developers: Distribution by Purpose of Software
- Figure 17.14 Precision Medicine Software: Distribution by End-User
- Figure 17.15 Most Active Players: Distribution by Number of Software
- Figure 18.1 Market Drivers
- Figure 18.2 Market Restraints
- Figure 18.3 Market Opportunities
- Figure 18.4 Market Challenges
- Figure 19.1 Global Companion Diagnostic Development Services Market, Historical Trends (Since 2019) and Forecasted Estimates (Till 2035) (USD Billion)
- Figure 19.2 Global Companion Diagnostic Development Services Market, Forecasted Estimates (Till 2035): Conservative Scenario (USD Billion)
- Figure 19.3 Global Companion Diagnostic Development Services Market, Forecasted Estimates (Till 2035): Optimistic Scenario (USD Billion)
- Figure 20.1 Companion Diagnostic Development Services Market: Distribution by Type of Service Offered (USD Billion)
- Figure 20.2 Companion Diagnostic Development Services Market for Feasibility Studies, Historical Trends (Since 2019) and Forecasted Estimates (Till 2035) (USD Million)
- Figure 20.3 Companion Diagnostic Development Services Market for Assay Development, Historical Trends (Since 2019) and Forecasted Estimates (Till 2035) (USD Million)
- Figure 20.4 Companion Diagnostic Development Services Market for Analytical Validation, Historical Trends (Since 2019) and Forecasted Estimates (Till 2035) (USD Million)
- Figure 20.5 Companion Diagnostic Development Services Market for Clinical Validation, Historical Trends (Since 2019) and Forecasted Estimates (Till 2035) (USD Million)
- Figure 20.6 Companion Diagnostic Development Services Market for Manufacturing, Historical Trends (Since 2019) and Forecasted Estimates (Till 2035) (USD Million)
- Figure 21.1 Companion Diagnostic Development Services Market: Distribution by Analytical Technique Used (USD Billion)
- Figure 21.2 Companion Diagnostic Development Services Market for NGS, Historical Trends (Since 2019) and Forecasted Estimates (Till 2035) (USD Million)
- Figure 21.3 Companion Diagnostic Development Services Market for PCR, Historical Trends (Since 2019) and Forecasted Estimates (Till 2035) (USD Million)
- Figure 21.4 Companion Diagnostic Development Services Market for IHC, Historical Trends (Since 2019) and Forecasted Estimates (Till 2035) (USD Million)
- Figure 21.5 Companion Diagnostic Development Services Market for Flow Cytometry, Historical Trends (Since 2019) and Forecasted Estimates (Till 2035) (USD Million)
- Figure 21.6 Companion Diagnostic Development Services Market for Other Analytical Techniques, Historical Trends (Since 2019) and Forecasted Estimates (Till 2035) (USD Million)
- Figure 22.1 Companion Diagnostic Development Services Market: Distribution by Target Therapeutic Area (USD Billion)
- Figure 22.2 Companion Diagnostic Development Services Market for Oncological Disorders, Historical Trends (Since 2019) and Forecasted Estimates (Till 2035) (USD Million)
- Figure 22.3 Companion Diagnostic Development Services Market for Non-oncological Disorders, Historical Trends (Since 2019) and Forecasted Estimates (Till 2035) (USD Million)
- Figure 23.1 Companion Diagnostic Development Services Market: Distribution by End User (USD Billion)
- Figure 23.2 Companion Diagnostic Development Services Market for Industry Players, Historical Trends (Since 2019) and Forecasted Estimates (Till 2035) (USD Million)
- Figure 23.3 Companion Diagnostic Development Services Market for Non-Industry Players, Historical Trends (Since 2019) and Forecasted Estimates (Till 2035) (USD Million)
- Figure 24.1 Companion Diagnostic Development Services Market: Distribution by Key Geographical Regions (USD Billion)
- Figure 24.2 Companion Diagnostic Development Services Market in North America, Historical Trends (Since 2019) and Forecasted Estimates (Till 2035) (USD Million)
- Figure 24.3 Companion Diagnostic Development Services Market in the US, Historical Trends (Since 2019) and Forecasted Estimates (Till 2035) (USD Million)
- Figure 24.4 Companion Diagnostic Development Services Market in Canada, Historical Trends (Since 2019) and Forecasted Estimates (Till 2035) (USD Million)
- Figure 24.5 Companion Diagnostic Development Services Market in Europe, Historical Trends (Since 2019) and Forecasted Estimates (Till 2035) (USD Million)
- Figure 24.6 Companion Diagnostic Development Services Market in Germany, Historical Trends (Since 2019) and Forecasted Estimates (Till 2035) (USD Million)
- Figure 24.7 Companion Diagnostic Development Services Market in the UK, Historical Trends (Since 2019) and Forecasted Estimates (Till 2035) (USD Million)
- Figure 24.8 Companion Diagnostic Development Services Market in Switzerland, Historical Trends (Since 2019) and Forecasted Estimates (Till 2035) (USD Million)
- Figure 24.9 Companion Diagnostic Development Services Market in Belgium, Historical Trends (Since 2019) and Forecasted Estimates (Till 2035) (USD Million)
- Figure 24.10 Companion Diagnostic Development Services Market in Other European Countries, Historical Trends (Since 2019) and Forecasted Estimates (Till 2035) (USD Million)
- Figure 24.11 Companion Diagnostic Development Services Market in Asia-Pacific, Historical Trends (Since 2019) and Forecasted Estimates (Till 2035) (USD Million)
- Figure 24.12 Companion Diagnostic Development Services Market in China, Historical Trends (Since 2019) and Forecasted Estimates (Till 2035) (USD Million)
- Figure 24.13 Companion Diagnostic Development Services Market in Other Asia-Pacific Countries, Historical Trends (Since 2019) and Forecasted Estimates (Till 2035) (USD Million)
- Figure 25.1 Concluding Remarks: Market Landscape of Companion Diagnostics Development Service Providers
- Figure 25.2 Concluding Remarks: Market Landscape of Companion Diagnostics Products
- Figure 25.3 Concluding Remarks: Partnerships and Collaborations
- Figure 25.4 Concluding Remarks: Mergers and Acquisitions
- Figure 25.5 Concluding Remarks: Market Landscape of Precision Software Applications
- Figure 25.6 Concluding Remarks: Market Forecast and Opportunity Analysis

