
PUBLISHER: Roots Analysis | PRODUCT CODE: 1920862

PUBLISHER: Roots Analysis | PRODUCT CODE: 1920862
Human Microbiome Market (5th Edition): Industry Trends and Global Forecasts, till 2035 - Distribution by Type of Product, Type of Biologic, Route of Administration, Drug Formulation, Target Indication, Target Therapeutic Area and Geographical Regions
Human Microbiome Market: Overview
As per Roots Analysis, the human microbiome market is estimated to grow from USD 0.85 billion in the current year to USD 3.27 billion by 2035, at a CAGR of 16% during the forecast period, till 2035.
Human Microbiome Market: Growth and Trends
The human microbiome consists of a variety of microorganisms, such as bacteria, archaea, viruses, and fungi, that inhabit different regions of the human body, including the skin, gut, mouth, and other tissues. The investigation into the diversity of the human microbiome dates back to the 1680s, when Antonie van Leeuwenhoek examined his oral and fecal microbiota samples. The existing human microbiome landscape is extremely dynamic, with studies emphasizing its crucial function in immunity, metabolism, and conditions like cancer, inflammatory diseases, and even neurodegenerative disorders. The US FDA has authorized two fecal microbiota treatments to prevent recurring C. difficile infection (rCDI). Significantly, REBYOTA (created by Ferring Pharmaceutical) became the first human microbiome therapy to gain approval in November 2022, with VOWST (developed by Seres Therapeutics) also receiving approval for oral administration in April 2023. Notably, the commercial triumph of VOWST has been strengthened by Nestle Health Science's purchase of its US and worldwide rights in June 2024.
Given the continuous advancements in DNA sequencing, bioinformatics, and analytical tools that enhance our comprehension of the human microbiome in relation to health and diseases, we anticipate that this sector is poised for double-digit market growth in the near future.
Growth Drivers: Strategic Enablers of Market Expansion
Advancements in microbiome sequencing technologies, such as next-generation sequencing and metagenomics, enable deeper analysis of microbial communities, accelerating diagnostics and therapies. Further, rising investments from pharma, biotech firms, and venture capital supports expanding clinical pipelines for conditions like gastrointestinal disorders, metabolic diseases, and cancer. In addition, increasing awareness of microbiomein health, coupled with demand for personalized probiotics, preventive healthcare, and collaborations between startups and academia, further propels human microbiome market expansion.
Market Challenges: Critical Barriers Impeding Progress
While the global human microbiome market is experiencing substantial growth, there are certain restraints that can hinder the growth of this industry. High R&D and commercialization costs in the human microbiome market space including GMP facilities for live organisms and complex clinical trials, hinder scalability and adoption Stringent regulatory requirements, lack of standardized guidelines, and variability in microbial strains delay approvals and increase entry barriers across regions. Limited public understanding, ethical concerns over microbiome manipulation, and slow patient / provider adoption due to inconsistent evidence also impede progress.
Human Microbiome Market: Key Insights
The report delves into the current state of the human microbiome market and identifies potential growth opportunities within industry. Some key findings from the report include:
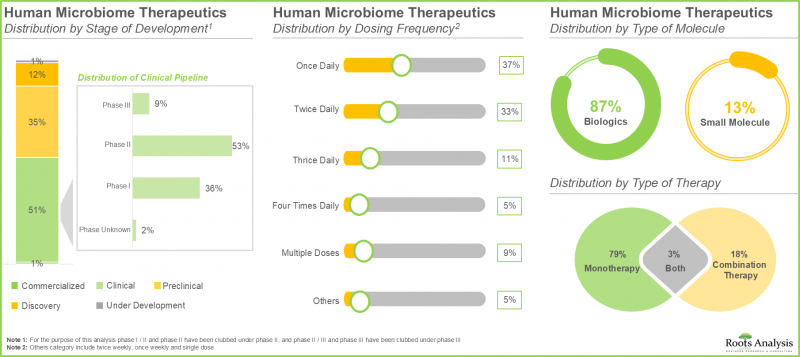
- Currently, close to 215 human microbiome therapeutics developed by ~55 developers are approved / being investigated across various stages of development for treating a myriad of disorders.
- Over 50% of the human microbiome therapeutics are in clinical stages of development; notably, most of the drugs / therapy programs are focused on the development of biologics, primarily live biotherapeutics.
- Close to 140 human microbiome diagnostic tests are being developed by 75 players in this domain; notably, around 55% of the developers were established post-2015.
- Around 80% of the companies are offering human microbiome diagnostics for analysis of microfloral composition and function; 55% of players are employing sequencing / metagenomics techniques for the diagnosis.
- Majority of fecal microbiota therapy developers were established between 2000-2015; of these, more than 65% are headquartered in North America, followed by Europe (~35%).
- Fecal bacteriotherapy involves the transplantation / infusion of fecal bacteria from healthy individuals to the stomach, colon / small intestine of patients; majority (50%) of these therapies are in clinical stages.
- Close to 205 clinical trials have been registered till date to evaluate the safety and efficacy of various fecal microbiota therapies; majority of these studies have been conducted across various trial sites in Europe.
- Over the last few years, start-ups have undertaken multiple initiatives to enhance their microbiome therapeutics and diagnostics portfolio; majority of the initiatives were undertaken for the treatment of ulcerative colitis.
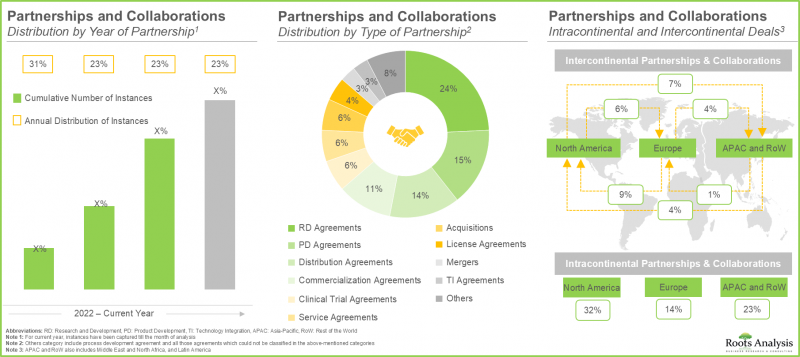
- The rising interest in this market is reflected from the diverse partnerships established among various stakeholders in the recent past; in fact, more than 45% of the deals were inked in the last two years.
- Since 2022, more than USD 1.2 billion has been raised in this domain; notably, grants / awards are also a very prominent funding model adopted by microbiome drug developers.
- The market impact analysis outlines the potential factors that influence the evolution of the overall market; it can be employed to determine the growth drivers, restraints, opportunities and challenges within a specific domain.
- Driven by the increasing consumer awareness gut health, the rising prevalence of chronic diseases and advancements in microbiome sequencing technologies, the market is poised for a steady growth in the future.
- Currently, amongst various routes of administration, oral route captures the highest share (55%) of the market owing to its safety, convenience and the suitability for direct therapeutic intervention within the oral cavity.
- The infectious diseases sub-segment is estimated to capture of the overall market share in the current year, owing to the effectiveness of human microbiome therapeutics in the treatment of such diseases.
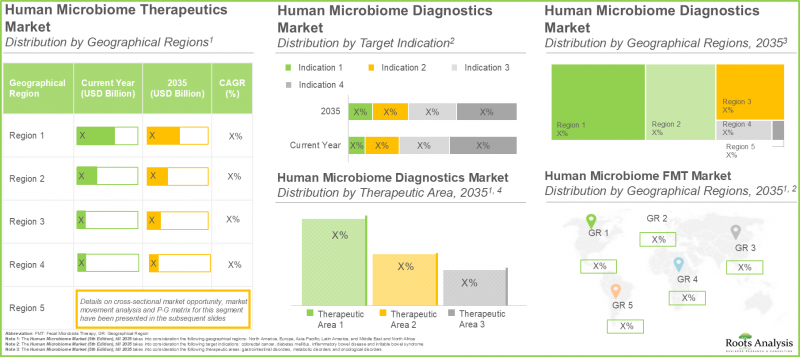
- Notably, amongst various geographical regions, North America is expected to dominate the overall human microbiome market during the forecast period.
- North America is expected to capture a significant share of the overall human microbiome market in the current year owing to the rapid innovations within human microbiome sequencing technologies in the region.
- Driven by the rapid success of approved microbiome therapeutic drugs developed by prominent players in the US, the human microbiome therapeutics market is expected to grow at a steady CAGR.
Human Microbiome Market
The market sizing and opportunity analysis has been segmented across the following parameters:
By Type of Product
- Therapeutics
- Diagnostics
- Fecal Microbiota Therapies
By Type of Biologic
- Live Biotherapeutics
- Others
By Route of Administration
- Oral Route
- Rectal Route
By Drug Formulation
- Capsule
- Suspension
- Enema
- Powder
By Target Indication
- Clostridium Difficile Infection
- Necrotizing Enterocolitis
- Irritable Bowel Syndrome
- Acute Graft Versus Host Disease
- Diabetes Mellitus
- Irritable Bowel Disease
- Colorectal Cancer
By Target Therapeutic Area
- Infectious Disorders
- Gastrointestinal Disorders
- Rare Disorders
- Metabolic Disorders
- Oncological Disorders
By Geographical Regions
- North America
- US
- Canada
- Europe
- Germany
- France
- Italy
- UK
- Spain
- Rest of the Europe
- Asia-Pacific
- Australia
- China
- India
- Japan
- Latin America
- Brazil
- Middle East and North Africa
- Israel
- Saudi Arabia
Human Microbiome Market: Key Segments
Market Share by Type of Product: Diagnostics Segment Hold the Largest Share
In the current year, the diagnostics segment occupies the highest market share (~45%), as per human microbiome market report, driven by increased adoption of microbiome-centered diagnostic tests for the early identification of various conditions, such as metabolic disorders and cancer-related problems. The therapeutics segment is projected to see a significant growth rate of 32% during the forecast period. This increased research and development in personalized therapies, the effectiveness of existing treatments like Fecal Microbiota Transplantation (FMT) for particular illnesses, and new drugs and therapies under development.
Human Microbiome-based Therapeutics Market Share Insights
Market Share by Type of Biologic: Live Biotherapeutics Segment Holds the Largest Market Share
Currently, the live biotherapeutics segment occupies the entire human microbiome market share (for therapeutics) owing to the increasing application of microbiome-targeted treatments for treating various conditions, such as digestive problems, metabolic disorders, and cancer-related issues. Notably, the others segment (which includes phage biologics, vaccines, and additional antibodies) is expected to experience a remarkable growth rate, with a CAGR of 64% during the forecast period.
Market Share by Route of Administration: Oral Route Segment Holds the Largest Revenue
In the current year, the oral route occupies the highest market share (55%) of human microbiome therapeutics market. It is worth noting that the therapies administered via oral route are likely to witness a substantial CAGR of 38% during the forecast period. This is associated to the safety, user-friendliness, and the ability for direct therapeutic interaction in the oral cavity to accomplish desired systemic effects.
Market Share by Drug Formulation: Suspension Segment to Grow at a Higher CAGR
Among the various segments, the capsule segment occupies the highest human microbiome therapeutics market share (55%) in 2025. This results from the strong clinical trial pipeline of microbiome-centered therapies in capsule form. It is important to highlight that the suspension segment market is expected to expand at a notably higher CAGR (38%) throughout the forecast period. This arises from its ability to maintain the viability and stability of living microbial formulations, facilitate straightforward dosage adjustments, and its long-standing application history in diverse therapeutic uses.
Market Share by Target Indication: Clostridium Difficile Infection Segment Domina
Currently, the clostridium difficile infection segment occupies the entire human microbiome therapeutics market size. This is due to the rising frequency and intensity of clostridium difficile infections, coupled with the established link between antibiotic-induced gut dysbiosis and the infection.
Further, the market for therapies targeting acute graft versus host disease is likely to grow at a relatively higher CAGR (35%), during the period 2027-2035. This is attributed to the expected endorsement of MaaT013 (Xervyteg(R)), a pioneering microbiota-centered therapy designed to meet a significant unmet need in patients suffering from GI-involved acute graft versus host disease, where existing survival rates are dangerously low and no alternative approved therapy exists.
Market Share by Target Therapeutic Area: Infectious Disorders Segment Dominates the Market
Currently, the infectious diseases segment occupies the entire human microbiome therapeutics market size (with a share of 100%) and this trend is unlikely to change in the future. This is attributed to its direct involvement in immune function and pathogen defense, along with the demonstrated effectiveness of microbiome-based treatments, such as those addressing recurrent Clostridium difficile infections. Notably, the rare disorders segment is expected to experience a comparatively higher CAGR (35%) from 2027 to 2035.
Market Share by Geographical Regions: North America with Highest Revenue
According to our projections, North America is likely to capture the majority (95%) of the human microbiome therapeutics market share in 2025, as the advanced healthcare infrastructure in North America enables developers to conduct a large number of clinical trials, in order to meet the regulatory guidelines of the approval bodies. It is worth highlighting that the market in Europe is likely to grow at a relatively higher CAGR (75%), during the period 2025-2032.
Primary Research Overview
The opinions and insights presented in the market report were also influenced by discussions held with senior stakeholders in the industry. The market report includes detailed transcripts of interviews conducted with the following individuals:
- Former Senior Manager, Corporate Development, Mid-Sized Company, UK
- Co-founder and Chairman, Small Company, US
- Chief Executive Officer, Small Company, US
- Senior Scientist, Large Company, US
- President, Small Company, Taiwan
- Vice President, Business Development, Small Company, US
- Chief Business Officer, Mid-sized Company, Israel
- Former Vice President, Sales and Business Development, Small Company, US
- Co-founder and Chief Executive Officer, Small Company, Belgium
- Co-founder and Chief Executive Officer, Small Company, US
- Co-founder and Chief Executive Officer, Small Company, US
- Ex-Co-founder and Vice President of Innovation, Mid-sized Company, US
- Vice President & Chief Operating Officer, Small Company, US
- Former Vice President, Operations, Mid-sized Company, US
- Former President and Chief Executive Officer, Small Company, US
- Former Chief Scientific Officer and Vice President, Research, Small Company, US
- Former Chief Strategy Officer, Small Company, France
Example Players in Human Microbiome Market
- Becton, Dickinson and Company
- Biome Diagnostics
- Ferring Pharmaceuticals
- GoodGut
- Infant Bacterial Therapeutics
- MaaT Pharma
- Microbiomik
- NutriPATH
- Seres Therapeutics
- Tiny Health
- OxThera
- Vedanta Bisociences
- Zybio
Human Microbiome Market: Research Coverage
- Market Sizing and Opportunity Analysis: The report features an in-depth analysis of the human microbiome market, focusing on key market segments, including [A] type of product, [B] type of biologic, [C] route of administration, [D] drug formulation, [E] target indication, [F] target therapeutic area, and [G] geographical regions.
- Human Microbiome Therapeutics - Market Landscape: A detailed overview of the current market landscape of human microbiome therapeutics, along with information on several relevant parameters, such as [A] stage of development, [B] type of molecule, [C] type of biologic, [D] target indication, [E] therapeutic area, [F] route of administration, [G] type of formulation, [H] dosage frequency, [I] type of therapy, [J] year of establishment, [K] company size, [L] location of headquarters, and [M] most active players.
- Human Microbiome Diagnostics And Screening / Profiling Tests - Market Landscape 2: A detailed overview of the current market landscape of various types of diagnostic and screening / profiling tests, along with information on several relevant parameters, such as [A] stage of development, [B] type of sample analyzed, [C] type of screening technique, [D] target indication, [E] therapeutic area, [F] purpose of test, [G] year of establishment, [H] company size, and [I] location of headquarters.
- Human Microbiome Fecal Microbiota Therapies - Market Landscape 3: A detailed overview of the current market landscape of other relevant aspects of FMT therapies, along with information on several relevant parameters, such as [A] stage of development, [B] type of sample analyzed, [C] type of screening technique, [D] target indication, [E] therapeutic area, [F] purpose of test, [G] year of establishment, [H] company size, and [I] location of headquarters.
- Company and Drug Profiles: In-depth profiles of key players engaged in the development of microbiome therapeutics, microbiome diagnostics and screening / profiling tests and fecal microbiota therapy based on [A] year of establishment, [B] location of headquarters, [C] microbiome-based drug portfolio, [D] recent developments and [E] an informed future outlook.
- Clinical Trial Analysis: An in-depth analysis of completed and ongoing clinical studies of fecal microbiota therapy, based on various relevant parameters, such as [A] trial registration year, [B] number of patients enrolled, [C] patient gender, [D] trial phase, [E] trial status, [F] therapeutic area, [G] type of sponsor / collaborator, [H] study design, [I] most active players (in terms of number of clinical trials), and [J] geography.
- Attractiveness Competitiveness Analysis: An insightful business portfolio analysis of top indications, across various therapeutic areas under investigation, based on the 9-box AC matrix framework. It further includes a discussion on the relative market attractiveness and existing competition across the most popular disease indications.
- Partnerships and Collaborations: An in-depth analysis of the partnerships and collaborations that have been inked by human microbiome developers, based on several relevant parameters, such as [A] year of partnership, [B] type of partnership, [C] target indication, [D] therapeutic area, [E] type of partner and [F] most active players (in terms of number of partnerships).
- Funding and Investments: A detailed analysis of the funding and investments made in this domain, based on several relevant parameters, such as [A] year of funding, [B] type of funding, [C] amount invested, [D] purpose of funding, [E] target indication, [F] therapeutic area, [G] geography, [H] most active players and [I] leading investors.
- Case Study 1: An elaborate discussion on the various steps involved in the development and manufacturing of microbiome therapeutics, along with an indicative list of contract manufacturers, along with details on year of establishment, location of headquarters, company size, scale of operation, type of product manufactured and type of formulation. In addition, the chapter highlights key consideration for selecting a CMO / CRO partner.
- Case Study 2: assessment of the emerging role of big data, highlighting efforts focused on the development and implementation of various algorithms / tools to analyze data generated from microbiome research along with an insightful google trends analysis to demonstrate the rising interest of stakeholders in using big data tools to support microbiome research over the past decade.
Key Questions Answered in this Report
- Which are the leading companies in human microbiome market?
- Which region dominates the human microbiome market?
- What are the key trends observed in the human microbiome market?
- What factors are likely to influence the evolution of this market?
- What are the primary challenges faced by human microbiome providers?
- What is the current and future market size?
- What is the CAGR of this market?
- How is the current and future market opportunity likely to be distributed across key market segments?
Reasons to Buy this Report
- The report provides a comprehensive market analysis, offering detailed revenue projections of the overall market and its specific sub-segments. This information is valuable to both established market leaders and emerging entrants.
- The report offers stakeholders a comprehensive overview of the market, including key drivers, barriers, opportunities, and challenges. This information empowers stakeholders to stay abreast of market trends and make data-driven decisions to capitalize on growth prospects.
- The report can aid businesses in identifying future opportunities in any sector. It also helps in understanding if those opportunities are worth pursuing.
- The report helps in identifying customer demand by understanding the needs, preferences, and behavior of the target audience in order to tailor products or services effectively.
- The report equips new entrants with requisite information regarding a particular market to help them build successful business strategies.
- The report allows for more effective communication with the audience and in building strong business relations.
Additional Benefits
- Complementary PPT Insights Pack
- Complimentary Excel Data Packs for all Analytical Modules in the Report
- 15% Free Content Customization
- Detailed Report Walkthrough Session with Research Team
- Free Updated report if the report is 6-12 months old or older
TABLE OF CONTENTS
1. PREFACE
- 1.1. Introduction
- 1.2. Market Share Insights
- 1.3. Key Market Insights
- 1.4. Report Coverage
- 1.5. Key Questions Answered
- 1.6. Chapter Outlines
2. RESEARCH METHODOLOGY
- 2.1. Chapter Overview
- 2.2. Research Assumptions
- 2.2.1. Market Landscape and Market Trends
- 2.2.2. Market Forecast and Opportunity Analysis
- 2.2.3. Comparative Analysis
- 2.3. Database Building
- 2.3.1. Data Collection
- 2.3.2. Data Validation
- 2.3.3. Data Analysis
- 2.4. Project Methodology
- 2.4.1. Secondary Research
- 2.4.1.1. Annual Reports
- 2.4.1.2. Academic Research Papers
- 2.4.1.3. Company Websites
- 2.4.1.4. Investor Presentations
- 2.4.1.5. Regulatory Filings
- 2.4.1.6. White Papers
- 2.4.1.7. Industry Publications
- 2.4.1.8. Conferences and Seminars
- 2.4.1.9. Government Portals
- 2.4.1.10. Media and Press Releases
- 2.4.1.11. Newsletters
- 2.4.1.12. Industry Databases
- 2.4.1.13. Roots Proprietary Databases
- 2.4.1.14. Paid Databases and Sources
- 2.4.1.15. Social Media Portals
- 2.4.1.16. Other Secondary Sources
- 2.4.2. Primary Research
- 2.4.2.1. Types of Primary Research
- 2.4.2.1.1. Qualitative Research
- 2.4.2.1.2. Quantitative Research
- 2.4.2.1.3. Hybrid Approach
- 2.4.2.2. Advantages of Primary Research
- 2.4.2.3. Techniques for Primary Research
- 2.4.2.3.1. Interviews
- 2.4.2.3.2. Surveys
- 2.4.2.3.3. Focus Groups
- 2.4.2.3.4. Observational Research
- 2.4.2.3.5. Social Media Interactions
- 2.4.2.4. Key Opinion Leaders Considered in Primary Research
- 2.4.2.4.1. Company Executives (CXOs)
- 2.4.2.4.2. Board of Directors
- 2.4.2.4.3. Company Presidents and Vice Presidents
- 2.4.2.4.4. Research and Development Heads
- 2.4.2.4.5. Technical Experts
- 2.4.2.4.6. Subject Matter Experts
- 2.4.2.4.7. Scientists
- 2.4.2.4.8. Doctors and Other Healthcare Providers
- 2.4.2.5. Ethics and Integrity
- 2.4.2.5.1. Research Ethics
- 2.4.2.5.2. Data Integrity
- 2.4.2.1. Types of Primary Research
- 2.4.3. Analytical Tools and Databases
- 2.4.1. Secondary Research
- 2.5. Robust Quality Control
3. MARKET DYNAMICS
- 3.1. Chapter Overview
- 3.2. Forecast Methodology
- 3.2.1. Top-down Approach
- 3.2.2. Bottom-up Approach
- 3.2.3. Hybrid Approach
- 3.3. Market Assessment Framework
- 3.3.1. Total Addressable Market (TAM)
- 3.3.2. Serviceable Addressable Market (SAM)
- 3.3.3. Serviceable Obtainable Market (SOM)
- 3.3.4. Currently Acquired Market (CAM)
- 3.4. Forecasting Tools and Techniques
- 3.4.1. Qualitative Forecasting
- 3.4.2. Correlation
- 3.4.3. Regression
- 3.4.4. Extrapolation
- 3.4.5. Convergence
- 3.4.6. Sensitivity Analysis
- 3.4.7. Scenario Planning
- 3.4.8. Data Visualization
- 3.4.9. Time Series Analysis
- 3.4.10. Forecast Error Analysis
- 3.5. Key Considerations
- 3.5.1. Demographics
- 3.5.2. Government Regulations
- 3.5.3. Reimbursement Scenarios
- 3.5.4. Market Access
- 3.5.5. Supply Chain
- 3.5.6. Industry Consolidation
- 3.5.7. Pandemic / Unforeseen Disruptions Impact
- 3.6. Limitations
4. MACRO-ECONOMIC INDICATORS
- 4.1. Chapter Overview
- 4.2. Market Dynamics
- 4.2.1. Time Period
- 4.2.1.1. Historical Trends
- 4.2.1.2. Current and Forecasted Estimates
- 4.2.2. Currency Coverage
- 4.2.2.1. Major Currencies Affecting the Market
- 4.2.2.2. Factors Affecting Currency Fluctuations
- 4.2.2.3. Impact of Currency Fluctuations on the Industry
- 4.2.3. Foreign Currency Exchange Rate
- 4.2.3.1. Impact of Foreign Exchange Rate Volatility on the Market
- 4.2.3.2. Strategies for Mitigating Foreign Exchange Risk
- 4.2.4. Recession
- 4.2.4.1. Assessment of Current Economic Conditions and Potential Impact on the Market
- 4.2.4.2. Historical Analysis of Past Recessions and Lessons Learnt
- 4.2.5. Inflation
- 4.2.5.1. Measurement and Analysis of Inflationary Pressures in the Economy
- 4.2.5.2. Potential Impact of Inflation on Market Evolution
- 4.2.6. Interest Rates
- 4.2.6.1. Interest Rates and Their Impact on the Market
- 4.2.6.2. Strategies for Managing Interest Rate Risk
- 4.2.7. Commodity Flow Analysis
- 4.2.7.1. Type of Commodity
- 4.2.7.2. Origins and Destinations
- 4.2.7.3. Values and Weights
- 4.2.7.4. Modes of Transportation
- 4.2.8. Global Trade Dynamics
- 4.2.8.1. Import Scenario
- 4.2.8.2. Export Scenario
- 4.2.8.3. Trade Policies
- 4.2.8.4. Strategies for Mitigating the Risks Associated with Trade Barriers
- 4.2.8.5. Impact of Trade Barriers on the Market
- 4.2.9. War Impact Analysis
- 4.2.9.1. Russian-Ukraine War
- 4.2.9.2. Israel-Hamas War
- 4.2.10. COVID Impact / Related Factors
- 4.2.10.1. Global Economic Impact
- 4.2.10.2. Industry-specific Impact
- 4.2.10.3. Government Response and Stimulus Measures
- 4.2.10.4. Future Outlook and Adaptation Strategies
- 4.2.11. Other Indicators
- 4.2.11.1. Fiscal Policy
- 4.2.11.2. Consumer Spending
- 4.2.11.3. Gross Domestic Product
- 4.2.11.4. Employment
- 4.2.11.5. Taxes
- 4.2.11.6. Stock Market Performance
- 4.2.11.7. Cross Border Dynamics
- 4.2.1. Time Period
- 4.3. Conclusion
5. EXECUTIVE SUMMARY
- 5.1. Executive Summary: Market Landscape
- 5.2. Executive Summary: Market Trends
- 5.3. Executive Summary: Market Forecast and Opportunity Analysis
6. INTRODUCTION
- 6.1. Chapter Overview
- 6.2. Concept of Microbiota and Microbiome
- 6.2.1. Discovery of Human Microbiome
- 6.2.2. Functions of Human Microbiome
- 6.3. Overview of Gut Flora
- 6.3.1. Role of Gut Flora in Human Health
- 6.3.2. Factors Affecting Gut Flora
- 6.3.2.1. Antibiotic Consumption
- 6.3.2.2. Age and Pregnancy
- 6.3.2.2.1. Mode of Childbirth
- 6.3.2.2.2. Type of Feeding
- 6.3.2.2.3. Antibiotic Consumption by Mother
- 6.3.2.3. Stress-related Factors
- 6.3.2.4. Dietary Factors
- 6.3.2.5. Impact of Lifestyle
- 6.4. Microbiome and Associated Diseases
- 6.4.1. Cancer
- 6.4.2. Inflammatory Bowel Disease (IBD)
- 6.4.3. Obesity
- 6.4.4. Parkinson's Disease
- 6.4.5. Type 2 Diabetes
- 6.4.6. Other Disease Indications
- 6.5. Impact of Microbiota on Drug Pharmacokinetics
- 6.6. Impact of Microbiota on Therapeutic Outcomes
- 6.7. Microbiome Therapeutics
- 6.7.1. Probiotics
- 6.7.1.1. Beneficial Bacterial Strains
- 6.7.1.1.1. Lactobacilli
- 6.7.1.1.2. Bifidobacteria
- 6.7.1.1.3. Others
- 6.7.1.2. Key Therapeutic Areas
- 6.7.1.2.1. Antibiotic-Associated Diarrhea (AAD)
- 6.7.1.2.2. Bacterial Vaginosis
- 6.7.1.2.3. High Blood Pressure
- 6.7.1.2.4. Hypercholesterolemia
- 6.7.1.2.5. Infectious Childhood Diarrhea (ICD)
- 6.7.1.2.6. Inflammatory Bowel Disease (IBD)
- 6.7.1.2.7. Lactose Intolerance
- 6.7.1.2.8. Vitamin Production
- 6.7.1.2.9. Weight Management
- 6.7.1.3. Side Effects of Probiotics
- 6.7.1.1. Beneficial Bacterial Strains
- 6.7.2. Prebiotics
- 6.7.2.1. Sources of Prebiotics
- 6.7.2.2. Types of Prebiotics
- 6.7.2.2.1. Fructo-Oligosaccharides (FOS)
- 6.7.2.2.2. Galacto-Oligosaccharides (GOS)
- 6.7.2.2.3. Inulin
- 6.7.2.3. Key Therapeutic Areas
- 6.7.2.3.1. Antibiotic Associated Diarrhea (AAD)
- 6.7.2.3.2. Constipation
- 6.7.2.3.3. Gastrointestinal Diseases
- 6.7.2.3.4. Dysbiosis
- 6.7.2.4. Side Effects of Prebiotics
- 6.7.1. Probiotics
- 6.8. The Human Microbiome Project (HMP)
- 6.8.1. Project Approach
- 6.8.2. Project Initiatives
- 6.8.3. Project Achievements
- 6.9. Regulatory Guidelines for Live Biotherapeutic Products (LBPs)
- 6.10. Key Challenges Associated with the Development of Microbiome Therapeutics
- 6.11. Future Perspectives
7. HUMAN MICROBIOME THERAPEUTICS: MARKET LANDSCAPE
- 7.1. Chapter Overview
- 7.2. Human Microbiome Therapeutics: Overall Market Landscape
- 7.2.1. Analysis by Stage of Development
- 7.2.2. Analysis by Type of Molecule
- 7.2.3. Analysis by Stage of Development and Type of Molecule
- 7.2.4. Analysis by Type of Biologic
- 7.2.5. Analysis by Target Indication
- 7.2.6. Analysis by Therapeutic Area
- 7.2.7. Analysis by Route of Administration
- 7.2.8. Analysis by Type of Formulation
- 7.2.9. Analysis by Dosage Frequency
- 7.2.10. Analysis by Type of Therapy
- 7.3. Human Microbiome Therapeutics: Developer Landscape
- 7.3.1. Analysis by Year of Establishment
- 7.3.2. Analysis by Company Size
- 7.3.3. Analysis by Location of Headquarters (Region)
- 7.3.4. Analysis by Location of Headquarters (Country)
- 7.3.5. Most Active Players: Analysis by Number of Microbiome Therapeutics
8. HUMAN MICROBIOME DIAGNOSTICS AND SCREENING / PROFILING TESTS: MARKET LANDSCAPE
- 8.1. Chapter Overview
- 8.2. Overview of Microbiome Diagnostics and Screening / Profiling Tests
- 8.3. Microbiome Diagnostics and Screening / Profiling Tests: Overall Market Landscape
- 8.3.1. Analysis by Stage of Development
- 8.3.2. Analysis by Type of Sample Analyzed
- 8.3.3. Analysis by Type of Screening Technique
- 8.3.4. Analysis by Target Indication
- 8.3.5. Analysis by Therapeutic Area
- 8.3.6. Analysis by Purpose of Test
- 8.4. Microbiome Diagnostic and Screening / Profiling Tests: Provider Landscape
- 8.4.1. Analysis by Year of Establishment
- 8.4.2. Analysis by Company Size
- 8.4.3. Analysis by Location of Headquarters (Region)
- 8.4.4. Analysis by Location of Headquarters (Country)
- 8.4.5. Most Active Players: Analysis by Number of Microbiome Tests
9. HUMAN MICROBIOME FECAL MICROBOTA THERAPIES: MARKET LANDSCAPE
- 9.1. Chapter Overview
- 9.2. Introduction to Fecal Microbiota Therapies (FMT)
- 9.3. Historical Overview
- 9.4. Fecal Microbiota Therapies: Procedure and Clinical Relevance
- 9.4.1. Donor Selection
- 9.4.2. Administration Procedure
- 9.4.3. Routes of Administration
- 9.4.4. Consequences and Adverse Events
- 9.4.5. Clinical Guidelines Associated with FMT
- 9.5. Regulatory Guidelines Related to Fecal Microbiota Therapies
- 9.6. Insurance Coverage for Fecal Microbiota Therapies
- 9.7. Fecal Microbiota Therapies: Overall Market Landscape
- 9.7.1. Marketed / Development Pipeline
- 9.7.1.1. Analysis by Application Area
- 9.7.1.2. Analysis by Status of Development
- 9.7.1.3. Analysis by Target Indication
- 9.7.1.4. Analysis by Therapeutic Area
- 9.7.1.5. Analysis by Route of Administration
- 9.7.2. Fecal Microbiota Therapies: Developer Landscape
- 9.7.2.1. Analysis by Year of Establishment
- 9.7.2.2. Analysis by Company Size
- 9.7.2.3. Analysis by Location of Headquarters (Region)
- 9.7.2.4. Analysis by Location of Headquarters (Country)
- 9.7.1. Marketed / Development Pipeline
10. HUMAN MICROBIOME THERAPEUTICS: COMPANY AND DRUG PROFILES
- 10.1. Chapter Overview
- 10.2. Ferring Pharmaceuticals
- 10.2.1. Company Overview
- 10.2.2. Financial Information
- 10.2.3. Microbiome-Based Product Portfolio
- 10.2.3.1. REBYOTA
- 10.2.3.1.1. Drug Overview
- 10.2.3.1.2. Current Status of Development
- 10.2.3.1.3. Clinical Studies
- 10.2.3.1. REBYOTA
- 10.2.4. Recent Developments and Future Outlook
- 10.3. Infant Bacterial Therapeutics
- 10.4. MaaT Pharma
- 10.5. Mikrobiomik
- 10.6. Seres Therapeutics
- 10.7. OxThera
- 10.8. Vedanta Biosciences
- 10.9. Zhiyi Biotech
11. MICROBIOME DIAGNOSTIC AND SCREENING / PROFILING TEST PROVIDERS: COMPANY PROFILES
- 11.1. Chapter Overview
- 11.2. Becton, Dickinson and Company
- 11.2.1. Company Overview
- 11.2.2. Financial Information
- 11.2.3. Microbiome Diagnostic Test Portfolio
- 11.2.4. Recent Developments and Future Outlook
- 11.3. Biome Diagnostics
- 11.4. GoodGut
- 11.5. NutriPATH
- 11.6. Tiny Health
12. CLINICAL TRIAL ANALYSIS
- 12.1. Chapter Overview
- 12.2. Scope and Methodology
- 12.3. Fecal Microbiota Therapies: Clinical Trial Analysis
- 12.3.1. Analysis by Trial Registration Year
- 12.3.2. Analysis of Enrolled Patient Population by Trial Registration Year
- 12.3.3. Analysis by Trial Status
- 12.3.4. Analysis of Enrolled Patient Population by Trial Status
- 12.3.5. Analysis by Trial Registration Year and Trial Status
- 12.3.6. Analysis by Trial Phase
- 12.3.7. Analysis of Enrolled Patient Population by Trial Phase
- 12.3.8. Analysis by Type of Sponsor / Collaborator
- 12.3.9. Analysis by Study Design
- 12.3.10. Analysis by Gender
- 12.3.11. Leading Industry Players: Analysis by Number of Registered Trials
- 12.3.12. Leading Non-industry Players: Analysis by Number of Registered Trials
- 12.3.13. Analysis by Trial Status, Trial Phase and Geography
- 12.3.14. Analysis by Geography
- 12.3.15. Analysis by Trial Status and Geography
- 12.3.16. Analysis of Enrolled Patient Population by Trial Status and Geography
13. ATTRACTIVENESS COMPETITIVENESS (AC) MATRIX
- 13.1. Chapter Overview
- 13.2. AC Matrix: An Overview
- 13.2.1. Strong Business Units
- 13.2.2. Average Business Units
- 13.2.3. Weak Business Units
- 13.3. AC Matrix: Analytical Methodology
- 13.4. AC Matrix: Plotting the Information
- 13.5. AC Matrix: Analyzing the Data
- 13.5.1. Strong Business Units
- 13.5.2. Average Business Units
- 13.5.3. Weak Business Units
- 13.6. Concluding Remarks
14. START-UP HEALTH INDEXING
- 14.1. Chapter Overview
- 14.2. Scope and Methodology
- 14.3. Benchmarking of Start-ups
- 14.3.1. Analysis by Portfolio Strength
- 14.3.2. Analysis by Pipeline Maturity
- 14.3.3. Analysis by Indication Diversity
- 14.3.4. Analysis by Funding Amount
- 14.3.5. Analysis by Partnership Activity
- 14.3.6. Start-up Health Indexing: Roots Analysis Perspective
- 14.3.7. Start-up Health Indexing: Leading Companies
15. CASE STUDY: KEY THERAPEUTIC AREAS
- 15.1. Chapter Overview
- 15.2. Metabolic Disorders
- 15.2.1. Diabetes
- 15.2.1.1. Disease Description
- 15.2.1.2. Associated Health Risks / Complications
- 15.2.1.3. Epidemiology
- 15.2.1.4. Disease Diagnosis
- 15.2.1.5. Current Treatment Options
- 15.2.1.5.1. Insulin Therapies
- 15.2.1.5.2. Non-Insulin Therapies
- 15.2.1.6. Side Effects of Current Treatment Options
- 15.2.1.7. Microbiome Therapeutics for Diabetes
- 15.2.2. Lactose Intolerance
- 15.2.2.1. Disease Description
- 15.2.2.2. Epidemiology
- 15.2.2.3. Current Treatment Options
- 15.2.2.4. Microbiome Therapeutics for Lactose Intolerance
- 15.2.3. Nonalcoholic Steatohepatitis (NASH)
- 15.2.3.1. Disease Description
- 15.2.3.2. Epidemiology
- 15.2.3.3. Current Treatment Options
- 15.2.3.4. Microbiome Therapeutics for NASH
- 15.2.4. Primary Hyperoxaluria
- 15.2.4.1. Disease Description
- 15.2.4.2. Epidemiology
- 15.2.4.3. Current Treatment Options
- 15.2.4.4. Microbiome Therapeutics for Primary Hyperoxaluria
- 15.2.5. Obesity
- 15.2.5.1. Disease Description
- 15.2.5.2. Epidemiology
- 15.2.5.3. Current Treatment Options
- 15.2.5.4. Side Effects of Current Treatment Options
- 15.2.5.5. Microbiome Therapeutics for Obesity
- 15.2.1. Diabetes
- 15.3. Digestive and Gastrointestinal Disorders
- 15.3.1. Crohn's Disease
- 15.3.1.1. Disease Description
- 15.3.1.2. Epidemiology
- 15.3.1.3. Current Treatment Options
- 15.3.1.4. Side Effects of Current Treatment Options
- 15.3.1.5. Microbiome Therapeutics for Crohn's Disease
- 15.3.2. Irritable Bowel Syndrome (IBS)
- 15.3.2.1. Disease Description
- 15.3.2.2. Epidemiology
- 15.3.2.3. Current Treatment Options
- 15.3.2.4. Microbiome Therapeutics for IBS
- 15.3.3. Ulcerative Colitis
- 15.3.3.1. Disease Description
- 15.3.3.2. Epidemiology
- 15.3.3.3. Current Treatment Options
- 15.3.3.4. Side Effects of Current Treatment Options
- 15.3.3.5. Microbiome Therapeutics for Ulcerative Colitis
- 15.3.1. Crohn's Disease
- 15.4. Oncological Indications
- 15.4.1. Colorectal Cancer
- 15.4.1.1. Disease Description
- 15.4.1.2. Epidemiology
- 15.4.1.3. Current Treatment Options
- 15.4.1.4. Side Effects of Current Treatments
- 15.4.1.5. Microbiome Therapeutics for Colorectal Cancer
- 15.4.2. Lung Cancer
- 15.4.2.1. Disease Description
- 15.4.2.2. Epidemiology
- 15.4.2.3. Current Treatment Options
- 15.4.2.4. Side Effects of Current Treatment Options
- 15.4.2.5. Microbiome Therapeutics for Lung Cancer
- 15.4.1. Colorectal Cancer
- 15.5. Dermatological Disorders
- 15.5.1. Acne Vulgaris
- 15.5.1.1. Disease Description
- 15.5.1.2. Epidemiology
- 15.5.1.3. Current Treatment Options
- 15.5.1.4. Side Effects of Current Treatment Options
- 15.5.1.5. Microbiome Therapeutics for Acne Vulgaris
- 15.5.1. Acne Vulgaris
- 15.6. Infectious Diseases
- 15.6.1. Clostridium Difficile Infections (CDIs)
- 15.6.1.1. Disease Description
- 15.6.1.2. Epidemiology
- 15.6.1.3. Disease Diagnosis
- 15.6.1.4. Current Treatment Options
- 15.6.1.5. Side Effects of Current Treatment Options
- 15.6.1.6. Microbiome Therapeutics for CDI
- 15.6.2. Bacterial Vaginosis
- 15.6.2.1. Disease Description
- 15.6.2.2. Epidemiology
- 15.6.2.3. Current Treatment Options
- 15.6.2.4. Side Effects of Current Treatment Options
- 15.6.2.5. Microbiome Therapeutics for Bacterial Vaginosis
- 15.6.1. Clostridium Difficile Infections (CDIs)
16. PARTNERSHIPS AND COLLABORATIONS
- 16.1. Chapter Overview
- 16.2. Partnership Models
- 16.3. Human Microbiome: List of Partnerships and Collaborations
- 16.4. Analysis by Year of Partnership
- 16.5. Analysis by Type of Partnership
- 16.6. Analysis by Year and Type of Partnership
- 16.7. Analysis by Target Indication
- 16.8. Analysis by Therapeutic Area
- 16.9. Analysis by Type of Partnership and Therapeutic Area
- 16.10. Analysis by Type of Partner
- 16.11. Most Active Players: Analysis by Number of Partnerships
- 16.12. Analysis by Geography
- 16.12.1. Local and International Deals
- 16.12.2. Intracontinental and Intercontinental Deals
17. FUNDING AND INVESTMENTS
- 17.1. Chapter Overview
- 17.2. Funding Models
- 17.3. Human Microbiome: List of Funding and Investments
- 17.3.1. Analysis of Funding Instances by Year of Funding
- 17.3.2. Analysis of Amount Invested by Year of Funding
- 17.3.3. Analysis by Type of Funding
- 17.3.4. Analysis by Year and Type of Funding
- 17.3.5. Analysis by Amount Invested and Type of Funding
- 17.3.6. Analysis by Purpose of Funding
- 17.3.7. Analysis by Target Indication
- 17.3.8. Analysis by Therapeutic Area
- 17.3.9. Analysis by Geography
- 17.3.10. Most Active Players: Analysis by Number of Instances
- 17.3.11. Most Active Players: Analysis by Amount Invested
- 17.3.12. Leading Investors: Analysis by Number of Instances
- 17.3.13. Funding and Investment Summary
18. CASE STUDY: CONTRACT SERVICES FOR MICROBIOME THERAPEUTICS AND LIVE BIOTHERAPEUTICS
- 18.1. Chapter Overview
- 18.2. Manufacturing Microbiome Therapeutics
- 18.2.1. Key Steps Involved
- 18.2.2. Associated Challenges
- 18.2.3. Growing Demand for Contract Manufacturing Services
- 18.2.4. Contract Manufacturing Organizations (CMOs)
- 18.2.4.1. Introduction to Contract Manufacturing
- 18.2.5. Microbiome Therapeutics: List of Contract Manufacturing Providers
- 18.2.5.1. Analysis by Year of Establishment
- 18.2.5.2. Analysis by Company Size
- 18.2.5.3. Analysis by Location of Headquarters
- 18.2.5.4. Analysis by Scale of Operation
- 18.2.5.5. Analysis by Type of Product Manufactured
- 18.2.5.6. Analysis by Type of Formulation
- 18.2.5.7. Analysis by Scale of Operation and Type of Formulation
- 18.3. Key Considerations for Selecting a CMO / CRO Partner
19. CASE STUDY: BIG DATA AND MICROBIOME THERAPEUTICS
- 19.1. Chapter Overview
- 19.2. Introduction to Big Data
- 19.3. Internet of Things (IoT)
- 19.4. Growing Interest in Big Data: Google Trends Analysis
- 19.5. Key Application Areas
- 19.6. Big Data in Microbiome Research
- 19.6.1. Microbiome Data and Personalized Medicine
- 19.6.2. Microbiome-related Data Management Challenges
- 19.6.3. National Microbiome Data Center
- 19.7. Big Data Services for Microbiome Research: List of Companies
- 19.8. Big Data Services for Microbiome Research: Profiles of Key Players
- 19.8.1. Human Longevity
- 19.8.1.1. Company Overview
- 19.8.1.2. Technology and Service Portfolio
- 19.8.1.3. Recent Developments and Future Outlook
- 19.8.2. Resilient Biotics
- 19.8.2.1. Company Overview
- 19.8.2.2. Technology and Service Portfolio
- 19.8.2.3. Recent Developments and Future Outlook
- 19.8.3. Resphera Biosciences
- 19.8.3.1. Company Overview
- 19.8.3.2. Technology and Service Portfolio
- 19.8.3.3. Recent Developments and Future Outlook
- 19.8.1. Human Longevity
20. HUMAN MICROBIOME THERAPEUTICS MARKET
- 20.1. Chapter Overview
- 20.2. Assumptions and Methodology
- 20.3. Global Human Microbiome Therapeutics Market: Forecasted Estimates (till 2035)
- 20.4. Human Microbiome Market: Distribution by Type of Product
- 20.4.1. Therapeutics: Forecasted Estimates (till 2035)
- 20.4.2. Diagnostics: Forecasted Estimates (till 2035)
- 20.4.3. Fecal Microbiota Therapies: Forecasted Estimates (till 2035)
- 20.4.4. Scenario Analysis
- 20.4.4.1. Conservative Scenario
- 20.4.4.2. Optimistic Scenario
- 20.5. Key Market Segmentations
21. HUMAN MICROBIOME THERAPEUTICS MARKET, BY TYPE OF BIOLOGIC
- 21.1. Chapter Overview
- 21.2. Assumptions and Methodology
- 21.3. Distribution by Type of Biologic
- 21.3.1. Live Biotherapeutics: Forecasted Estimates (till 2035)
- 21.3.2. Others: Forecasted Estimates (till 2035)
- 21.4. Data Triangulation and Validation
22. HUMAN MICROBIOME THERAPEUTICS MARKET, BY ROUTE OF ADMINISTRATION
- 22.1. Chapter Overview
- 22.2. Key Assumptions and Methodology
- 22.3. Distribution by Route of Administration
- 22.3.1. Oral Route: Forecasted Estimates (till 2035)
- 22.3.2. Rectal Route: Forecasted Estimates (till 2035)
- 22.4. Data Triangulation and Validation
23. HUMAN MICROBIOME THERAPEUTICS MARKET, BY DRUG FORMULATION
- 23.1. Chapter Overview
- 23.2. Key Assumptions and Methodology
- 23.3. Distribution by Drug Formulation
- 23.3.1. Capsules: Forecasted Estimates (till 2035)
- 23.3.2. Suspensions: Forecasted Estimates (till 2035)
- 23.3.3. Enemas: Forecasted Estimates (till 2035)
- 23.3.4. Powders: Forecasted Estimates (till 2035)
- 23.4. Data Triangulation and Validation
24. HUMAN MICROBIOME THERAPEUTICS MARKET, BY TARGET INDICATION
- 24.1. Chapter Overview
- 24.2. Key Assumptions and Methodology
- 24.3. Distribution by Target Indication
- 24.3.1. Clostridium Difficile Infection
- 24.3.2. Necrotizing Enterocolitis
- 24.3.3. Irritable Bowel Syndrome
- 24.3.4. Acute Graft Versus Host Disease
- 24.4. Data Triangulation and Validation
25. HUMAN MICROBIOME THERAPEUTICS MARKET, BY TARGET THERAPEUTIC AREA
- 25.1. Chapter Overview
- 25.2. Key Assumptions and Methodology
- 25.3. Distribution by Therapeutic Area
- 25.3.1. Infectious Diseases
- 25.3.2. Gastrointestinal Disorders
- 25.3.3. Rare Disorders
- 25.4. Data Triangulation and Validation
26. HUMAN MICROBIOME THERAPEUTICS MARKET, BY GEOGRAPHICAL REGIONS
- 26.1. Chapter Overview
- 26.2. Key Assumptions and Methodology
- 26.3. Distribution by Geographical Regions
- 26.3.1. North America
- 26.3.2. Europe
- 26.3.3. Asia-Pacific
- 26.3.4. Latin America
- 26.3.5. Middle East and North Africa
- 26.4. Market Dynamics Assessment
- 26.4.1. Penetration Growth (P-G) Matrix
- 26.4.2. Market Movement Analysis
- 26.5. Data Triangulation and Validation
27. HUMAN MICROBIOME DIAGNOSTICS MARKET
- 27.1. Chapter Overview
- 27.2. Assumptions and Methodology
- 27.3. Global Human Microbiome Diagnostics Market: Forecasted Estimates (till 2035)
- 27.3.1. Scenario Analysis
- 27.4. Key Market Segmentations
28. HUMAN MICROBIOME DIAGNOSTICS MARKET, BY TARGET INDICATION
- 28.1. Chapter Overview
- 28.2. Key Assumptions and Methodology
- 28.3. Market Distribution by Target Indication
- 28.3.1. Diabetes Mellitus: Forecasted Estimates (till 2035)
- 28.3.2. Irritable Bowel Syndrome: Forecasted Estimates (till 2035)
- 28.3.3. Irritable Bowel Disease: Forecasted Estimates (till 2035)
- 28.3.4. Colorectal Cancer: Forecasted Estimates (till 2035)
- 28.4. Data Triangulation and Validation
29. HUMAN MICROBIOME DIAGNOSTICS MARKET, BY TARGET THERAPEUTIC AREA
- 29.1. Chapter Overview
- 29.2. Key Assumptions and Methodology
- 29.3. Market Distribution by Therapeutic Area
- 29.3.1. Gastrointestinal Disorders: Forecasted Estimates (till 2035)
- 29.3.2. Metabolic Disorders: Forecasted Estimates (till 2035)
- 29.3.3. Oncological Disorders: Forecasted Estimates (till 2035)
- 29.4. Data Triangulation and Validation
30. HUMAN MICROBIOME DIAGNOSTICS MARKET, BY GEOGRAPHICAL REGIONS
- 30.1. Chapter Overview
- 30.2. Key Assumptions and Methodology
- 30.3. Market Distribution by Geographical Regions
- 30.3.1. North America: Forecasted Estimates (till 2035)
- 30.3.2. Europe: Forecasted Estimates (till 2035)
- 30.3.3. Asia-Pacific: Forecasted Estimates (till 2035)
- 30.3.4. Latin America: Forecasted Estimates (till 2035)
- 30.3.5. Middle East and North Africa: Forecasted Estimates (till 2035)
- 30.4. Data Triangulation and Validation
- 30.5. Market Dynamics Assessment
- 30.5.1. Penetration Growth (P-G) Matrix
- 30.5.2. Market Movement Analysis
- 30.6. Data Triangulation and Validation
31. HUMAN MICROBIOME FECAL MICROBIOTA THERAPIES MARKET
- 31.1. Chapter Overview
- 31.2. Assumptions and Methodology
- 31.3. Global Market: Forecasted Estimates (till 2035)
- 31.3.1. Scenario Analysis
- 31.3.1.1. Conservative Scenario
- 31.3.1.2. Optimistic Scenario
- 31.3.1. Scenario Analysis
- 31.4. Key Market Segmentations
32. HUMAN MICROBIOME FECAL MICROBIOTA THERAPIES MARKET, BY GEOGRAPHIC REGIONS
- 32.1. Chapter Overview
- 32.2. Key Assumptions and Methodology
- 32.3. Distribution by Geographic Regions
- 32.3.1. North America
- 32.3.2. Europe
- 32.3.3. Asia-Pacific
- 32.3.4. Latin America
- 32.3.5. Middle East and North Africa
- 32.4. Data Triangulation and Validation
- 32.5. Market Dynamics Assessment
- 32.5.1. Penetration Growth (P-G) Matrix
- 32.5.2. Market Movement Analysis
- 32.6. Data Triangulation and Validation
33. HUMAN MICROBIOME THERAPEUTICS MARKET OPPORTUNITY ANALYSIS: NORTH AMERICA
- 33.1. Market Distribution by Type of Biologic
- 33.2. Market Distribution by Route of Administration
- 33.3. Market Distribution by Drug Formulation
- 33.4. Market Distribution by Target Indication
- 33.5. Market Distribution by Target Therapeutic Area
34. HUMAN MICROBIOME THERAPEUTICS MARKET OPPORTUNITY ANALYSIS: EUROPE
- 34.1. Market Distribution by Type of Biologic
- 34.2. Market Distribution by Route of Administration
- 34.3. Market Distribution by Drug Formulation
- 34.4. Market Distribution by Target Indication
- 34.5. Market Distribution by Target Therapeutic Area
35. HUMAN MICROBIOME THERAPEUTICS MARKET OPPORTUNITY ANALYSIS: ASIA-PACIFIC
- 35.1. Market Distribution by Type of Biologic
- 35.2. Market Distribution by Route of Administration
- 35.3. Market Distribution by Drug Formulation
- 35.4. Market Distribution by Target Indication
- 35.5. Market Distribution by Target Therapeutic Area
36. HUMAN MICROBIOME THERAPEUTICS MARKET OPPORTUNITY ANALYSIS: LATIN AMERICA
- 36.1. Market Distribution by Type of Biologic
- 36.2. Market Distribution by Route of Administration
- 36.3. Market Distribution by Drug Formulation
- 36.4. Market Distribution by Target Indication
- 36.5. Market Distribution by Target Therapeutic Area
37. HUMAN MICROBIOME THERAPEUTICS MARKET OPPORTUNITY ANALYSIS: MIDDLE EAST AND NORTH AFRICA
- 37.1. Market Distribution by Type of Biologic
- 37.2. Market Distribution by Route of Administration
- 37.3. Market Distribution by Drug Formulation
- 37.4. Market Distribution by Target Indication
- 37.5. Market Distribution by Target Therapeutic Area
38. HUMAN MICROBIOME DIAGNOSTICS MARKET OPPORTUNITY ANALYSIS: NORTH AMERICA
- 38.1. Distribution by Target Indication
- 38.2. Distribution by Target Therapeutic Area
39. HUMAN MICROBIOME DIAGNOSTICS MARKET OPPORTUNITY ANALYSIS: EUROPE
- 39.1. Distribution by Target Indication
- 39.2. Distribution by Target Therapeutic Area
40. HUMAN MICROBIOME DIAGNOSTICS MARKET OPPORTUNITY ANALYSIS: ASIA-PACIFIC
- 40.1. Distribution by Target Indication
- 40.2. Distribution by Target Therapeutic Area
41. HUMAN MICROBIOME DIAGNOSTICS MARKET OPPORTUNITY ANALYSIS: LATIN AMERICA
- 41.1. Distribution by Target Indication
- 41.2. Distribution by Target Therapeutic Area
42. HUMAN MICROBIOME DIAGNOSTICS MARKET OPPORTUNITY ANALYSIS: MIDDLE EAST AND NORTH AFRICA
- 42.1. Distribution by Target Indication
- 42.2. Distribution by Target Therapeutic Area
43. CONCLUDING INSIGHTS
44. EXECUTIVE INSIGHTS
- 44.1. Chapter Overview
- 44.2. Company A (Mid-sized Company, UK)
- 44.2.1. Company Snapshot
- 44.2.2. Interview Transcript: Former Senior Manager, Corporate Development
- 44.3. Company B (Small Company, US)
- 44.3.1. Company Snapshot
- 44.3.2. Interview Transcript: Co-founder and Chairman
- 44.4. Company C (Small Company, US)
- 44.4.1. Company Snapshot
- 44.4.2. Interview Transcript: Chief Executive Officer
- 44.5. Company D (Large Company, US)
- 44.5.1. Company Snapshot
- 44.5.2. Interview Transcript: Senior Scientist
- 44.6. Company E (Small Company, Taiwan)
- 44.6.1. Company Snapshot
- 44.6.2. Interview Transcript: President
- 44.7. Company F (Small Company, US)
- 44.7.1. Company Snapshot
- 44.7.2. Interview Transcript: Vice President, Business Development
- 44.8. Company G (Mid-sized Company, Israel)
- 44.8.1. Company Snapshot
- 44.8.2. Interview Transcript: Chief Business Officer
- 44.9. Company H (Small Company, US)
- 44.9.1. Company Snapshot
- 44.9.2. Interview Transcript: Former Vice President, Sales and Business Development
- 44.10. Company I (Small Company, Belgium)
- 44.10.1. Company Snapshot
- 44.10.2. Interview Transcript: Co-founder and Chief Executive Officer
- 44.11. Company J (Small Company, US)
- 44.11.1. Company Snapshot
- 44.11.2. Interview Transcript: Co-founder and Chief Executive Officer
- 44.12. Company K (Small Company, US)
- 44.12.1. Company Snapshot
- 44.12.2. Interview Transcript: Co-founder and Chief Executive Officer
- 44.13. Company L (Mid-sized Company, US)
- 44.13.1. Company Snapshot
- 44.13.2. Interview Transcript: Ex-Co-founder and Vice President of Innovation
- 44.14. Company M (Small Company, US)
- 44.14.1. Company Snapshot
- 44.14.2. Interview Transcript: Vice President & Chief Operating Officer
- 44.15. Company N (Mid-sized Company, US)
- 44.15.1. Company Snapshot
- 44.15.2. Interview Transcript: Former Vice President, Operations
- 44.16. Company O (Small Company, US)
- 44.16.1. Company Snapshot
- 44.16.2. Interview Transcript: Former President and Chief Executive Officer
- 44.17. Company P (Small Company, US)
- 44.17.1. Company Snapshot
- 44.17.2. Interview Transcript: Former Chief Scientific Officer and Vice President, Research
- 44.18. Company Q (Small Company, France)
- 44.18.1. Company Snapshot
- 44.18.2. Interview Transcript: Former Chief Strategy Officer
45. APPENDIX I: TABULATED DATA
46. APPENDIX II: LIST OF COMPANIES AND ORGANIZATIONS
List of Tables
- Table 6.1 Types of Microbiota in the Gastrointestinal Tract
- Table 6.2 Common Instances of Misuse of Antibiotics
- Table 6.3 Impact of Antibiotics on Intestinal Microflora
- Table 6.4 List of Microorganisms Classified as Class I Carcinogens by the IARC
- Table 6.5 Relationship Between Microbiome and Disease Progression
- Table 6.6 Impact of Drug-Microbiome Interactions
- Table 6.7 List of Foods Containing Prebiotics
- Table 7.1 Microbiome Therapeutics: Information on Type of Molecule and Route of Administration
- Table 7.2 Microbiome Therapeutics: Additional Information
- Table 7.3 Microbiome Therapeutics: List of Drug Developers
- Table 8.1 Microbiome Diagnostics and Screening / Profiling Tests: Marketed and Development Pipeline
- Table 8.2 Microbiome Diagnostics and Screening / Profiling Tests: List of Developers
- Table 9.1 Comparison between Various Routes of Administration of FMT
- Table 9.2 FMT: Summary of Clinical Guidelines
- Table 9.3 FMT: Summary of Insurance Coverage Payer
- Table 9.4 FMT: Marketed and Development Pipeline
- Table 9.5 FMT: List of Developers
- Table 10.1 Ferring Pharmaceuticals: Company Overview
- Table 10.2 Ferring Pharmaceuticals: Microbiome-Based Product Portfolio
- Table 10.3 REBYOTA: Current Status of Development
- Table 10.4 REBYOTA: Clinical Studies
- Table 10.5 Ferring Pharmaceuticals: Recent Developments and Future Outlook
- Table 10.6 Infant Bacterial Therapeutics: Company Overview
- Table 10.7 Infant Bacterial Therapeutics: Microbiome-Based Product Portfolio
- Table 10.8 IBP-9414: Current Status of Development
- Table 10.9 IBP-9414: Clinical Studies
- Table 10.10 Infant Bacterial Therapeutics: Recent Developments and Future Outlook
- Table 10.11 MaaT Pharma: Company Overview
- Table 10.12 MaaT Pharma: Microbiome-Based Product Portfolio
- Table 10.13 MaaT013: Current Status of Development
- Table 10.14 MaaT013: Clinical Studies
- Table 10.15 MaaT Pharma: Recent Developments and Future Outlook
- Table 10.16 Mikrobiomik: Company Overview
- Table 10.17 Mikrobiomik: Microbiome-Based Product Portfolio
- Table 10.18 MBK-01: Current Status of Development
- Table 10.19 MBK-01: Clinical Studies
- Table 10.20 Mikrobiomik: Recent Developments and Future Outlook
- Table 10.21 Seres Therapeutics: Company Overview
- Table 10.22 Seres Therapeutics: Microbiome-Based Product Portfolio
- Table 10.23 SER-109 / VOWST: Current Status of Development
- Table 10.24 SER-109 / VOWST: Clinical Studies
- Table 10.25 Seres Therapeutics: Recent Developments and Future Outlook
- Table 10.26 OxThera: Company Overview
- Table 10.27 OxThera: Microbiome-Based Product Portfolio
- Table 10.28 Oxabact: Current Status of Development
- Table 10.29 Oxabact: Clinical Studies
- Table 10.30 OxThera: Recent Developments and Future Outlook
- Table 10.31 Vedanta Biosciences: Company Overview
- Table 10.32 Vedanta Biosciences: Microbiome-Based Product Portfolio
- Table 10.33 VE303: Current Status of Development
- Table 10.34 VE303: Clinical Studies
- Table 10.35 Vedanta Biosciences: Recent Developments and Future Outlook
- Table 10.36 Zhiyi Biotech: Company Overview
- Table 10.37 Zhiyi Biotech: Microbiome-Based Product Portfolio
- Table 10.38 SK08: Current Status of Development
- Table 10.39 SK08: Clinical Studies
- Table 10.40 Zhiyi Biotech: Recent Developments and Future Outlook
- Table 11.1 Becton, Dickinson and Company: Company Overview
- Table 11.2 Becton, Dickinson and Company: Microbiome Test Portfolio
- Table 11.3 Becton, Dickinson and Company: Recent Developments and Future Outlook
- Table 11.4 Biome Diagnostics: Company Overview
- Table 11.5 Biome Diagnostics: Microbiome Test Portfolio
- Table 11.6 Biome Diagnostics: Recent Developments and Future Outlook
- Table 11.7 GoodGut: Company Overview
- Table 11.8 GoodGut: Microbiome Test Portfolio
- Table 11.9 GoodGut: Recent Developments and Future Outlook
- Table 11.10 NutriPATH: Company Overview
- Table 11.11 NutriPATH: Microbiome Test Portfolio
- Table 11.12 NutriPATH: Recent Developments and Future Outlook
- Table 11.13 Tiny Health: Company Overview
- Table 11.14 Tiny Health: Microbiome Test Portfolio
- Table 11.15 Tiny Health: Recent Developments and Future Outlook
- Table 12.1 Fecal Microbiota Transplant: List of Registered Clinical Trials
- Table 15.1 Diabetes: Current Treatment Options
- Table 15.2 Diabetes: Side Effects of Current Treatment Options
- Table 15.3 Microbiome Therapeutics Candidates for Diabetes
- Table 15.4 Microbiome Therapeutics Candidates for Lactose Intolerance
- Table 15.5 Microbiome Therapeutics Candidates for NASH
- Table 15.6 Microbiome Therapeutics Candidates for Primary Hyperoxaluria
- Table 15.7 Obesity: Side Effects of Current Treatment Options
- Table 15.8 Microbiome Therapeutic Candidates for Obesity
- Table 15.9 Crohn's Disease: Current Treatment Options
- Table 15.10 Crohn's Disease: Side Effects of Current Treatment Options
- Table 15.11 Microbiome Therapeutics Candidates for Crohn's Disease
- Table 15.12 IBS: Current Treatment Options
- Table 15.13 Microbiome Therapeutics Candidates for IBS
- Table 15.14 Ulcerative Colitis: Current Treatment Options
- Table 15.15 Ulcerative Colitis: Side Effects of Current Treatment Options
- Table 15.16 Microbiome Therapeutics Candidates for Ulcerative Colitis
- Table 15.17 Colorectal Cancer: Side Effects of Current Treatment Options
- Table 15.18 Microbiome Therapeutics Pipeline for Colorectal Cancer
- Table 15.19 Lung Cancer: Current Treatment Options
- Table 15.20 Lung Cancer: Side Effects of Current Treatment Options
- Table 15.21 Microbiome Therapeutics Candidates for Lung Cancer
- Table 15.22 Acne Vulgaris: Current Treatment Options
- Table 15.23 Acne Vulgaris: Side Effects of Current Treatment Options
- Table 15.24 Microbiome Therapeutics Candidates for Acne Vulgaris
- Table 15.25 CDI: Diagnostic Testing
- Table 15.26 CDI: Severity Scoring System and Treatment Options
- Table 15.27 CDI: Side Effects of Current Treatment Options
- Table 15.28 Microbiome Therapeutics Candidates for CDI
- Table 15.29 Bacterial Vaginosis: Current Treatment Options
- Table 15.30 Bacterial Vaginosis: Side Effects of Current Treatment Options
- Table 15.31 Microbiome Therapeutics Candidates for Bacterial Vaginosis
- Table 16.1 Human Microbiome: List of Partnerships and Collaborations, Since 2022
- Table 17.1 Human Microbiome: Funding and Investments, Information on Funding Type, Year, Amount and Investor, Since 2022
- Table 17.2 Human Microbiome: Funding and Investments, Information on Type of Product, Target Indication and Focus Area, Since 2022
- Table 17.3 Human Microbiome: Funding and Investments, Information on Type of Investor and Location of Headquarters, Since 2022
- Table 18.1 Microbiome Contract Manufacturers: Information on Year of Establishment, Headquarters, Company Size, Accreditation Received and Scale of Operation
- Table 18.2 Microbiome Contract Manufacturers: Information on Type of Product Manufactured
- Table 18.3 Microbiome Contract Manufacturers: Information on Type of Formulation
- Table 18.4 Comparison of Key Factors for the Selection of Contract Service Providers: Harvey Ball Analysis
- Table 19.1 List of Companies Using Big Data for Microbiome Research
- Table 19.2 Human Longevity: Partnerships and Collaborations
- Table 19.3 Human Longevity: Venture Capital Funding
- Table 19.4 Resilient Biotics: Venture Capital Funding
- Table 20.1 List of Companies Engaged in the Development of Microbiome Products for Other Applications
- Table 20.2 Pipeline of Microbiome Based Consumer Products, Medical Foods and Supplements
- Table 44.1 Company A: Company Snapshot
- Table 44.2 Company B: Company Snapshot
- Table 44.3 Company C: Company Snapshot
- Table 44.4 Company D: Company Snapshot
- Table 44.5 Company E: Company Snapshot
- Table 44.6 Company F: Company Snapshot
- Table 44.7 Company G: Company Snapshot
- Table 44.8 Company H: Company Snapshot
- Table 44.9 Company I: Company Snapshot
- Table 44.10 Company J: Company Snapshot
- Table 44.11 Company K: Company Snapshot
- Table 44.12 Company L: Company Snapshot
- Table 44.13 Company M: Company Snapshot
- Table 44.14 Company N: Company Snapshot
- Table 44.15 Company O: Company Snapshot
- Table 44.16 Company P: Company Snapshot
- Table 44.17 Company Q: Company Snapshot
- Table 45.1 Microbiome Therapeutics: Distribution by Stage of Development
- Table 45.2 Microbiome Therapeutics: Distribution by Type of Molecule
- Table 45.3 Microbiome Therapeutics: Distribution by Stage of Development and Type of Molecule
- Table 45.4 Microbiome Therapeutics: Distribution by Type of Biologic
- Table 45.5 Microbiome Therapeutics: Distribution by Target Indication
- Table 45.6 Microbiome Therapeutics: Distribution by Therapeutic Area
- Table 45.7 Microbiome Therapeutics: Distribution by Route of Administration
- Table 45.8 Microbiome Therapeutics: Distribution by Type of Formulation
- Table 45.9 Microbiome Therapeutics: Distribution by Dose Frequency
- Table 45.10 Microbiome Therapeutics: Distribution by Type of Therapy
- Table 45.11 Microbiome Therapeutic Developers: Distribution by Year of Establishment
- Table 45.12 Microbiome Therapeutic Developers: Distribution by Company Size
- Table 45.13 Microbiome Therapeutic Developers: Distribution by Location of Headquarters (Region)
- Table 45.14 Microbiome Therapeutic Developers: Distribution by Location of Headquarters (Country)
- Table 45.15 Microbiome Therapeutic Developers: Distribution by Most Active Players
- Table 45.16 Microbiome Diagnostics and Screening / Profiling Tests: Distribution by Stage of Development
- Table 45.17 Microbiome Diagnostics and Screening / Profiling Tests: Distribution by Type of Sample Analyzed
- Table 45.18 Microbiome Diagnostics and Screening / Profiling Tests: Distribution by Type of Screening Technique
- Table 45.19 Microbiome Diagnostics and Screening / Profiling Tests: Distribution by Target Indication
- Table 45.20 Microbiome Diagnostics and Screening / Profiling Tests: Distribution by Therapeutic Area
- Table 45.21 Microbiome Diagnostics and Screening / Profiling Tests: Distribution by Purpose of Test
- Table 45.22 Microbiome Diagnostic and Screening / Profiling Test Providers: Distribution by Year of Establishment
- Table 45.23 Microbiome Diagnostic and Screening / Profiling Test Providers: Distribution by Company Size
- Table 45.24 Microbiome Diagnostic and Screening / Profiling Test Providers: Distribution by Location of Headquarters (Region)
- Table 45.25 Microbiome Diagnostic and Screening / Profiling Test Providers: Distribution by Location of Headquarters (Country)
- Table 45.26 Microbiome Diagnostic and Screening / Profiling Test Providers: Distribution by Most Active Players
- Table 45.27 Fecal Microbiota Therapies: Distribution by Application Area
- Table 45.28 Fecal Microbiota Therapies: Distribution by Status of Development
- Table 45.29 Fecal Microbiota Therapies: Distribution by Target Indication
- Table 45.30 Fecal Microbiota Therapies: Distribution by Therapeutic Area
- Table 45.31 Fecal Microbiota Therapies: Distribution by Route of Administration
- Table 45.32 Fecal Microbiota Therapy Developers: Distribution by Year of Establishment
- Table 45.33 Fecal Microbiota Therapy Developers: Distribution by Company Size
- Table 45.34 Fecal Microbiota Therapy Developers: Distribution by Location of Headquarters (Region)
- Table 45.35 Fecal Microbiota Therapy Developers: Distribution by Location of
Headquarters (Country)
- Table 45.36 Ferring Pharmaceuticals: Financial Information, Since 2021 (USD Million)
- Table 45.37 Infant Bacterial Therapeutics: Financial Information, Since 2021 (USD Million)
- Table 45.38 MaaT Pharma: Financial Information, Since 2021 (USD Million)
- Table 45.39 Microbiomik: Financial Information, Since 2021 (USD Million)
- Table 45.40 Seres Therapeutics: Financial Information, Since 2021 (USD Million)
- Table 45.41 OxThera: Financial Information, Since 2021 (USD Million)
- Table 45.42 Vedanta Biosciences: Financial Information, Since 2021 (USD Million)
- Table 45.43 Zhiyi Biotech: Financial Information, Since 2021 (USD Million)
- Table 45.44 Becton, Dickinson and Company: Financial Information, Since 2021 (USD Million)
- Table 45.45 Biome Diagnostics: Financial Information, Since 2021 (USD Million)
- Table 45.46 GoodGut: Financial Information, Since 2021 (USD Million)
- Table 45.47 NutriPATH: Financial Information, Since 2021 (USD Million)
- Table 45.48 Tiny Health: Financial Information, Since 2021 (USD Million)
- Table 45.49 Clinical Trial Analysis: Scope and Methodology
- Table 45.50 Clinical Trial Analysis: Distribution by Trial Status
- Table 45.51 Clinical Trial Analysis: Cumulative Distribution by Trial Registration Year, Since 2021
- Table 45.52 Clinical Trial Analysis: Distribution by Trial Registration Year and Enrolled Patient Population, Since 2021
- Table 45.53 Clinical Trial Analysis: Distribution by Trial Registration Year and Trial Recruitment Status
- Table 45.54 Clinical Trial Analysis: Distribution by Trial Phase and Number of Patients Enrolled
- Table 45.55 Clinical Trial Analysis: Distribution by Study Design
- Table 45.56 Leading Industry Players: Distribution by Number of Registered Trials
- Table 45.57 Leading Non-industry Players: Distribution by Number of Registered Trials
- Table 45.58 Clinical Trial Analysis: Analysis by Trial Location
- Table 45.59 Clinical Trial Analysis: Analysis by Trial Status and Geography
- Table 45.60 Start-up Health Indexing: Portfolio Strength
- Table 45.61 Start-up Health Indexing: Pipeline Maturity
- Table 45.62 Start-up Health Indexing: Indication Diversity
- Table 45.63 Start-up Health Indexing: Funding Amount
- Table 45.64 Start-up Health Indexing: Partnership Activity
- Table 45.65 Obese Population: Distribution by Key Regions
- Table 45.66 Partnerships and Collaborations: Distribution of Cumulative Year-wise Trend, Since 2022
- Table 45.67 Partnerships and Collaborations: Distribution of Type of Partnership
- Table 45.68 Partnerships and Collaborations: Distribution of Year and Type of Partnership, Since 2022
- Table 45.69 Partnerships and Collaborations: Distribution of Target Indication
- Table 45.70 Partnerships and Collaborations: Distribution of Therapeutic Area
- Table 45.71 Partnerships and Collaborations: Distribution by Type of Partnership and Therapeutic Area
- Table 45.72 Partnerships and Collaborations: Distribution by Type of Partner
- Table 45.73 Most Active Players: Distribution by Number of Partnerships
- Table 45.74 Partnerships and Collaborations: Local and International Deals
- Table 45.75 Partnerships and Collaborations: Intracontinental and Intercontinental Agreements
- Table 45.76 Funding and Investments: Cumulative Year-wise Distribution of Funding Instances, Since 2022
- Table 45.77 Funding and Investments: Cumulative Year-wise Distribution of Amount Invested (USD Million), Since 2022
- Table 45.78 Funding and Investments: Distribution by Year of Funding and Amount Invested (USD Million), Since 2022
- Table 45.79 Funding and Investments: Distribution by Type of Funding
- Table 45.80 Funding and Investments: Distribution by Year of Funding and Type of Funding, 2022-2025 (till August)
- Table 45.81 Funding and Investments: Distribution by Type of Funding and Amount Invested (USD Million)
- Table 45.82 Funding and Investments: Distribution by Purpose of Funding
- Table 45.83 Funding and Investments: Distribution by Target Indication
- Table 45.84 Funding and Investments: Distribution by Therapeutic Area
- Table 45.85 Funding and Investments: Distribution by Geography
- Table 45.86 Most Active Players: Distribution by Number of Instances
- Table 45.87 Most Active Players: Distribution by Amount Invested (USD Million)
- Table 45.88 Key Investors: Distribution by Number of Funding Instances
- Table 45.89 Funding and Investment Summary, Since 2022
- Table 45.90 Live Biotherapeutic Products and Microbiome Contract Manufacturers: Distribution by Year of Establishment
- Table 45.91 Live Biotherapeutic Products and Microbiome Contract Manufacturers: Distribution by Company Size
- Table 45.92 Live Biotherapeutic Products and Microbiome Contract Manufacturers: Distribution by Location of Headquarters
- Table 45.93 Live Biotherapeutic Products and Microbiome Contract Manufacturers: Distribution by Scale of Operation
- Table 45.94 Live Biotherapeutic Products and Microbiome Contract Manufacturers: Distribution by Type of Product Manufactured
- Table 45.95 Live Biotherapeutic Products and Microbiome Contract Manufacturers: Distribution by Type of Formulation
- Table 45.96 Live Biotherapeutic Products and Microbiome Contract Manufacturers: Distribution by Scale of Operation and Type of Formulation
- Table 45.97 Global Human Microbiome Therapeutics Market, Forecasted Estimates (till 2035) (USD Million)
- Table 45.98 Global Human Microbiome Therapeutics Market, Forecasted Estimates (till 2035): Conservative Scenario (USD Million)
- Table 45.99 Human Microbiome Therapeutics Market, Forecasted Estimates (till 2035): Optimistic Scenario (USD Million)
- Table 45.100 Human Microbiome Market: Distribution by Type of Product
- Table 45.101 Human Microbiome Market for Therapeutics: Forecasted Estimates (till 2035) (USD Million)
- Table 45.102 Human Microbiome Market for Diagnostics: Forecasted Estimates (till 2035) (USD Million)
- Table 45.103 Human Microbiome Market for Fecal Microbiota Therapies: Forecasted Estimates (till 2035) (USD Million)
- Table 45.104 Human Microbiome Therapeutics Market: Distribution by Type of Biologic
- Table 45.105 Human Microbiome Therapeutics Market for Live Biotherapeutics: Forecasted Estimates (till 2035) (USD Million)
- Table 45.106 Human Microbiome Therapeutics Market for Others: Forecasted Estimates (till 2035) (USD Million)
- Table 45.107 Human Microbiome Therapeutics Market: Distribution by Route of Administration
- Table 45.108 Human Microbiome Therapeutics Market for Oral Route: Forecasted Estimates (till 2035) (USD Million)
- Table 45.109 Human Microbiome Therapeutics Market for Rectal Route: Forecasted Estimates (till 2035) (USD Million)
- Table 45.110 Human Microbiome Therapeutics Market: Distribution by Drug Formulation
- Table 45.111 Human Microbiome Therapeutics Market for Capsules: Forecasted Estimates (till 2035) (USD Million)
- Table 45.112 Human Microbiome Therapeutics Market for Suspensions: Forecasted Estimates (till 2035) (USD Million)
- Table 45.113 Human Microbiome Therapeutics Market for Enemas: Forecasted Estimates (till 2035) (USD Million)
- Table 45.114 Human Microbiome Therapeutics Market for Powders: Forecasted Estimates (till 2035) (USD Million)
- Table 45.115 Human Microbiome Therapeutics Market: Distribution by Target Indication
- Table 45.116 Human Microbiome Therapeutics Market for Clostridium Difficile Infection: Forecasted Estimates (till 2035) (USD Million)
- Table 45.117 Human Microbiome Therapeutics Market for Necrotizing Enterocolitis: Forecasted Estimates (till 2035) (USD Million)
- Table 45.118 Human Microbiome Therapeutics Market for Irritable Bowel Syndrome: Forecasted Estimates (till 2035) (USD Million)
- Table 45.119 Human Microbiome Therapeutics Market for Acute Graft Versus Host Disease: Forecasted Estimates (till 2035) (USD Million)
- Table 45.120 Human Microbiome Therapeutics Market: Distribution by Target Therapeutic Area
- Table 45.121 Human Microbiome Therapeutics Market for Infectious Diseases: Forecasted Estimates (till 2035) (USD Million)
- Table 45.122 Human Microbiome Therapeutics Market for Gastrointestinal Disorders: Forecasted Estimates (till 2035) (USD Million)
- Table 45.123 Human Microbiome Therapeutics Market for Rare Disorders: Forecasted Estimates (till 2035) (USD Million)
- Table 45.124 Human Microbiome Therapeutics Market: Distribution by Geographical Regions
- Table 45.125 Human Microbiome Therapeutics Market in North America: Forecasted Estimates (till 2035) (USD Million)
- Table 45.126 Human Microbiome Therapeutics Market in the US: Forecasted Estimates (till 2035) (USD Million)
- Table 45.127 Human Microbiome Therapeutics Market in Canada: Forecasted Estimates (till 2035) (USD Million)
- Table 45.128 Human Microbiome Therapeutics Market in Europe: Forecasted Estimates (till 2035) (USD Million)
- Table 45.129 Human Microbiome Therapeutics Market in Germany: Forecasted Estimates (till 2035) (USD Million)
- Table 45.130 Human Microbiome Therapeutics Market in the UK: Forecasted Estimates (till 2035) (USD Million)
- Table 45.131 Human Microbiome Therapeutics Market in Spain: Forecasted Estimates (till 2035) (USD Million)
- Table 45.132 Human Microbiome Therapeutics Market in France: Forecasted Estimates (till 2035) (USD Million)
- Table 45.133 Human Microbiome Therapeutics Market in Italy: Forecasted Estimates (till 2035) (USD Million)
- Table 45.134 Human Microbiome Therapeutics Market in Rest of Europe: Forecasted Estimates (till 2035) (USD Million)
- Table 45.135 Human Microbiome Therapeutics Market in Asia-Pacific: Forecasted Estimates (till 2035) (USD Million)
- Table 45.136 Human Microbiome Therapeutics Market in China: Forecasted Estimates (till 2035) (USD Million)
- Table 45.137 Human Microbiome Therapeutics Market in Australia: Forecasted Estimates (till 2035) (USD Million)
- Table 45.138 Human Microbiome Therapeutics Market in Latin America: Forecasted Estimates (till 2035) (USD Million)
- Table 45.139 Human Microbiome Therapeutics Market in Brazil: Forecasted Estimates (till 2035) (USD Million)
- Table 45.140 Human Microbiome Therapeutics Market in Middle East and North Africa: Forecasted Estimates (till 2035) (USD Million)
- Table 45.141 Global Human Microbiome Diagnostics Market, Forecasted Estimates (till 2035) (USD Million)
- Table 45.142 Global Human Microbiome Diagnostics Market, Forecasted Estimates (till 2035): Conservative Scenario (USD Million)
- Table 45.143 Human Microbiome Diagnostics Market, Forecasted Estimates (till 2035): Optimistic Scenario (USD Million)
- Table 45.144 Human Microbiome Diagnostics Market: Distribution by Target Indication
- Table 45.145 Human Microbiome Diagnostics Market for Diabetes Mellitus: Forecasted Estimates (till 2035) (USD Million)
- Table 45.146 Human Microbiome Diagnostics Market for Irritable Bowel Syndrome: Forecasted Estimates (till 2035) (USD Million)
- Table 45.147 Human Microbiome Diagnostics Market for Irritable Bowel Disease: Forecasted Estimates (till 2035) (USD Million)
- Table 45.148 Human Microbiome Diagnostics Market for Colorectal Cancer: Forecasted Estimates (till 2035) (USD Million)
- Table 45.149 Human Microbiome Diagnostics Market: Distribution by Target Therapeutic Area
- Table 45.150 Human Microbiome Diagnostics Market for Gastrointestinal Disorders: Forecasted Estimates (till 2035) (USD Million)
- Table 45.151 Human Microbiome Diagnostics Market for Metabolic Disorders: Forecasted Estimates (till 2035) (USD Million)
- Table 45.152 Human Microbiome Diagnostics Market for Oncological Disorders: Forecasted Estimates (till 2035) (USD Million)
- Table 45.153 Human Microbiome Diagnostics Market: Distribution by Geographical Regions
- Table 45.154 Human Microbiome Diagnostics Market in North America: Forecasted Estimates (till 2035) (USD Million)
- Table 45.155 Human Microbiome Diagnostics Market in the US: Forecasted Estimates (till 2035) (USD Million)
- Table 45.156 Human Microbiome Diagnostics Market in Canada: Forecasted Estimates (till 2035) (USD Million)
- Table 45.157 Human Microbiome Diagnostics Market in Europe: Forecasted Estimates (till 2035) (USD Million)
- Table 45.158 Human Microbiome Diagnostics Market in Asia-Pacific: Forecasted Estimates (till 2035) (USD Million)
- Table 45.159 Human Microbiome Diagnostics Market in China: Forecasted Estimates (till 2035) (USD Million)
- Table 45.160 Human Microbiome Diagnostics Market in India: Forecasted Estimates (till 2035) (USD Million)
- Table 45.161 Human Microbiome Diagnostics Market in Japan: Forecasted Estimates (till 2035) (USD Million)
- Table 45.162 Human Microbiome Diagnostics Market in Latin America: Forecasted Estimates (till 2035) (USD Million)
- Table 45.163 Human Microbiome Diagnostics Market in Brazil: Forecasted Estimates (till 2035) (USD Million)
- Table 45.164 Human Microbiome Diagnostics Market in Middle East and North Africa: Forecasted Estimates (till 2035) (USD Million)
- Table 45.165 Human Microbiome Diagnostics Market in Saudi Arabia: Forecasted Estimates (till 2035) (USD Million)
- Table 45.166 Global Human Microbiome Fecal Microbiota Therapies Market, Forecasted Estimates (till 2035) (USD Million)
- Table 45.167 Global Human Microbiome Fecal Microbiota Therapies Market, Forecasted Estimates (till 2035): Conservative Scenario (USD Million)
- Table 45.168 Human Microbiome Fecal Microbiota Therapies Market, Forecasted Estimates (till 2035): Optimistic Scenario (USD Million)
- Table 45.169 Human Microbiome Fecal Microbiota Therapies Market: Distribution by Geographical Regions
- Table 45.170 Human Microbiome Fecal Microbiota Therapies Market in North America: Forecasted Estimates (till 2035) (USD Million)
- Table 45.171 Human Microbiome Fecal Microbiota Therapies Market in Europe: Forecasted Estimates (till 2035) (USD Million)
- Table 45.172 Human Microbiome Fecal Microbiota Therapies Market in Asia-Pacific: Forecasted Estimates (till 2035) (USD Million)
- Table 45.173 Human Microbiome Fecal Microbiota Therapies Market in Latin America: Forecasted Estimates (till 2035) (USD Million)
- Table 45.174 Human Microbiome Fecal Microbiota Therapies Market in Middle East and
North Africa: Forecasted Estimates (till 2035) (USD Million)
List of Figures
- Figure 2.1 Research Methodology: Project Methodology
- Figure 2.2 Research Methodology: Data Sources for Secondary Research
- Figure 2.3 Research Methodology: Robust Quality Control
- Figure 3.1 Market Dynamics: Forecast Methodology
- Figure 3.2 Market Dynamics: Market Assessment Framework
- Figure 4.1 Lessons Learnt from Past Recessions
- Figure 5.1 Executive Summary: Market Landscape
- Figure 5.2 Executive Summary: Market Trends
- Figure 5.3 Executive Summary: Market Forecast and Opportunity Analysis
- Figure 6.1 Benefits of the Human Microbiota
- Figure 6.2 Factors Affecting Gut Microbiota
- Figure 6.3 Factors Affecting Gut Microbiota in Infants
- Figure 6.4 Impact of Diet on Gut Microbiota
- Figure 6.5 Types of Microbiome-Based Therapeutics
- Figure 6.6 Approaches to Design Microbiome Therapeutics
- Figure 6.7 Health Benefits of Probiotics
- Figure 6.8 Mechanism of Action of Probiotics
- Figure 6.9 Beneficial Bacterial Strains for Probiotics
- Figure 6.10 Key Achievements of the Human Microbiome Project (HMP)
- Figure 6.11 Challenges Associated with the Development of Microbiome Therapeutics
- Figure 7.1 Microbiome Therapeutics: Distribution by Stage of Development
- Figure 7.2 Microbiome Therapeutics: Distribution by Type of Molecule
- Figure 7.3 Microbiome Therapeutics: Distribution by Stage of Development and Type of Molecule
- Figure 7.4 Microbiome Therapeutics: Distribution by Type of Biologic
- Figure 7.5 Microbiome Therapeutics: Distribution by Target Indication
- Figure 7.6 Microbiome Therapeutics: Distribution by Therapeutic Area
- Figure 7.7 Microbiome Therapeutics: Distribution by Route of Administration
- Figure 7.8 Microbiome Therapeutics: Distribution by Type of Formulation
- Figure 7.9 Microbiome Therapeutics: Distribution by Dose Frequency
- Figure 7.10 Microbiome Therapeutics: Distribution by Type of Therapy
- Figure 7.11 Microbiome Therapeutic Developers: Distribution by Year of Establishment
- Figure 7.12 Microbiome Therapeutic Developers: Distribution by Company Size
- Figure 7.13 Microbiome Therapeutic Developers: Distribution by Location of Headquarters (Region)
- Figure 7.14 Microbiome Therapeutic Developers: Distribution by Location of Headquarters (Country)
- Figure 7.15 Most Active Players: Distribution by Number of Microbiome Therapies
- Figure 8.1 Key Steps in 16S rRNA Gene Sequence Analysis
- Figure 8.2 Microbiome Diagnostics and Screening / Profiling Tests: Distribution by Stage of Development
- Figure 8.3 Microbiome Diagnostics and Screening / Profiling Tests: Distribution by Type of Sample Analyzed
- Figure 8.4 Microbiome Diagnostics and Screening / Profiling Tests: Distribution by Type of Screening Technique
- Figure 8.5 Microbiome Diagnostics and Screening / Profiling Tests: Distribution by Target Indication
- Figure 8.6 Microbiome Diagnostics and Screening / Profiling Tests: Distribution by Therapeutic Area
- Figure 8.7 Microbiome Diagnostics and Screening / Profiling Tests: Distribution by Purpose of Test
- Figure 8.8 Microbiome Diagnostic and Screening / Profiling Test Providers: Distribution by Year of Establishment
- Figure 8.9 Microbiome Diagnostic and Screening / Profiling Test Providers: Distribution by Company Size
- Figure 8.10 Microbiome Diagnostic and Screening / Profiling Test Providers: Distribution by Location of Headquarters (Region)
- Figure 8.11 Microbiome Diagnostic and Screening / Profiling Test Providers: Distribution by Location of Headquarters (Country)
- Figure 8.12 Most Active Players: Distribution by Number of Microbiome Tests
- Figure 9.1 Working Mechanism of a Microflora Refinement System
- Figure 9.2 Fecal Microbiota Therapies: Distribution by Application Area
- Figure 9.3 Fecal Microbiota Therapies: Distribution by Status of Development
- Figure 9.4 Fecal Microbiota Therapies: Distribution by Target Indication
- Figure 9.5 Fecal Microbiota Therapies: Distribution by Therapeutic Area
- Figure 9.6 Fecal Microbiota Therapies: Distribution by Route of Administration
- Figure 9.7 Fecal Microbiota Therapy Developers: Distribution by Year of Establishment
- Figure 9.8 Fecal Microbiota Therapy Developers: Distribution by Company Size
- Figure 9.9 Fecal Microbiota Therapy Developers: Distribution by Location of Headquarters (Region)
- Figure 9.10 Fecal Microbiota Therapy Developers: Distribution by Location of Headquarters (Country)
- Figure 10.1 Ferring Pharmaceuticals: Financial Information, Since 2021 (USD Million)
- Figure 10.2 Infant Bacterial Therapeutics: Financial Information, Since 2021 (USD Million)
- Figure 10.3 MaaT Pharma: Financial Information, Since 2021 (USD Million)
- Figure 10.4 Microbiomik: Financial Information, Since 2021 (USD Million)
- Figure 10.5 Seres Therapeutics: Financial Information, Since 2021 (USD Million)
- Figure 10.6 OxThera: Financial Information, Since 2021 (USD Million)
- Figure 10.7 Vedanta Biosciences: Financial Information, Since 2021 (USD Million)
- Figure 10.8 Zhiyi Biotech: Financial Information, Since 2021 (USD Million)
- Figure 11.1 Becton, Dickinson and Company: Financial Information, Since 2021 (USD Million)
- Figure 11.2 Biome Diagnostics: Financial Information, Since 2021 (USD Million)
- Figure 11.3 GoodGut: Financial Information, Since 2021 (USD Million)
- Figure 11.4 NutriPATH: Financial Information, Since 2021 (USD Million)
- Figure 11.5 Tiny Health: Financial Information, Since 2021 (USD Million)
- Figure 12.1 Distribution by Trial Registration Year
- Figure 12.2 Distribution of Enrolled Patient Population by Trial Registration Year
- Figure 12.3 Distribution by Trial Status
- Figure 12.4 Distribution of Enrolled Patient Population by Trial Status
- Figure 12.5 Distribution by Trial Registration Year and Trial Status
- Figure 12.6 Distribution by Trial Phase
- Figure 12.7 Distribution of Enrolled Patient Population by Trial Phase
- Figure 12.8 Distribution by Type of Sponsor / Collaborator
- Figure 12.9 Distribution by Study Design
- Figure 12.10 Distribution by Gender
- Figure 12.11 Leading Industry Players: Distribution by Number of Registered Trials
- Figure 12.12 Leading Non-industry Players: Distribution by Number of Registered Trials
- Figure 12.13 Distribution of by Trial Status, Trial Phase and Geography
- Figure 12.14 Distribution by Geography
- Figure 12.15 Distribution by Trial Status and Geography
- Figure 12.16 Distribution of Enrolled Patient Population by Trial Status and Geography
- Figure 13.1 AC Matrix: Pictorial Representation
- Figure 13.2 AC Matrix: Positioning of Different Indications
- Figure 14.1 Start-up Health Indexing: Distribution by Portfolio Strength
- Figure 14.2 Start-up Health Indexing: Distribution by Pipeline Maturity
- Figure 14.3 Start-up Health Indexing: Distribution by Indication Diversity
- Figure 14.4 Start-up Health Indexing: Distribution by Funding Amount
- Figure 14.5 Start-up Health Indexing: Distribution by Partnership Activity
- Figure 14.6 Start-up Health Indexing: Roots Analysis Perspective
- Figure 14.7 Start-up Health Indexing: Leading Companies
- Figure 15.1 Diabetes: Diagnostic Limits for Plasma Glucose Levels
- Figure 15.2 Non-Insulin Therapies for Diabetes
- Figure 15.3 Weight Categories as per BMI Calculations
- Figure 15.4 Obese Population: Distribution by Key Geographical Regions
- Figure 16.1 Partnerships and Collaborations: Distribution of Cumulative Year-wise
Trend, Since 2022
- Figure 16.2 Partnerships and Collaborations: Distribution of Type of Partnership
- Figure 16.3 Partnerships and Collaborations: Distribution of Year and Type of Partnership, Since 2022
- Figure 16.4 Partnerships and Collaborations: Distribution of Target Indication
- Figure 16.5 Partnerships and Collaborations: Distribution of Therapeutic Area
- Figure 16.6 Partnerships and Collaborations: Distribution by Type of Partnership and Therapeutic Area
- Figure 16.7 Partnerships and Collaborations: Distribution by Type of Partner
- Figure 16.8 Most Active Players: Distribution by Number of Partnerships
- Figure 16.9 Partnerships and Collaborations: Local and International Deals
- Figure 16.10 Partnerships and Collaborations: Intercontinental and Intracontinental Deals
- Figure 17.1 Funding and Investments: Cumulative Year-wise Distribution of Funding Instances, Since 2022
- Figure 17.2 Funding and Investments: Cumulative Year-wise Distribution of Amount Invested (USD Million), Since 2022
- Figure 17.3 Funding and Investments: Distribution by Year of Funding and Amount Invested (USD Million), Since 2022
- Figure 17.4 Funding and Investments: Distribution by Type of Funding
- Figure 17.5 Funding and Investments: Distribution by Year of Funding and Type of Funding, Since 2022
- Figure 17.6 Funding and Investments: Distribution by Type of Funding and Amount Invested (USD Million)
- Figure 17.7 Funding and Investments: Distribution by Purpose of Funding
- Figure 17.8 Funding and Investments: Distribution by Target Indication
- Figure 17.9 Funding and Investments: Distribution by Therapeutic Area
- Figure 17.10 Funding and Investments: Distribution by Geography
- Figure 17.11 Most Active Players: Distribution by Number of Instances
- Figure 17.12 Most Active Players: Distribution by Amount Invested (USD Million)
- Figure 17.13 Leading Investors: Distribution by Number of Funding Instances
- Figure 17.14 Funding and Investment Summary, Since 2022
- Figure 18.1 Live Biotherapeutic Products and Microbiome Contract Manufacturers: Distribution by Year of Establishment
- Figure 18.2 Live Biotherapeutic Products and Microbiome Contract Manufacturers: Distribution by Company Size
- Figure 18.3 Live Biotherapeutic Products and Microbiome Contract Manufacturers: Distribution by Location of Headquarters
- Figure 18.4 Live Biotherapeutic Products and Microbiome Contract Manufacturers:
Distribution by Scale of Operation
- Figure 18.5 Live Biotherapeutic Products and Microbiome Contract Manufacturers: Distribution by Type of Product Manufactured
- Figure 18.6 Live Biotherapeutic Products and Microbiome Contract Manufacturers: Distribution by Type of Formulation
- Figure 18.7 Live Biotherapeutic Products and Microbiome Contract Manufacturers: Distribution by Scale of Operation and Type of Formulation
- Figure 19.1 Big Data: The Three V's
- Figure 19.2 Internet of Things: Framework
- Figure 19.3 Internet of Things: Applications in Healthcare
- Figure 19.4 Big Data: Google Trends Analysis
- Figure 19.5 Big Data and Microbiome: Google Trends
- Figure 19.6 Big Data: Key Application Areas
- Figure 19.7 Big Data: Opportunities in Healthcare
- Figure 19.8 Big Data: Key Benefits for Pharmaceutical and Biotechnology Products
- Figure 19.9 Challenges Associated with Microbiome-related Big Data Management
- Figure 20.1 Global Human Microbiome Therapeutics Market, Forecasted Estimates (till 2035) (USD Million)
- Figure 20.2 Human Microbiome Market: Distribution by Type of Product
- Figure 20.3 Human Microbiome Market for Therapeutics: Forecasted Estimates (till 2035) (USD Million)
- Figure 20.4 Human Microbiome Market for Diagnostics: Forecasted Estimates (till 2035) (USD Million)
- Figure 20.5 Human Microbiome Market for Fecal Microbiota Therapies: Forecasted Estimates (till 2035) (USD Million)
- Figure 20.6 Global Human Microbiome Therapeutics Market, Forecasted Estimates (till 2035): Conservative Scenario (USD Million)
- Figure 20.7 Global Human Microbiome Therapeutics Market, Forecasted Estimates (till 2035): Optimistic Scenario (USD Million)
- Figure 21.1 Human Microbiome Therapeutics Market: Distribution by Type of Biologic
- Figure 21.2 Human Microbiome Therapeutics Market for Live Biotherapeutics: Forecasted Estimates (till 2035) (USD Million)
- Figure 21.3 Human Microbiome Therapeutics Market for Others: Forecasted Estimates (till 2035) (USD Million)
- Figure 22.1 Human Microbiome Therapeutics Market: Distribution by Route of Administration
- Figure 22.2 Human Microbiome Therapeutics Market for Oral Route: Forecasted Estimates (till 2035) (USD Million)
- Figure 22.3 Human Microbiome Therapeutics Market for Rectal Route: Forecasted
Estimates (till 2035) (USD Million)
- Figure 23.1 Human Microbiome Therapeutics Market: Distribution by Drug Formulation
- Figure 23.2 Human Microbiome Therapeutics Market for Capsules: Forecasted Estimates (till 2035) (USD Million)
- Figure 23.3 Human Microbiome Therapeutics Market for Suspensions: Forecasted Estimates (till 2035) (USD Million)
- Figure 23.4 Human Microbiome Therapeutics Market for Enemas: Forecasted Estimates (till 2035) (USD Million)
- Figure 23.5 Human Microbiome Therapeutics Market for Powders: Forecasted Estimates (till 2035) (USD Million)
- Figure 24.1 Human Microbiome Therapeutics Market: Distribution by Target Indication
- Figure 24.2 Human Microbiome Therapeutics Market for Clostridium Difficile Infection: Forecasted Estimates (till 2035) (USD Million)
- Figure 24.3 Human Microbiome Therapeutics Market for Necrotizing Enterocolitis: Forecasted Estimates (till 2035) (USD Million)
- Figure 24.4 Human Microbiome Therapeutics Market for Irritable Bowel Syndrome: Forecasted Estimates (till 2035) (USD Million)
- Figure 24.5 Human Microbiome Therapeutics Market for Acute Graft Versus Host Disease: Forecasted Estimates (till 2035) (USD Million)
- Figure 25.1 Human Microbiome Therapeutics Market: Distribution by Target Therapeutic Area
- Figure 25.2 Human Microbiome Therapeutics Market for Infectious Diseases: Forecasted Estimates (till 2035) (USD Million)
- Figure 25.3 Human Microbiome Therapeutics Market for Gastrointestinal Disorders: Forecasted Estimates (till 2035) (USD Million)
- Figure 25.4 Human Microbiome Therapeutics Market for Rare Disorders: Forecasted Estimates (till 2035) (USD Million)
- Figure 26.1 Human Microbiome Therapeutics Market: Distribution by Geographical Regions
- Figure 26.2 Human Microbiome Therapeutics Market in North America: Forecasted Estimates (till 2035) (USD Million)
- Figure 26.3 Human Microbiome Therapeutics Market in the US: Forecasted Estimates (till 2035) (USD Million)
- Figure 26.4 Human Microbiome Therapeutics Market in Canada: Forecasted Estimates (till 2035) (USD Million)
- Figure 26.5 Human Microbiome Therapeutics Market in Europe: Forecasted Estimates (till 2035) (USD Million)
- Figure 26.6 Human Microbiome Therapeutics Market in Germany: Forecasted Estimates (till 2035) (USD Million)
- Figure 26.7 Human Microbiome Therapeutics Market in the UK: Forecasted Estimates (till 2035) (USD Million)
- Figure 26.8 Human Microbiome Therapeutics Market in Spain: Forecasted Estimates (till 2035) (USD Million)
- Figure 26.9 Human Microbiome Therapeutics Market in France: Forecasted Estimates (till 2035) (USD Million)
- Figure 26.10 Human Microbiome Therapeutics Market in Italy: Forecasted Estimates (till 2035) (USD Million)
- Figure 26.11 Human Microbiome Therapeutics Market in Rest of Europe: Forecasted Estimates (till 2035) (USD Million)
- Figure 26.12 Human Microbiome Therapeutics Market in Asia-Pacific: Forecasted Estimates (till 2035) (USD Million)
- Figure 26.13 Human Microbiome Therapeutics Market in China: Forecasted Estimates (till 2035) (USD Million)
- Figure 26.14 Human Microbiome Therapeutics Market in Australia: Forecasted Estimates (till 2035) (USD Million)
- Figure 26.15 Human Microbiome Therapeutics Market in Latin America: Forecasted Estimates (till 2035) (USD Million)
- Figure 26.16 Human Microbiome Therapeutics Market in Brazil: Forecasted Estimates (till 2035) (USD Million)
- Figure 26.17 Human Microbiome Therapeutics Market in Middle East and North Africa: Forecasted Estimates (till 2035) (USD Million)
- Figure 26.18 Human Microbiome Therapeutics Market in Israel: Forecasted Estimates (till 2035) (USD Million)
- Figure 26.19 Penetration Growth (P-G) Matrix: Geographical Regions
- Figure 26.20 Market Movement Analysis: Geographical Regions
- Figure 27.1 Global Human Microbiome Diagnostics Market, Forecasted Estimates (till 2035) (USD Million)
- Figure 27.2 Global Human Microbiome Diagnostics Market, Forecasted Estimates (till 2035): Conservative Scenario (USD Million)
- Figure 27.3 Global Human Microbiome Diagnostics Market, Forecasted Estimates (till 2035): Optimistic Scenario (USD Million)
- Figure 28.1 Human Microbiome Diagnostics Market: Distribution by Target Indication
- Figure 28.2 Human Microbiome Diagnostics Market for Diabetes Mellitus: Forecasted Estimates (till 2035) (USD Million)
- Figure 28.3 Human Microbiome Diagnostics Market for Irritable Bowel Syndrome: Forecasted Estimates (till 2035) (USD Million)
- Figure 28.4 Human Microbiome Diagnostics Market for Irritable Bowel Disease: Forecasted Estimates (till 2035) (USD Million)
- Figure 28.5 Human Microbiome Diagnostics Market for Colorectal Cancer: Forecasted Estimates (till 2035) (USD Million)
- Figure 29.1 Human Microbiome Diagnostics Market: Distribution by Target Therapeutic Area
- Figure 29.2 Human Microbiome Diagnostics Market for Gastrointestinal Disorders: Forecasted Estimates (till 2035) (USD Million)
- Figure 29.3 Human Microbiome Diagnostics Market for Metabolic Disorders: Forecasted Estimates (till 2035) (USD Million)
- Figure 29.4 Human Microbiome Diagnostics Market for Oncological Disorders: Forecasted Estimates (till 2035) (USD Million)
- Figure 30.1 Human Microbiome Diagnostics Market: Distribution by Geographical Regions
- Figure 30.2 Human Microbiome Diagnostics Market in North America: Forecasted Estimates (till 2035) (USD Million)
- Figure 30.3 Human Microbiome Diagnostics Market in the US: Forecasted Estimates (till 2035) (USD Million)
- Figure 30.4 Human Microbiome Diagnostics Market in Canada: Forecasted Estimates (till 2035) (USD Million)
- Figure 30.5 Human Microbiome Diagnostics Market in Europe: Forecasted Estimates (till 2035) (USD Million)
- Figure 30.6 Human Microbiome Diagnostics Market in Asia-Pacific: Forecasted Estimates (till 2035) (USD Million)
- Figure 30.7 Human Microbiome Diagnostics Market in China: Forecasted Estimates (till 2035) (USD Million)
- Figure 30.8 Human Microbiome Diagnostics Market in India: Forecasted Estimates (till 2035) (USD Million)
- Figure 30.9 Human Microbiome Diagnostics Market in Japan: Forecasted Estimates (till 2035) (USD Million)
- Figure 30.10 Human Microbiome Diagnostics Market in Latin America: Forecasted Estimates (till 2035) (USD Million)
- Figure 30.11 Human Microbiome Diagnostics Market in Brazil: Forecasted Estimates (till 2035) (USD Million)
- Figure 30.12 Human Microbiome Diagnostics Market in Middle East and North Africa: Forecasted Estimates (till 2035) (USD Million)
- Figure 30.13 Human Microbiome Diagnostics Market in Saudi Arabia: Forecasted Estimates (till 2035) (USD Million)
- Figure 30.14 Penetration Growth (P-G) Matrix: Geographical Regions
- Figure 30.15 Market Movement Analysis: Geographical Regions
- Figure 31.1 Global Human Microbiome Fecal Microbiota Therapies Market, Forecasted
Estimates (till 2035) (USD Million)
- Figure 31.2 Global Human Microbiome Fecal Microbiota Therapies Market, Forecasted Estimates (till 2035): Conservative Scenario (USD Million)
- Figure 31.3 Global Human Microbiome Fecal Microbiota Therapies Market, Forecasted Estimates (till 2035): Optimistic Scenario (USD Million)
- Figure 32.1 Human Microbiome Fecal Microbiota Therapies Market: Distribution by Geographical Regions
- Figure 32.2 Human Microbiome Fecal Microbiota Therapies Market in North America: Forecasted Estimates (till 2035) (USD Million)
- Figure 32.3 Human Microbiome Fecal Microbiota Therapies Market in Europe: Forecasted Estimates (till 2035) (USD Million)
- Figure 32.4 Human Microbiome Fecal Microbiota Therapies Market in Asia-Pacific: Forecasted Estimates (till 2035) (USD Million)
- Figure 32.5 Human Microbiome Fecal Microbiota Therapies Market in Latin America: Forecasted Estimates (till 2035) (USD Million)
- Figure 32.6 Human Microbiome Fecal Microbiota Therapies Market in Middle East and North Africa: Forecasted Estimates (till 2035) (USD Million)
- Figure 32.7 Penetration Growth (P-G) Matrix: Geographical Regions
- Figure 32.8 Market Movement Analysis: Geographical Regions
- Figure 43.1 Concluding Remarks: Human Microbiome Therapeutics Market Landscape
- Figure 43.2 Concluding Remarks: Human Microbiome Diagnostics and Screening / Profiling Tests Market Landscape
- Figure 43.3 Concluding Remarks: Human Microbiome Fecal Microbiota Therapies Market Landscape
- Figure 43.4 Concluding Remarks: Clinical Trial Analysis
- Figure 43.5 Concluding Remarks: Start-up Health Indexing
- Figure 43.6 Concluding Remarks: Partnerships and Collaborations
- Figure 43.7 Concluding Remarks: Funding and Investments
- Figure 43.8 Concluding Remarks: Human Microbiome Therapeutics Market Forecast
- Figure 43.9 Concluding Remarks: Human Microbiome Diagnostics Market Forecast
- Figure 43.10 Concluding Remarks: Human Microbiome Fecal Microbiota Therapies Market Forecast

