
PUBLISHER: Roots Analysis | PRODUCT CODE: 1762528

PUBLISHER: Roots Analysis | PRODUCT CODE: 1762528
Vector Purification Market: Industry Trends and Global Forecasts - Distribution by Type Of Viral Vector, Type of Purification Technique, Type Of Therapy, Therapeutic Area, Scale of Operation and Key Geographical Regions
VECTOR PURIFICATION MARKET: OVERVIEW
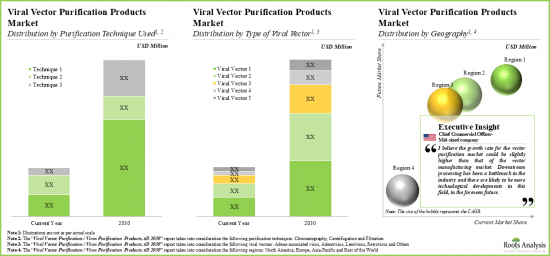
As per Roots Analysis, the global vector purification market valued at USD 155 million in the current year is anticipated to grow at a lucrative CAGR of 21% during the forecast period.
The market sizing and opportunity analysis has been segmented across the following parameters:
Type of Viral Vector
- AAV
- Adenovirus
- Lentivirus
- Retrovirus
- Others
Type of Purification Technique
- Chromatography
- Centrifugation
- Filtration
Type of Therapy
- Gene Therapy
- Cell Therapy
- Viral Vaccines
Therapeutic Area
- Oncological Disorders
- Cardiovascular Disorders
- Ophthalmic Disorders
- Metabolic Disorders
- Inflammation & Immunological Diseases
- Others
Scale of Operation
- Preclinical / Clinical
- Commercial
Key Geographical Regions
- North America
- Europe
- Asia- Pacific
- Rest of the World
VECTOR PURIFICATION MARKET: GROWTH AND TRENDS
Viral vectors are the biological tools that are used to transport genetic material to the target cell. Despite being a complex and resource-intensive process, development and manufacturing of cell and gene therapies has gained substantial momentum, with an increasing number of clinical programs moving to later-phase clinical trials and towards market approval. There are currently over 30 commercially available cell and gene therapy products, along with hundreds of ongoing clinical trials for these innovative therapies. Further, the COVID-19 pandemic has led to a notable rise in the number of therapies that are currently under intervention in clinical trials. However, the current purification methods for viral vectors involve a multitude of steps, which are known to be associated with high product losses and lower yields.
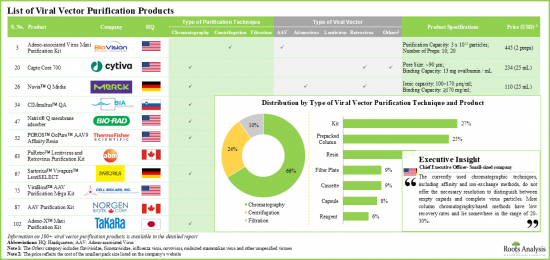
Gradually, rising demand for viral vectors coupled with lack of scalability and other concerns related to downstream purification, have led stakeholders in this domain to undertake various initiatives to develop novel and effective solution for virus purification. Recently, stakeholders have begun relying more on affinity chromatography-based virus purification regimens. Further, there are several companies that claim to offer a diverse range of innovative solutions for vector purification, including filter plates, prepacked chromatography columns and resins, and consolidated kits.
VECTOR PURIFICATION MARKET: KEY INSIGHTS
The report delves into the current state of the global vector purification market and identifies potential growth opportunities within industry. Some key findings from the report include:
- Over 100 viral vector purification products, involving the use of a variety of downstream processing techniques, have been developed to improve virus recovery and facilitate effective removal of contaminants / impurities.
- Most of the available virus purification products have been designed for small / clinical scale use, catering to specific requirements of different types of vectors; North America emerged as the hub of development of such solutions.
- Given the surge in R&D on viral vector-based vaccines in the current crisis, the demand for large scale virus purification solutions is anticipated to be on the rise.
- Adenoviral vectors are widely used in cell and gene therapies; hence, several players offer products, such as kits, resins and columns, for such viruses.
- Majority of developers are based in North America; Bio-Rad Laboratories, Cytiva and Thermo Fisher Scientific are some of the large players based in the region.
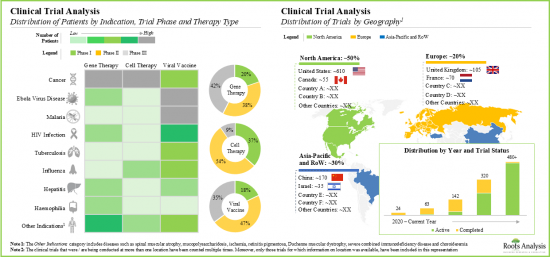
- Over the years, more than 1,000 clinical trials, evaluating various viral vector-based therapies and vaccines, across a wide range of diseases, have been registered and are being conducted in different global regions.
- In order to augment and further optimize existing virus purification processes, several viral vector drug developers and manufacturers are likely to forge alliances with purification product developers.
- Over 35 players across the globe are capable of manufacturing different types of viral vectors at commercial scale, either for in-house requirements or as part of contract manufacturing engagements.
- Owing to the rise in R&D initiatives focused on viral cell and gene therapies, the clinical and commercial demand for various types of viral vectors is expected to increase, across a variety of therapeutic indications.
- Since only a few genetically modified therapies have been approved, the current demand is being driven by the patients enrolled in various clinical trials for viral vector-based therapies.
- Currently, over 40% of commercial demand is attributed to adenoviruses due to their wide use in marketed therapies; further, lentiviruses contribute to about 35% of the clinical demand.
- Majority of viral vectors are being developed for patients suffering from oncological disorders; in the coming years, neurological disorders and muscular disorders, are likely to generate a significant demand.
- The market is anticipated to grow at a CAGR of over 21% during the forecast period, and the opportunity is likely to be distributed across different types of purification techniques, viral vectors and key geographical regions.
Example Players in the Vector Purification Market
- Agilent Technologies
- BIA Separations
- Bio-Rad Laboratories
- BioVision
- Cytiva (formerly GE Lifesciences)
- Merck
- Sartorius
- Takara Bio
- Thermo Fisher Scientific
VECTOR PURIFICATION MARKET: RESEARCH COVERAGE
- Market Sizing and Opportunity Analysis: The report features an in-depth analysis of the vector purification market, focusing on key market segments, including [A] type of viral vector, [B] type of purification technique, [C] type of therapy, [D] therapeutic area, [E] scale of operation and [F] key geographical regions.
- Market Landscape: A comprehensive evaluation of companies providing products for purification of viruses / viral vectors, based on several relevant parameters, such as [A] type of product, [B] type of purification technique, [C] scale of operation, [D] type of viral vector and [E] details on other physical and operational parameters of the product. Additionally, a comprehensive evaluation of purification product developers, based on parameters, such as [A] the year of establishment, [B] company size and [C] location of headquarters.
- Company Profiles: In-depth profiles of the players engaged in this domain, focusing on [A] overview of the company, [B] product portfolio and [C] recent developments and an informed future outlook.
- Strategic Partner Analysis: A detailed analysis of the potential strategic partners for viral vector purification product developers, based on various parameters, such as [A] type of viral vector, [B] developer strength, [C] operational strength, [D] therapeutic area, [E] strength of clinical pipeline and [F] strength of preclinical pipeline.
- Clinical Trial Analysis: An in-depth analysis of clinical studies of different viral-vector based therapies, examining factors, such as [A] registration year, [B] phase of development, [C] trial status, [D] type of therapy, [E] therapeutic area, [F] type of sponsor / collaborator, [G] geographical location, [H] number of patients enrolled and [I] key players.
- Demand Analysis: A detailed analysis of the current and future demand for viral vectors, based on various parameters, such as [A] target patient population, [B] dosing frequency, [C] dose strength, [E] type of viral vector, [F] type of therapy, [G] therapeutic are and [h] geographical location.
- Case Study 1: A detailed discussion on tangential flow filtration (TFF), representing the role, advantages and disadvantages of the various techniques used for purification of viral vectors; featuring the details of products used for TFF, including [A] product type, [B] scale of operation, [C] membrane material, [D] flow rate and [E] filtration area.
- Case Study 2: Elaborate assessment of viral vector manufacturers providing commercial scale production, focusing on details, such as [A] year of establishment, [B] company size, [C] type of viral vector, [D] purpose of production, [E] location of headquarters and [F] manufacturing facilities.
KEY QUESTIONS ANSWERED IN THIS REPORT
- How many companies are currently engaged in this market?
- Which are the leading companies in this market?
- What factors are likely to influence the evolution of this market?
- What is the current and future market size?
- What is the CAGR of this market?
- How is the current and future market opportunity likely to be distributed across key market segments?
REASONS TO BUY THIS REPORT
- The report provides a comprehensive market analysis, offering detailed revenue projections of the overall market and its specific sub-segments. This information is valuable to both established market leaders and emerging entrants.
- Stakeholders can leverage the report to gain a deeper understanding of the competitive dynamics within the market. By analyzing the competitive landscape, businesses can make informed decisions to optimize their market positioning and develop effective go-to-market strategies.
- The report offers stakeholders a comprehensive overview of the market, including key drivers, barriers, opportunities, and challenges. This information empowers stakeholders to stay abreast of market trends and make data-driven decisions to capitalize on growth prospects.
ADDITIONAL BENEFITS
- Complimentary PPT Insights Packs
- Complimentary Excel Data Packs for all Analytical Modules in the Report
- 15% Free Content Customization
- Detailed Report Walkthrough Session with Research Team
- Free Updated report if the report is 6-12 months old or older
TABLE OF CONTENTS
1. PREFACE
- 1.1. Scope of the Report
- 1.2. Research Methodology
- 1.2.1. Research Assumptions
- 1.2.2. Project Methodology
- 1.2.3. Forecast Methodology
- 1.2.4. Robust Quality Control
- 1.2.5. Key Considerations
- 1.2.5.1. Demographics
- 1.2.5.2. Economic Factors
- 1.2.5.3. Government Regulations
- 1.2.5.4. Supply Chain
- 1.2.5.5. COVID Impact / Related Factors
- 1.2.5.6. Market Access
- 1.2.5.7. Healthcare Policies
- 1.2.5.8. Industry Consolidation
- 1.3 Key Questions Answered
- 1.4. Chapter Outlines
2. EXECUTIVE SUMMARY
3. INTRODUCTION
- 3.1. Chapter Overview
- 3.2. Viral and Non-Viral Methods of Gene Transfer
- 3.3. Viral Vectors for Genetically Modified Therapies
- 3.4. Types of Viral Vectors
- 3.4.1. Adeno-associated Viral Vectors
- 3.4.2. Adenoviral Vectors
- 3.4.3. Lentiviral Vectors
- 3.4.4. Retroviral Vectors
- 3.4.5. Other Viral Vectors
- 3.4.5.1. Alphavirus
- 3.4.5.2. Foamy Virus
- 3.4.5.3. Herpes Simplex Virus
- 3.4.5.4. Sendai Virus
- 3.4.5.5. Simian Virus
- 3.4.5.6. Vaccinia Virus
- 3.6. Applications of Viral Vectors
- 3.6.1. Cell and Gene Therapy
- 3.6.2. Vaccinology
- 3.7. Current Trends in Vector Development / Manufacturing
- 3.7.1. Vector Engineering
- 3.7.2. Cargo Engineering
- 3.8. Vector Manufacturing
- 3.8.1. Types of Vector Manufacturers
- 3.8.2. Viral Vector Manufacturing Process
- 3.8.3. Challenges Related to Vector Manufacturing
- 3.8.3.1. Vector Purification Process
- 3.8.3.2. Techniques Used for Vector Purification
- 3.8.3.2.1. Centrifugation and Ultra-Centrifugation
- 3.8.3.2.2. Filtration
- 3.8.3.2.3. Chromatography
- 3.8.3.3. Challenges Related to Vector Purification
- 3.9. Future of Vector Purification
4. MARKET LANDSCAPE
- 4.1. Chapter Overview
- 4.2. Viral Vector Purification Products: Overall Market Landscape
- 4.2.1. Analysis by Type of Product
- 4.2.2. Analysis by Type of Purification Technique
- 4.2.3. Analysis by Scale of Operation
- 4.2.4. Analysis by Type of Viral Vector
- 4.2.5. Viral Vector Purification Products for Chromatography
- 4.2.5.1. Analysis by Type of Chromatographic Technique
- 4.2.6. Viral Vector Purification Products for Centrifugation
- 4.2.7. Viral Vector Purification Products for Filtration
- 4.3. Viral Vector Purification Product Developers
- 4.3.1. Analysis by Year of Establishment
- 4.3.2. Analysis by Company Size
- 4.3.3. Analysis by Geographical Location
5. COMPANY PROFILES
- 5.1. Chapter Overview
- 5.2. Agilent Technologies
- 5.2.1. Company Overview
- 5.2.2. Product Portfolio
- 5.2.3. Recent Developments and Future Outlook
- 5.3. BIA Separations
- 5.3.1. Company Overview
- 5.3.2. Product Portfolio
- 5.3.3. Recent Developments and Future Outlook
- 5.4. Bio-Rad Laboratories
- 5.4.1. Company Overview
- 5.4.2. Product Portfolio
- 5.4.3. Recent Developments and Future Outlook
- 5.5. BioVision
- 5.5.1. Company Overview
- 5.5.2. Product Portfolio
- 5.5.3. Recent Developments and Future Outlook
- 5.6. Cytiva (formerly GE Lifesciences)
- 5.6.1. Company Overview
- 5.6.2. Product Portfolio
- 5.6.3. Recent Developments and Future Outlook
- 5.7. Merck
- 5.7.1. Company Overview
- 5.7.2. Product Portfolio
- 5.7.3. Recent Developments and Future Outlook
- 5.8. Sartorius
- 5.8.1. Company Overview
- 5.8.2. Product Portfolio
- 5.8.3. Recent Developments and Future Outlook
- 5.9. Takara Bio
- 5.9.1. Company Overview
- 5.9.2. Product Portfolio
- 5.9.3. Recent Developments and Future Outlook
- 5.10. Thermo Fisher Scientific
- 5.10.1. Company Overview
- 5.10.2. Product Portfolio
- 5.10.3. Recent Developments and Future Outlook
6. STRATEGIC PARTNER ANALYSIS
- 6.1. Chapter Overview
- 6.2. Methodology and Key Parameters
- 6.3. Potential Strategic Partners: Viral Vector-based Therapy Developers
- 6.3.1. Strategic Partner Analysis: AAV Vector-based Therapy Developers
- 6.3.1.1. Most Likely Partners
- 6.3.1.2. Likely Partners
- 6.3.1.3. Less Likely Partners
- 6.3.1.4. Least Likely Partners
- 6.3.2. Strategic Partner Analysis: Adenoviral Vector-based Therapy Developers
- 6.3.2.1. Most Likely Partners
- 6.3.2.2. Likely Partners
- 6.3.2.3. Less Likely Partners
- 6.3.2.4. Least Likely Partners
- 6.3.3. Strategic Partner Analysis: Lentiviral Vector-based Therapy Developers
- 6.3.3.1. Most Likely Partners
- 6.3.3.2. Likely Partners
- 6.3.3.3. Less Likely Partners
- 6.3.3.4. Least Likely Partners
- 6.3.4. Strategic Partner Analysis: Retroviral Vector-based Therapy Developers
- 6.3.4.1. Most Likely Partners
- 6.3.4.2. Likely Partners
- 6.3.4.3. Less Likely Partners
- 6.3.4.4. Least Likely Partners
- 6.3.5. Strategic Partner Analysis: Other Viral Vector-based Therapy Developers
- 6.3.5.1. Most Likely Partners
- 6.3.5.2. Likely Partners
- 6.3.5.3. Less Likely Partners
- 6.3.5.4. Least Likely Partners
- 6.3.1. Strategic Partner Analysis: AAV Vector-based Therapy Developers
- 6.4. Potential Strategic Partners: Viral Vector Manufacturers
- 6.4.1. Strategic Partner Analysis: AAV Vector Manufacturers
- 6.4.1.1. Most Likely Partners
- 6.4.1.2. Likely Partners
- 6.4.1.3. Less Likely Partners
- 6.4.1.4. Least Likely Partners
- 6.4.2. Strategic Partner Analysis: Adenoviral Vector Manufacturers
- 6.4.2.1. Most Likely Partners
- 6.4.2.2. Likely Partners
- 6.4.2.3. Less Likely Partners
- 6.4.2.4. Least Likely Partners
- 6.4.3. Strategic Partner Analysis: Lentiviral Vector Manufacturers
- 6.4.3.1. Most Likely Partners
- 6.4.3.2. Likely Partners
- 6.4.3.3. Less Likely Partners
- 6.4.3.4. Least Likely Partners
- 6.4.4. Strategic Partner Analysis: Retroviral Vector Manufacturers
- 6.4.4.1. Most Likely Partners
- 6.4.4.2. Likely Partners
- 6.4.4.3. Less Likely Partners
- 6.4.4.4. Least Likely Partners
- 6.4.5. Strategic Partner Analysis: Other Viral Vector Manufacturers
- 6.4.5.1. Most Likely Partners
- 6.4.5.2. Likely Partners
- 6.4.5.3. Less Likely Partners
- 6.4.5.4. Least Likely Partners
- 6.4.1. Strategic Partner Analysis: AAV Vector Manufacturers
7. CLINICAL TRIAL ANALYSIS
- 7.1. Chapter Overview
- 7.2. Scope and Methodology
- 7.3. Viral Vector based Therapies: Clinical Trial Analysis
- 7.3.1. Analysis by Trial Registration Year
- 7.3.2. Analysis by Trial Phase
- 7.3.3. Analysis by Trial Status
- 7.3.4. Analysis by Type of Therapy
- 7.3.5. Analysis by Therapeutic Area
- 7.3.6. Analysis by Type of Sponsor / Collaborator
- 7.3.7. Analysis by Geographical Location and Trial Status
- 7.3.8. Most Active Players: Analysis by Number of Registered Trials
- 7.3.9. Analysis by Patients Enrolled and Trial Phase
- 7.3.10. Analysis by Patients Enrolled and Type of Therapy
- 7.3.11. Analysis by Patients Enrolled and Therapeutic Area
- 7.3.12. Analysis by Patients Enrolled, Trial Status and Geographical Location
- 7.4. AAV Vector based Therapies
- 7.4.1. Analysis by Trial Registration Year
- 7.4.2. Analysis by Trial Phase
- 7.4.3. Analysis by Trial Status
- 7.4.4. Analysis by Type of Therapy
- 7.4.5. Analysis by Therapeutic Area
- 7.4.6. Analysis by Type of Sponsor / Collaborator
- 7.4.7. Analysis by Geographical Location and Trial Status
- 7.4.8. Most Active Players: Analysis by Number of Registered Trials
- 7.4.9. Analysis by Patients Enrolled and Trial Phase
- 7.4.10. Analysis by Patients Enrolled and Type of Therapy
- 7.4.11. Analysis by Patients Enrolled and Therapeutic Area
- 7.4.12. Analysis by Patients Enrolled, Trial Status and Geographical Location
- 7.5. Adenoviral Vector based Therapies
- 7.5.1. Analysis by Trial Registration Year
- 7.5.2. Analysis by Trial Phase
- 7.5.3. Analysis by Trial Status
- 7.5.4. Analysis by Type of Therapy
- 7.5.5. Analysis by Therapeutic Area
- 7.5.6. Analysis by Type of Sponsor / Collaborator
- 7.5.7. Analysis by Geographical Location and Trial Status
- 7.5.8. Most Active Players: Analysis by Number of Registered Trials
- 7.5.9. Analysis by Patients Enrolled and Trial Phase
- 7.5.10. Analysis by Patients Enrolled and Type of Therapy
- 7.5.11. Analysis by Patients Enrolled and Therapeutic Area
- 7.5.12. Analysis by Patients Enrolled, Trial Status and Geographical Location
- 7.6. Lentiviral Vector based Therapies
- 7.6.1. Analysis by Trial Registration Year
- 7.6.2. Analysis by Trial Phase
- 7.6.3. Analysis by Trial Status
- 7.6.4. Analysis by Type of Therapy
- 7.6.5. Analysis by Therapeutic Area
- 7.6.6. Analysis by Type of Sponsor / Collaborator
- 7.6.7. Analysis by Geographical Location and Trial Status
- 7.6.8. Most Active Players: Analysis by Number of Registered Trials
- 7.6.9. Analysis by Patients Enrolled and Trial Phase
- 7.6.10. Analysis by Patients Enrolled and Type of Therapy
- 7.6.11. Analysis by Patients Enrolled and Therapeutic Area
- 7.6.12. Analysis by Patients Enrolled, Trial Status and Geographical Location
- 7.7. Retroviral Vector based Therapies
- 7.7.1. Analysis by Trial Registration Year
- 7.7.2. Analysis by Trial Phase
- 7.7.3. Analysis by Trial Status
- 7.7.4. Analysis by Type of Therapy
- 7.7.5. Analysis by Therapeutic Area
- 7.7.6. Analysis by Type of Sponsor / Collaborator
- 7.7.7. Analysis by Geographical Location and Trial Status
- 7.7.8. Most Active Players: Analysis by Number of Registered Trials
- 7.7.9. Analysis by Patients Enrolled and Trial Phase
- 7.7.10. Analysis by Patients Enrolled and Type of Therapy
- 7.7.11. Analysis by Patients Enrolled and Therapeutic Area
- 7.7.12. Analysis by Patients Enrolled, Trial Status and Geographical Location
- 7.8. Other Viral Vector based Therapies
- 7.8.1. Analysis by Trial Registration Year
- 7.8.2. Analysis by Trial Phase
- 7.8.3. Analysis by Trial Status
- 7.8.4. Analysis by Type of Therapy
- 7.8.5. Analysis by Therapeutic Area
- 7.8.6. Analysis by Type of Sponsor / Collaborator
- 7.8.7. Analysis by Geographical Location and Trial Status
- 7.8.8. Most Active Players: Analysis by Number of Registered Trials
- 7.8.9. Analysis by Patients Enrolled and Trial Phase
- 7.8.10. Analysis by Patients Enrolled and Type of Therapy
- 7.8.11. Analysis by Patients Enrolled and Therapeutic Area
- 7.8.12. Analysis by Patients Enrolled, Trial Status and Geographical Location
8. DEMAND ANALYSIS
- 8.1. Chapter Overview
- 8.2. Assumptions and Methodology
- 8.3. Global, Clinical Demand for Viral Vectors
- 8.3.1. Analysis by Type of Vector
- 8.3.2. Analysis by Type of Therapy
- 8.3.3. Analysis by Therapeutic Area
- 8.3.4. Analysis by Geographical Location
- 8.4. Global, Commercial Demand for Viral Vectors
- 8.4.1. Analysis by Type of Vector
- 8.4.2. Analysis by Type of Therapy
- 8.4.3. Analysis by Therapeutic Area
- 8.4.4. Analysis by Geographical Location
9. CASE STUDY: TANGENTIAL FLOW FILTRATION (TFF)
- 9.1. Chapter Overview
- 9.2. Role of TFF in Viral Vector Purification
- 9.2.1. Advantages of TFF
- 9.2.2. Disadvantages of TFF
- 9.3. TFF-related Product Suppliers
10. CASE STUDY: VIRAL VECTOR MANUFACTURERS
- 10.1. Chapter Overview
- 10.2. Commercial Scale Viral Vector Manufacturers
- 10.2.1. Analysis by Year of Establishment
- 10.2.2. Analysis by Company Size
- 10.2.3. Analysis by Type of Viral Vector
- 10.2.4. Analysis by Purpose of Production
- 10.2.5. Analysis by Geographical Location
11. MARKET SIZING AND OPPORTUNITY ANALYSIS
- 11.1. Chapter Overview
- 11.2. Forecast Methodology and Key Assumptions
- 11.3. Overall Viral Vector Purification Products Market, Till 2035
- 11.3.1. Viral Vector Purification Products Market: Distribution by Type of Viral Vector, Till 2035
- 11.3.2. Viral Vector Purification Products Market: Distribution by Type of Purification Technique, Till 2035
- 11.3.3. Viral Vector Purification Products Market: Distribution by Type of Therapy, Till 2035
- 11.3.4. Viral Vector Purification Products Market: Distribution by Therapeutic Area, Till 2035
- 11.3.5. Viral Vector Purification Products Market: Distribution by Scale of Operation, Till 2035
- 11.3.6. Viral Vector Purification Products Market: Distribution by Geographical Location, Till 2035
- 11.4. Viral Vector Purification Products Market for AAV Vectors, Till 2035
- 11.4.1. AAV Vector Purification Products Market: Distribution by Type of Purification Technique, Till 2035
- 11.4.2. AAV Vector Purification Products Market: Distribution by Type of Therapy, Till 2035
- 11.4.3. AAV Vector Purification Products Market: Distribution by Therapeutic Area, Till 2035
- 11.4.4. AAV Vector Purification Products Market: Distribution by Scale of Operation, Till 2035
- 11.4.5. AAV Vector Purification Products Market: Distribution by Geographical Location, Till 2035
- 11.5. Viral Vector Purification Products Market for Adenoviral Vectors, Till 2035
- 11.5.1. Adenoviral Vector Purification Products Market: Distribution by Type of Purification Technique, Till 2035
- 11.5.2. Adenoviral Vector Purification Products Market: Distribution by Type of Therapy, Till 2035
- 11.5.3. Adenoviral Vector Purification Products Market: Distribution by Therapeutic Area, Till 2035
- 11.5.4. Adenoviral Vector Purification Products Market: Distribution by Scale of Operation, Till 2035
- 11.5.5. Adenoviral Vector Purification Products Market: Distribution by Geographical Location, Till 2035
- 11.6. Viral Vector Purification Products Market for Lentiviral Vectors, Till 2035
- 11.6.1. Lentiviral Vector Purification Products Market: Distribution by Type of Purification Technique, Till 2035
- 11.6.2. Lentiviral Vector Purification Products Market: Distribution by Type of Therapy, Till 2035
- 11.6.3. Lentiviral Vector Purification Products Market: Distribution by Therapeutic Area, Till 2035
- 11.6.4. Lentiviral Vector Purification Products Market: Distribution by Scale of Operation, Till 2035
- 11.6.5. Lentiviral Vector Purification Products Market: Distribution by Geographical Location, Till 2035
- 11.7. Viral Vector Purification Products Market for Retroviral Vectors, Till 2035
- 11.7.1. Retroviral Vector Purification Products Market: Distribution by Type of Purification Technique, Till 2035
- 11.7.2. Retroviral Vector Purification Products Market: Distribution by Type of Therapy, Till 2035
- 11.7.3. Retroviral Vector Purification Products Market: Distribution by Therapeutic Area, Till 2035
- 11.7.4. Retroviral Vector Purification Products Market: Distribution by Scale of Operation, Till 2035
- 11.7.5. Retroviral Vector Purification Products Market: Distribution by Geographical Location, Till 2035
- 11.8. Viral Vector Purification Products Market for Other Viral Vectors, Till 2035
- 11.8.1. Other Viral Vector Purification Products Market: Distribution by Type of Purification Technique, Till 2035
- 11.8.2. Other Viral Vector Purification Products Market: Distribution by Type of Therapy, Till 2035
- 11.8.3. Other Viral Vector Purification Products Market: Distribution by Therapeutic Area, Till 2035
- 11.8.4. Other Viral Vector Purification Products Market: Distribution by Scale of Operation, Till 2035
- 11.8.5. Other Viral Vector Purification Products Market: Distribution by Geographical Location, Till 2035
12. CONCLUDING REMARKS
13. EXECUTIVE INSIGHTS
- 13.1. Chapter Overview
- 13.2. Company A
- 13.2.1. Company Snapshot
- 13.2.2. Interview Transcript: Chief Executive Officer
- 13.3. Company B
- 13.3.1. Company Snapshot
- 13.3.2. Interview Transcript: Chief Commercial Officer
- 13.4. Company C
- 13.4.1. Company Snapshot
- 13.4.2. Interview Transcript: Chief Scientific Officer
14. APPENDIX 1: TABULATED DATA
15. APPENDIX 2: LIST OF COMPANIES AND ORGANIZATIONS
List of Tables
- Table 3.1 Key Comparison of Different Types of Viral Vectors
- Table 4.1 List of Viral Vector Purification Products
- Table 4.2 Viral Vector Purification Products for Chromatography: Additional Details
- Table 4.3 Viral Vector Purification Products for Centrifugation: Additional Details
- Table 4.4 Viral Vector Purification Products for Filtration: Additional Details
- Table 4.5 List of Viral Vector Purification Products Developers
- Table 5.1 Agilent Technologies: Company Snapshot
- Table 5.2 Agilent Technologies: Recent Developments and Future Outlook
- Table 5.3 BIA Separations: Company Snapshot
- Table 5.4 BIA Separations: Recent Developments and Future Outlook
- Table 5.5 Bio-Rad Laboratories: Company Snapshot
- Table 5.6 Bio-Rad Laboratories: Recent Developments and Future Outlook
- Table 5.7 BioVision: Company Snapshot
- Table 5.8 BioVision: Recent Developments and Future Outlook
- Table 5.9 Cytiva (formerly GE Lifesciences): Company Snapshot
- Table 5.10 Cytiva (formerly GE Lifesciences): Recent Developments and Future Outlook
- Table 5.11 Merck: Company Snapshot
- Table 5.12 Merck: Recent Developments and Future Outlook
- Table 5.13 Sartorius: Company Snapshot
- Table 5.14 Sartorius: Recent Developments and Future Outlook
- Table 5.15 Takara Bio: Company Snapshot
- Table 5.16 Takara Bio: Recent Developments and Future Outlook
- Table 5.17 Thermo Fisher Scientific: Company Snapshot
- Table 5.18 Thermo Fisher Scientific: Recent Developments and Future Outlook
- Table 6.1 AAV Vector-based Therapy Developers: Most Likely Partners
- Table 6.2 AAV Vector-based Therapy Developers: Likely Partners
- Table 6.3 AAV Vector-based Therapy Developers: Less Likely Partners
- Table 6.4 AAV Vector-based Therapy Developers: Least Likely Partners
- Table 6.5 Adenoviral Vector-based Therapy Developers: Most Likely Partners
- Table 6.6 Adenoviral Vector-based Therapy Developers: Likely Partners
- Table 6.7 Adenoviral Vector-based Therapy Developers: Less Likely Partners
- Table 6.8 Adenoviral Vector-based Therapy Developers: Least Likely Partners
- Table 6.9 Lentiviral Vector-based Therapy Developers: Most Likely Partners
- Table 6.10 Lentiviral Vector-based Therapy Developers: Likely Partners
- Table 6.11 Lentiviral Vector-based Therapy Developers: Less Likely Partners
- Table 6.12 Lentiviral Vector-based Therapy Developers: Least Likely Partners
- Table 6.13 Retroviral Vector-based Therapy Developers: Most Likely Partners
- Table 6.14 Retroviral Vector-based Therapy Developers: Likely Partners
- Table 6.15 Retroviral Vector-based Therapy Developers: Less Likely Partners
- Table 6.16 Retroviral Vector-based Therapy Developers: Least Likely Partners
- Table 6.17 Other Viral Vector-based Therapy Developers: Most Likely Partners
- Table 6.18 Other Viral Vector-based Therapy Developers: Likely Partners
- Table 6.19 Other Viral Vector-based Therapy Developers: Less Likely Partners
- Table 6.20 Other Viral Vector-based Therapy Developers: Least Likely Partners
- Table 6.21 AAV Vector Manufacturers: Most Likely Partners
- Table 6.22 AAV Vector Manufacturers: Likely Partners
- Table 6.23 AAV Vector Manufacturers: Less Likely Partners
- Table 6.24 AAV Vector Manufacturers: Least Likely Partners
- Table 6.25 Adenoviral Vector Manufacturers: Most Likely Partners
- Table 6.26 Adenoviral Vector Manufacturers: Likely Partners
- Table 6.27 Adenoviral Vector Manufacturers: Less Likely Partners
- Table 6.28 Adenoviral Vector Manufacturers: Least Likely Partners
- Table 6.29 Lentiviral Vector Manufacturers: Most Likely Partners
- Table 6.30 Lentiviral Vector Manufacturers: Likely Partners
- Table 6.31 Lentiviral Vector Manufacturers: Less Likely Partners
- Table 6.32 Lentiviral Vector Manufacturers: Least Likely Partners
- Table 6.33 Retroviral Vector Manufacturers: Most Likely Partners
- Table 6.34 Retroviral Vector Manufacturers: Likely Partners
- Table 6.35 Retroviral Vector Manufacturers: Less Likely Partners
- Table 6.36 Retroviral Vector Manufacturers: Least Likely Partners
- Table 6.37 Other Viral Vector Manufacturers: Most Likely Partners
- Table 6.38 Other Viral Vector Manufacturers: Likely Partners
- Table 6.39 Other Viral Vector Manufacturers: Less Likely Partners
- Table 6.40 Other Viral Vector Manufacturers: Least Likely Partners
- Table 9.1 List of TFF Products
- Table 10.1 List of Commercial Scale Vector Manufacturers
- Table 12.1 Concluding Remarks
- Table 13.1 Virovek: Company Snapshot
- Table 13.2 Vigene Biosciences: Company Snapshot
- Table 13.3 Vibalogics: Company Snapshot
- Table 14.1 Viral Vector Purification Products: Distribution by Type of Product
- Table 14.2 Viral Vector Purification Products: Distribution by Type of Purification Technique
- Table 14.3 Viral Vector Purification Products: Distribution by Scale of Operation
- Table 14.4 Viral Vector Purification Products: Distribution by Type of Viral Vector
- Table 14.5 Viral Vector Purification Products: Distribution by Type of Chromatographic Technique
- Table 14.6 Viral Vector Purification Product Developers: Distribution by Year of Establishment
- Table 14.7 Viral Vector Purification Product Developers: Distribution by Company Size
- Table 14.8 Viral Vector Purification Product Developers: Distribution by Geographical Location
- Table 14.9 Viral Vector based Therapies: Distribution by Trial Registration Year
- Table 14.10 Viral Vector based Therapies: Distribution by Trial Phase
- Table 14.11 Viral Vector based Therapies: Distribution by Trial Status
- Table 14.12 Viral Vector based Therapies: Distribution by Type of Therapy
- Table 14.13 Viral Vector based Therapies: Distribution by Therapeutic Area
- Table 14.14 Viral Vector based Therapies: Distribution by Type of Sponsor / Collaborator
- Table 14.15 Viral Vector based Therapies: Distribution by Geographical Location and Trial Status
- Table 14.16 Viral Vector based Therapies: Most Active Players by Number of Registered Trials
- Table 14.17 Viral Vector based Therapies: Distribution by Patients Enrolled and Trial Phase
- Table 14.18 Viral Vector based Therapies: Distribution by Patients Enrolled and Type of Therapy
- Table 14.19 Viral Vector based Therapies: Distribution by Patients Enrolled and Therapeutic Area
- Table 14.20 Viral Vector based Therapies: Distribution by Patients Enrolled, Trial Status and Geographical Location
- Table 14.21 AAV Vector based Therapies: Distribution by Trial Registration Year
- Table 14.22 AAV Vector based Therapies: Distribution by Trial Phase
- Table 14.23 AAV Vector based Therapies: Distribution by Trial Status
- Table 14.24 AAV Vector based Therapies: Distribution by Type of Therapy
- Table 14.25 AAV Vector based Therapies: Distribution by Therapeutic Area
- Table 14.26 AAV Vector based Therapies: Distribution by Type of Sponsor / Collaborator
- Table 14.27 AAV Vector based Therapies: Distribution by Geographical Location and Trial Status
- Table 14.28 AAV Vector based Therapies: Most Active Players by Number of Registered Trials
- Table 14.29 AAV Vector based Therapies: Distribution by Patients Enrolled and Trial Phase
- Table 14.30 AAV Vector based Therapies: Distribution by Patients Enrolled and Type of Therapy
- Table 14.31 AAV Vector based Therapies: Distribution by Patients Enrolled and Therapeutic Area
- Table 14.32 AAV Vector based Therapies: Distribution by Patients Enrolled, Trial Status and Geographical Location
- Table 14.33 Adenoviral Vector based Therapies: Distribution by Trial Registration Year
- Table 14.34 Adenoviral Vector based Therapies: Distribution by Trial Phase
- Table 14.35 Adenoviral Vector based Therapies: Distribution by Trial Status
- Table 14.36 Adenoviral Vector based Therapies: Distribution by Type of Therapy
- Table 14.37 Adenoviral Vector based Therapies: Distribution by Therapeutic Area
- Table 14.38 Adenoviral Vector based Therapies: Distribution by Type of Sponsor / Collaborator
- Table 14.39 Adenoviral Vector based Therapies: Distribution by Geographical Location and Trial Status
- Table 14.40 Adenoviral Vector based Therapies: Most Active Players by Number of Registered Trials
- Table 14.41 Adenoviral Vector based Therapies: Distribution by Patients Enrolled and Trial Phase
- Table 14.42 Adenoviral Vector based Therapies: Distribution by Patients Enrolled and Type of Therapy
- Table 14.43 Adenoviral Vector based Therapies: Distribution by Patients Enrolled and Therapeutic Area
- Table 14.44 Adenoviral Vector based Therapies: Distribution by Patients Enrolled, Trial Status and Geographical Location
- Table 14.45 Lentiviral Vector based Therapies: Distribution by Trial Registration Year
- Table 14.46 Lentiviral Vector based Therapies: Distribution by Trial Phase
- Table 14.47 Lentiviral Vector based Therapies: Distribution by Trial Status
- Table 14.48 Lentiviral Vector based Therapies: Distribution by Type of Therapy
- Table 14.49 Lentiviral Vector based Therapies: Distribution by Therapeutic Area
- Table 14.50 Lentiviral Vector based Therapies: Distribution by Type of Sponsor / Collaborator
- Table 14.51 Lentiviral Vector based Therapies: Distribution by Geographical Location
- Table 14.52 Lentiviral Vector based Therapies: Most Active Players by Number of Registered Trials
- Table 14.53 Lentiviral Vector based Therapies: Distribution by Patients Enrolled and Trial Phase
- Table 14.54 Lentiviral Vector based Therapies: Distribution by Patients Enrolled and Type of Therapy
- Table 14.55 Lentiviral Vector based Therapies: Distribution by Patients Enrolled and Therapeutic Area
- Table 14.56 Lentiviral Vector based Therapies: Distribution by Patients Enrolled, Trial Status and Geographical Location
- Table 14.57 Retroviral Vector based Therapies: Distribution by Trial Registration Year
- Table 14.58 Retroviral Vector based Therapies: Distribution by Trial Phase
- Table 14.59 Retroviral Vector based Therapies: Distribution by Trial Status
- Table 14.60 Retroviral Vector based Therapies: Distribution by Type of Therapy
- Table 14.61 Retroviral Vector based Therapies: Distribution by Therapeutic Area
- Table 14.62 Retroviral Vector based Therapies: Distribution by Type of Sponsor / Collaborator
- Table 14.63 Retroviral Vector based Therapies: Distribution by Geographical Location
- Table 14.64 Retroviral Vector based Therapies: Most Active Players by Number of Registered Trials
- Table 14.65 Retroviral Vector based Therapies: Distribution by Patients Enrolled and Trial Phase
- Table 14.66 Retroviral Vector based Therapies: Distribution by Patients Enrolled and Type of Therapy
- Table 14.67 Retroviral Vector based Therapies: Distribution by Patients Enrolled and Therapeutic Area
- Table 14.68 Retroviral Vector based Therapies: Distribution by Patients Enrolled, Trial Status and Geographical Location
- Table 14.69 Other Viral Vector based Therapies: Distribution by Trial Registration Year
- Table 14.70 Other Viral Vector based Therapies: Distribution by Trial Phase
- Table 14.71 Other Viral Vector based Therapies: Distribution by Trial Status
- Table 14.72 Other Viral Vector based Therapies: Distribution by Type of Therapy
- Table 14.73 Other Viral Vector based Therapies: Distribution by Therapeutic Area
- Table 14.74 Other Viral Vector based Therapies: Distribution by Type of Sponsor / Collaborator
- Table 14.75 Other Viral Vector based Therapies: Distribution by Geographical Location
- Table 14.76 Other Viral Vector based Therapies: Most Active Players by Number of Registered Trials
- Table 14.77 Other Viral Vector based Therapies: Distribution by Patients Enrolled and Trial Phase
- Table 14.78 Other Viral Vector based Therapies: Distribution by Patients Enrolled and Type of Therapy
- Table 14.79 Other Viral Vector based Therapies: Distribution by Patients Enrolled and Therapeutic Area
- Table 14.80 Other Viral Vector based Therapies: Distribution by Patients Enrolled, Trial Status and Geographical Location
- Table 14.81 Global Clinical Demand for Viral Vectors, Till 2035 (Thousand Patients)
- Table 14.82 Clinical Demand for Viral Vectors: Distribution by Type of Vector (Thousand Patients)
- Table 14.83 Clinical Demand for Viral Vectors: Distribution by Type of Therapy (Thousand Patients)
- Table 14.84 Clinical Demand for Viral Vectors: Distribution by Therapeutic Area (Thousand Patients)
- Table 14.85 Clinical Demand for Viral Vectors: Distribution by Geographical Location (Thousand Patients)
- Table 14.86 Global Commercial Demand for Viral Vectors, Till 2035 (Thousand Patients)
- Table 14.87 Commercial Demand for Viral Vectors: Distribution by Type of Vector (Thousand Patients)
- Table 14.88 Commercial Demand for Viral Vectors: Distribution by Type of Therapy (Thousand Patients)
- Table 14.89 Commercial Demand for Viral Vectors: Distribution by Therapeutic Area (Thousand Patients)
- Table 14.90 Commercial Demand for Viral Vectors: Distribution by Geographical Location (Thousand Patients)
- Table 14.91 Commercial Scale Viral Vector Manufacturers: Distribution by Year of Establishment
- Table 14.92 Commercial Scale Viral Vector Manufacturers: Distribution by Company Size
- Table 14.93 Commercial Scale Viral Vector Manufacturers: Distribution by Type of Viral Vector
- Table 14.94 Commercial Scale Viral Vector Manufacturers: Distribution by Purpose of Production
- Table 14.95 Commercial Scale Viral Vector Manufacturers: Distribution by Geographical Location
- Table 14.96 Overall Viral Vector Purification Products Market, Conservative, Base and Optimistic Scenario, Conservative, Base and Optimistic Scenario, Till 2035 (USD Million)
- Table 14.97 Viral Vector Purification Products Market: Distribution by Type of Viral Vector, Conservative, Base and Optimistic Scenario, Conservative, Base and Optimistic Scenario, Till 2035 (USD Million)
- Table 14.98 Viral Vector Purification Products Market: Distribution by Type of Purification Technique, Conservative, Base and Optimistic Scenario, Conservative, Base and Optimistic Scenario, Till 2035 (USD Million)
- Table 14.99 Viral Vector Purification Products Market: Distribution by Type of Therapy, Conservative, Base and Optimistic Scenario, Conservative, Base and Optimistic Scenario, Till 2035 (USD Million)
- Table 14.100 Viral Vector Purification Products Market: Distribution by Therapeutic Area, Conservative, Base and Optimistic Scenario, Conservative, Base and Optimistic Scenario, Till 2035 (USD Million)
- Table 14.101 Viral Vector Purification Products Market: Distribution by Scale of Operation, Conservative, Base and Optimistic Scenario, Till 2035 (USD Million)
- Table 14.102 Viral Vector Purification Products Market: Distribution by Geographical Location, Conservative, Base and Optimistic Scenario, Till 2035 (USD Million)
- Table 14.103 Viral Vector Purification Products Market for AAV Vectors, Conservative, Base and Optimistic Scenario, Till 2035 (USD Million)
- Table 14.104 AAV Vector Purification Products Market: Distribution by Type of Purification Technique, Conservative, Base and Optimistic Scenario, Till 2035 (USD Million)
- Table 14.105 AAV Vector Purification Products Market: Distribution by Type of Therapy, Conservative, Base and Optimistic Scenario, Till 2035 (USD Million)
- Table 14.106 AAV Vector Purification Products Market: Distribution by Therapeutic Area, Conservative, Base and Optimistic Scenario, Till 2035 (USD Million)
- Table 14.107 AAV Vector Purification Products Market: Distribution by Scale of Operation, Conservative, Base and Optimistic Scenario, Till 2035 (USD Million)
- Table 14.108 AAV Vector Purification Products Market: Distribution by Geographical Location, Conservative, Base and Optimistic Scenario, Till 2035 (USD Million)
- Table 14.109 Viral Vector Purification Products Market for Adenoviral Vectors, Conservative, Base and Optimistic Scenario, Till 2035 (USD Million)
- Table 14.110 Adenoviral Vector Purification Products Market: Distribution by Type of Purification Technique, Conservative, Base and Optimistic Scenario, Till 2035 (USD Million)
- Table 14.111 Adenoviral Vector Purification Products Market: Distribution by Type of Therapy, Conservative, Base and Optimistic Scenario, Till 2035 (USD Million)
- Table 14.112 Adenoviral Vector Purification Products Market: Distribution by Therapeutic Area, Conservative, Base and Optimistic Scenario, Till 2035 (USD Million)
- Table 14.113 Adenoviral Vector Purification Products Market: Distribution by Scale of Operation, Conservative, Base and Optimistic Scenario, Till 2035 (USD Million)
- Table 14.114 Adenoviral Vector Purification Products Market: Distribution by Geographical Location, Conservative, Base and Optimistic Scenario, Till 2035 (USD Million)
- Table 14.115 Viral Vector Purification Products Market for Lentiviral Vectors, Conservative, Base and Optimistic Scenario, Till 2035 (USD Million)
- Table 14.116 Lentiviral Vector Purification Products Market: Distribution by Type of Purification Technique, Conservative, Base and Optimistic Scenario, Till 2035 (USD Million)
- Table 14.117 Lentiviral Vector Purification Products Market: Distribution by Type of Therapy, Conservative, Base and Optimistic Scenario, Till 2035 (USD Million)
- Table 14.118 Lentiviral Vector Purification Products Market: Distribution by Therapeutic Area, Conservative, Base and Optimistic Scenario, Till 2035 (USD Million)
- Table 14.119 Lentiviral Vector Purification Products Market: Distribution by Scale of Operation, Conservative, Base and Optimistic Scenario, Till 2035 (USD Million)
- Table 14.120 Lentiviral Vector Purification Products Market: Distribution by Geographical Location, Conservative, Base and Optimistic Scenario, Till 2035 (USD Million)
- Table 14.121 Viral Vector Purification Products Market for Retroviral Vectors, Conservative, Base and Optimistic Scenario, Till 2035 (USD Million)
- Table 14.122 Retroviral Vector Purification Products Market: Distribution by Type of Purification Technique, Conservative, Base and Optimistic Scenario, Till 2035 (USD Million)
- Table 14.123 Retroviral Vector Purification Products Market: Distribution by Type of Therapy, Conservative, Base and Optimistic Scenario, Till 2035 (USD Million)
- Table 14.124 Retroviral Vector Purification Products Market: Distribution by Therapeutic Area, Conservative, Base and Optimistic Scenario, Till 2035 (USD Million)
- Table 14.125 Retroviral Vector Purification Products Market: Distribution by Scale of Operation, Conservative, Base and Optimistic Scenario, Till 2035 (USD Million)
- Table 14.126 Retroviral Vector Purification Products Market: Distribution by Geographical Location, Conservative, Base and Optimistic Scenario, Till 2035 (USD Million)
- Table 14.127 Viral Vector Purification Products Market for Other Viral Vectors, Conservative, Base and Optimistic Scenario, Till 2035 (USD Million)
- Table 14.128 Other Viral Vector Purification Products Market: Distribution by Type of Purification Technique, Conservative, Base and Optimistic Scenario, Till 2035 (USD Million)
- Table 14.129 Other Viral Vector Purification Products Market: Distribution by Type of Therapy, Conservative, Base and Optimistic Scenario, Till 2035 (USD Million)
- Table 14.130 Other Viral Vector Purification Products Market: Distribution by Therapeutic Area, Conservative, Base and Optimistic Scenario, Till 2035 (USD Million)
- Table 14.131 Other Viral Vector Purification Products Market: Distribution by Scale of Operation, Conservative, Base and Optimistic Scenario, Till 2035 (USD Million)
- Table 14.132 Other Viral Vector Purification Products Market: Distribution by Geographical Location, Conservative, Base and Optimistic Scenario, Till 2035 (USD Million)
List of Figures
- Figure 3.1 Gene Transfer: Viral and Non-Viral Methods
- Figure 3.2 Vector Manufacturing: Different Types of Manufacturers
- Figure 3.3 Vector Manufacturing: Process Steps
- Figure 4.1 Viral Vector Purification Products: Distribution by Type of Product
- Figure 4.2 Viral Vector Purification Products: Distribution by Type of Purification Technique
- Figure 4.3 Viral Vector Purification Products: Distribution by Scale of Operation
- Figure 4.4 Viral Vector Purification Products: Distribution by Type of Viral Vector
- Figure 4.5 Viral Vector Purification Products: Distribution by Type of Chromatographic Technique
- Figure 4.6 Viral Vector Purification Product Developers: Distribution by Year of Establishment
- Figure 4.7 Viral Vector Purification Product Developers: Distribution by Company Size
- Figure 4.8 Viral Vector Purification Product Developers: Distribution by Geographical Location
- Figure 7.1 Viral Vector based Therapies: Distribution by Trial Registration Year
- Figure 7.2 Viral Vector-based Therapies: Distribution by Trial Phase
- Figure 7.3 Viral Vector-based Therapies: Distribution by Trial Status
- Figure 7.4 Viral Vector-based Therapies: Distribution by Type of Therapy
- Figure 7.5 Viral Vector-based Therapies: Distribution by Therapeutic Area
- Figure 7.6 Viral Vector-based Therapies: Distribution by Type of Sponsor / Collaborator
- Figure 7.7 Viral Vector-based Therapies: Distribution by Geographical Location and Trial Status
- Figure 7.8 Viral Vector based Therapies: Most Active Players by Number of Registered Trials
- Figure 7.9 Viral Vector-based Therapies: Distribution by Patients Enrolled and Trial Phase
- Figure 7.10 Viral Vector-based Therapies: Distribution by Patients Enrolled and Type of Therapy
- Figure 7.11 Viral Vector-based Therapies: Distribution by Patients Enrolled and Therapeutic Area
- Figure 7.12 Viral Vector-based Therapies: Distribution by Patients Enrolled, Trial Status and Geographical Location
- Figure 7.13 AAV Vector-based Therapies: Distribution by Trial Registration Year
- Figure 7.14 AAV Vector-based Therapies: Distribution by Trial Phase
- Figure 7.15 AAV Vector-based Therapies: Distribution by Trial Status
- Figure 7.16 AAV Vector-based Therapies: Distribution by Type of Therapy
- Figure 7.17 AAV Vector-based Therapies: Distribution by Therapeutic Area
- Figure 7.18 AAV Vector-based Therapies: Distribution by Type of Sponsor / Collaborator
- Figure 7.19 AAV Vector--based Therapies: Distribution by Geographical Location and Trial Status
- Figure 7.20 AAV Vector-based Therapies: Most Active Players by Number of Registered Trials
- Figure 7.21 AAV Vector-based Therapies: Distribution by Patients Enrolled and Trial Phase
- Figure 7.22 AAV Vector-based Therapies: Distribution by Patients Enrolled and Type of Therapy
- Figure 7.23 AAV Vector-based Therapies: Distribution by Patients Enrolled and Therapeutic Area
- Figure 7.24 AAV Vector-based Therapies: Distribution by Patients Enrolled, Trial Status and Geographical Location
- Figure 7.25 Adenoviral Vector-based Therapies: Distribution by Trial Registration Year
- Figure 7.26 Adenoviral Vector-based Therapies: Distribution by Trial Phase
- Figure 7.27 Adenoviral Vector-based Therapies: Distribution by Trial Status
- Figure 7.28 Adenoviral Vector-based Therapies: Distribution by Type of Therapy
- Figure 7.29 Adenoviral Vector-based Therapies: Distribution by Therapeutic Area
- Figure 7.30 Adenoviral Vector-based Therapies: Distribution by Type of Sponsor / Collaborator
- Figure 7.31 Adenoviral Vector-based Therapies: Distribution by Geographical Location and Trial Status
- Figure 7.32 Adenoviral Vector-based Therapies: Most Active Players by Number of Registered Trials
- Figure 7.33 Adenoviral Vector-based Therapies: Distribution by Patients Enrolled and Trial Phase
- Figure 7.34 Adenoviral Vector-based Therapies: Distribution by Patients Enrolled and Type of Therapy
- Figure 7.35 Adenoviral Vector-based Therapies: Distribution by Patients Enrolled and Therapeutic Area
- Figure 7.36 Adenoviral Vector-based Therapies: Distribution by Patients Enrolled, Trial Status and Geographical Location
- Figure 7.37 Lentiviral Vector-based Therapies: Distribution by Trial Registration Year
- Figure 7.38 Lentiviral Vector-based Therapies: Distribution by Trial Phase
- Figure 7.39 Lentiviral Vector-based Therapies: Distribution by Trial Status
- Figure 7.40 Lentiviral Vector-based Therapies: Distribution by Type of Therapy
- Figure 7.41 Lentiviral Vector-based Therapies: Distribution by Therapeutic Area
- Figure 7.42 Lentiviral Vector-based Therapies: Distribution by Type of Sponsor / Collaborator
- Figure 7.43 Lentiviral Vector-based Therapies: Distribution by Geographical Location
- Figure 7.44 Lentiviral Vector-based Therapies: Most Active Players by Number of Registered Trials
- Figure 7.45 Lentiviral Vector-based Therapies: Distribution by Patients Enrolled and Trial Phase
- Figure 7.46 Lentiviral Vector-based Therapies: Distribution by Patients Enrolled and Type of Therapy
- Figure 7.47 Lentiviral Vector-based Therapies: Distribution by Patients Enrolled and Therapeutic Area
- Figure 7.48 Lentiviral Vector-based Therapies: Distribution by Patients Enrolled, Trial Status and Geographical Location
- Figure 7.49 Retroviral Vector-based Therapies: Distribution by Trial Registration Year
- Figure 7.50 Retroviral Vector-based Therapies: Distribution by Trial Phase
- Figure 7.51 Retroviral Vector-based Therapies: Distribution by Trial Status
- Figure 7.52 Retroviral Vector-based Therapies: Distribution by Type of Therapy
- Figure 7.53 Retroviral Vector-based Therapies: Distribution by Therapeutic Area
- Figure 7.54 Retroviral Vector-based Therapies: Distribution by Type of Sponsor / Collaborator
- Figure 7.55 Retroviral Vector-based Therapies: Distribution by Geographical Location
- Figure 7.56 Retroviral Vector-based Therapies: Most Active Players by Number of Registered Trials
- Figure 7.57 Retroviral Vector-based Therapies: Distribution by Patients Enrolled and Trial Phase
- Figure 7.58 Retroviral Vector-based Therapies: Distribution by Patients Enrolled and Type of Therapy
- Figure 7.59 Retroviral Vector-based Therapies: Distribution by Patients Enrolled and Therapeutic Area
- Figure 7.60 Retroviral Vector-based Therapies: Distribution by Patients Enrolled, Trial Status and Geographical Location
- Figure 7.61 Other Viral Vector-based Therapies: Distribution by Trial Registration Year
- Figure 7.62 Other Viral Vector-based Therapies: Distribution by Trial Phase
- Figure 7.63 Other Viral Vector-based Therapies: Distribution by Trial Status
- Figure 7.64 Other Viral Vector-based Therapies: Distribution by Type of Therapy
- Figure 7.65 Other Viral Vector-based Therapies: Distribution by Therapeutic Area
- Figure 7.66 Other Viral Vector-based Therapies: Distribution by Type of Sponsor / Collaborator
- Figure 7.67 Other Viral Vector-based Therapies: Distribution by Geographical Location
- Figure 7.68 Other Viral Vector-based Therapies: Most Active Players by Number of Registered Trials
- Figure 7.69 Other Viral Vector-based Therapies: Distribution by Patients Enrolled and Trial Phase
- Figure 7.70 Other Viral Vector-based Therapies: Distribution by Patients Enrolled and Type of Therapy
- Figure 7.71 Other Viral Vector-based Therapies: Distribution by Patients Enrolled and Therapeutic Area
- Figure 7.72 Other Viral Vector-based Therapies: Distribution by Patients Enrolled, Trial Status and Geographical Location
- Figure 8.1. Global Clinical Demand for Viral Vectors, Till 2035 (Thousand Patients)
- Figure 8.2. Clinical Demand for Viral Vectors: Distribution by Type of Vector (Thousand Patients)
- Figure 8.3. Clinical Demand for Viral Vectors: Distribution by Type of Therapy (Thousand Patients)
- Figure 8.4. Clinical Demand for Viral Vectors: Distribution by Therapeutic Area (Thousand Patients)
- Figure 8.5. Clinical Demand for Viral Vectors: Distribution by Geographical Location (Thousand Patients)
- Figure 8.6. Global Commercial Demand for Viral Vectors, Till 2035 (Thousand Patients)
- Figure 8.7. Commercial Demand for Viral Vectors: Distribution by Type of Vector (Thousand Patients)
- Figure 8.8. Commercial Demand for Viral Vectors: Distribution by Type of Therapy (Thousand Patients)
- Figure 8.9. Commercial Demand for Viral Vectors: Distribution by Therapeutic Area (Thousand Patients)
- Figure 8.10. Commercial Demand for Viral Vectors: Distribution by Geographical Location (Thousand Patients)
- Figure 10.1 Commercial Scale Viral Vector Manufacturers: Distribution by Year of Establishment
- Figure 10.2 Commercial Scale Viral Vector Manufacturers: Distribution by Company Size
- Figure 10.3 Commercial Scale Viral Vector Manufacturers: Distribution by Type of Viral Vector
- Figure 10.4 Commercial Scale Viral Vector Manufacturers: Distribution by Purpose of Production
- Figure 10.5 Commercial Scale Viral Vector Manufacturers: Distribution by Geographical Location
- Figure 11.1 Overall Viral Vector Purification Products Market, Till 2035 (USD Million)
- Figure 11.2 Viral Vector Purification Products Market: Distribution by Type of Viral Vector, Till 2035 (USD Million)
- Figure 11.3 Viral Vector Purification Products Market: Distribution by Type of Purification Technique, Till 2035 (USD Million)
- Figure 11.4 Viral Vector Purification Products Market: Distribution by Type of Therapy, Till 2035 (USD Million)
- Figure 11.5 Viral Vector Purification Products Market: Distribution by Therapeutic Area, Till 2035 (USD Million)
- Figure 11.6 Viral Vector Purification Products Market: Distribution by Scale of Operation, Till 2035 (USD Million)
- Figure 11.7 Viral Vector Purification Products Market: Distribution by Geographical Location, Till 2035 (USD Million)
- Figure 11.8 Viral Vector Purification Products Market for AAV Vectors, Till 2035 (USD Million)
- Figure 11.9 AAV Vector Purification Products Market: Distribution by Type of Purification Technique, Till 2035 (USD Million)
- Figure 11.10 AAV Vector Purification Products Market: Distribution by Type of Therapy, Till 2035 (USD Million)
- Figure 11.11 AAV Vector Purification Products Market: Distribution by Therapeutic Area, Till 2035 (USD Million)
- Figure 11.12 AAV Vector Purification Products Market: Distribution by Scale of Operation, Till 2035 (USD Million)
- Figure 11.13 AAV Vector Purification Products Market: Distribution by Geographical Location, Till 2035 (USD Million)
- Figure 11.14 Viral Vector Purification Products Market for Adenoviral Vectors, Till 2035 (USD Million)
- Figure 11.15 Adenoviral Vector Purification Products Market: Distribution by Type of Purification Technique, Till 2035 (USD Million)
- Figure 11.16 Adenoviral Vector Purification Products Market: Distribution by Type of Therapy, Till 2035 (USD Million)
- Figure 11.17 Adenoviral Vector Purification Products Market: Distribution by Therapeutic Area, Till 2035 (USD Million)
- Figure 11.18 Adenoviral Vector Purification Products Market: Distribution by Scale of Operation, Till 2035 (USD Million)
- Figure 11.19 Adenoviral Vector Purification Products Market: Distribution by Geographical Location, Till 2035 (USD Million)
- Figure 11.20 Viral Vector Purification Products Market for Lentiviral Vectors, Till 2035 (USD Million)
- Figure 11.21 Lentiviral Vector Purification Products Market: Distribution by Type of Purification Technique, Till 2035 (USD Million)
- Figure 11.22 Lentiviral Vector Purification Products Market: Distribution by Type of Therapy, Till 2035 (USD Million)
- Figure 11.23 Lentiviral Vector Purification Products Market: Distribution by Therapeutic Area, Till 2035 (USD Million)
- Figure 11.24 Lentiviral Vector Purification Products Market: Distribution by Scale of Operation, Till 2035 (USD Million)
- Figure 11.25 Lentiviral Vector Purification Products Market: Distribution by Geographical Location, Till 2035 (USD Million)
- Figure 11.26 Viral Vector Purification Products Market for Retroviral Vectors, Till 2035 (USD Million)
- Figure 11.27 Retroviral Vector Purification Products Market: Distribution by Type of Purification Technique, Till 2035 (USD Million)
- Figure 11.28 Retroviral Vector Purification Products Market: Distribution by Type of Therapy, Till 2035 (USD Million)
- Figure 11.29 Retroviral Vector Purification Products Market: Distribution by Therapeutic Area, Till 2035 (USD Million)
- Figure 11.30 Retroviral Vector Purification Products Market: Distribution by Scale of Operation, Till 2035 (USD Million)
- Figure 11.31 Retroviral Vector Purification Products Market: Distribution by Geographical Location, Till 2035 (USD Million)
- Figure 11.32 Viral Vector Purification Products Market for Other Viral Vectors, Till 2035 (USD Million)
- Figure 11.33 Other Viral Vector Purification Products Market: Distribution by Type of Purification Technique, Till 2035 (USD Million)
- Figure 11.34 Other Viral Vector Purification Products Market: Distribution by Type of Therapy, Till 2035 (USD Million)
- Figure 11.35 Other Viral Vector Purification Products Market: Distribution by Therapeutic Area, Till 2035 (USD Million)
- Figure 11.36 Other Viral Vector Purification Products Market: Distribution by Scale of Operation, Till 2035 (USD Million)
- Figure 11.37 Other Viral Vector Purification Products Market: Distribution by Geographical Location, Till 2035 (USD Million)

