
PUBLISHER: Roots Analysis | PRODUCT CODE: 1762536

PUBLISHER: Roots Analysis | PRODUCT CODE: 1762536
Depressive Disorders Market: Industry Trends and Global Forecasts - Distribution by Type of Depression, Type of Molecule, Type of Therapy, Route of Administration and Key Geographical Regions
DEPRESSIVE DISORDERS MARKET: OVERVIEW
As per Roots Analysis, the global depressive disorders market is anticipated to grow at a lucrative CAGR during the forecast period.
The market sizing and opportunity analysis has been segmented across the following parameters:
Type of Depression
- Major Depression Disorder
- Bipolar Disorder
- Postpartum Depression
- Treatment-Resistant Depression
- Others
Type of Molecule
- Small Molecule
- Biologic
Type of Therapy
- Monotherapy
- Adjunctive Therapy
- Combination Therapy
- Sequential Therapy
Route of Administration
- Oral
- Parenteral
- Nasal
- Transdermal
Key Geographical Regions
- North America
- Europe
- Asia-Pacific
DEPRESSIVE DISORDERS MARKET: GROWTH AND TRENDS
Depression is a mental health disorder characterized by a constant feeling of sadness and lack of interest in external stimuli. Notably, this chronic condition is considered among the leading causes of mental disability worldwide. In fact, it is worth mentioning that, globally more than 300 million people of all age groups suffer from depression. Moreover, depressive disorders are estimated to cause an economic burden of approximately USD 210 billion in the US, annually. Despite its widespread occurrence and substantial impact, less than 50% of people with this condition receive treatment in high-income countries, and this number drops to less than 10% in low-income countries. As a result, a large number of branded drugs and over 150 generic products have been approved by the FDA to treat depression among patients. Despite the availability of generics and other branded drugs, patients have voiced the need for better antidepressants.

Consequently, the rising demand for better antidepressants has led stakeholders to undertake various initiatives to develop interventions and drug / therapy candidates with novel mechanism of action to treat depression. Recently, stakeholders have begun relying more on personalized approaches, incorporating new therapies, such as Transcranial Direct Current Stimulation (tDCS) and ketamine, and exploring the link between the gut microbiome and depression.
DEPRESSIVE DISORDERS MARKET: KEY INSIGHTS
The report delves into the current state of the global depressive disorders market and identifies potential growth opportunities within industry. Some key findings from the report include:
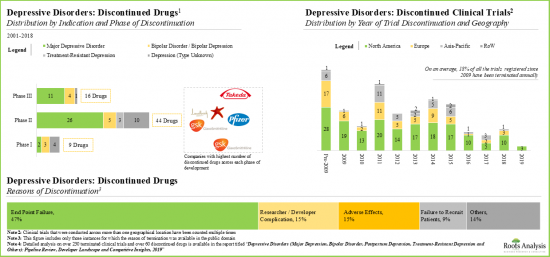
- Over the past few years, the depressive disorders market has witnessed multiple clinical stage drug failures; amongst the various reported reasons, inability to achieve specific clinical endpoints was the most common.
- The current market landscape is fragmented, featuring small companies and established pharma giants, which are engaged in the development of over 65 drug candidates for treating different forms of depression.
- Several molecules in the development pipeline are in the late stages of clinical development; majority of the drugs are monotherapies and designed for delivery via oral route.
- With several marketed drugs and a healthy clinical pipeline, the opportunity in this domain is expected to evolve steadily as more product candidates get approved.
- Majority of the lead molecules are being evaluated as monotherapies; however, developers are also evaluating certain drugs as an adjunctive or combination therapy.
- Currently, the depressive drugs pipeline is dominated by orally administrable drugs; however, other routes of administration, such as nasal and transdermal, are also being investigated.
- Although clinical studies are registered across various geographies, maximum number of trials are being conducted in North America; over 70% of clinical trials are evaluating drugs in Phase II / Phase III.
- In lieu of the evolving product landscape, drug developers are putting in significant efforts to ensure that their candidates are clinically and commercially competent.
- A substantial proportion of partnerships in this domain are focused on digital therapeutics initiatives; with over USD 3 billion investments since 2010, companies have received active support from investors.
- Companies, such as Janssen Pharmaceutical, Lundbeck, Vistagen Therapeutics, Takeda Pharmaceutical and Otsuka Pharmaceutical, have signed multiple deals related to depressive disorders; majority of the aforementioned agreements were signed for R&D purpose.
- Around 60% of the total amount was invested in the last three years. Specifically, till March alone, companies engaged in this domain had collectively raised USD 650 million. Overall, a sum of USD 2.8 billion was raised by various industry stakeholders through secondary offerings.
- Stakeholders are exploring diverse commercialization strategies across different stages of a product's launch cycle; with drugs nearing patent expiry, developers are expected to adopt lifecycle management approaches.
Example Players in the Depressive Disorders Market
- AbbVie
- AstraZeneca
- Bristol-Myers Squibb
- Eli Lilly
- GSK
- H. Lundbeck
- Johnson & Johnson
- Merck
- Pfizer
- Sanofi
DEPRESSIVE DISORDERS MARKET: RESEARCH COVERAGE
- Market Sizing and Opportunity Analysis: The report features an in-depth analysis of the depressive disorders market, focusing on key market segments, including [A] type of depression, [B] type of molecule, [C] type of therapy, [D] route of administration and [E] key geographical regions.
- Market Landscape: A comprehensive evaluation of market landscape, based on several relevant parameters, such as [A] information on drug developer(s), [B] phase of development, [C] type of molecule, [D] type of therapy, [E] type of depression, [F] type of drug class, [G] mechanism of action, [H] dosing frequency and [I] route of administration.
- Discontinued Drug Development Programs Case Study: In-depth assessment of discontinued drugs / trials, focusing on [A] the number of discontinued drug development programs, [B] year of discontinuation, [C] geographical location, [D] phase at which the development program was discontinued, [E] mechanism of action of discontinued drug, [F] disease indication, [G] reason(s) for discontinuation and [H] information on affiliated developer companies.
- Partnerships and Collaborations: A detailed analysis of the deals inked by stakeholders in this domain, based on various parameters, such as [A] year of partnership, [B] type of partnership, [C] area of focus, [D] type of depressive disorder, [E] geography and [F] most active players.
- Fundings and Investments: An in-depth analysis of the fundings received by players in depressive disorders domain, based on relevant parameters, such as [A] number of funding instances, [B] amount invested, [C] type of funding, [D] most active players, [E] most active investors and [F] geography.
- Clinical Trial Analysis: An insightful analysis of clinical trials related to depressive disorders, based on several parameters, such as [A] trial registration year, [B] current trial status, [C] current trial phase, [D] type of depressive disorder, [E] mechanism of action, [F] leading industry and non-industry players with highest number of completed / ongoing trials, [G] regional distribution of clinical trials and [H] enrolled patient population across different geographies.
- Clinical Trial Endpoints Analysis: A detailed analysis of the clinical endpoints in late-stage ongoing and planned studies, for various types of depressive disorders.
- Clinical and Commercial Attractiveness Analysis: A comprehensive assessment of clinical and commercial attractiveness of pipeline molecules based on several parameters, such as [A] size of enrolled patient population, [B] route of administration, [C] therapy type and dosing frequency, [D] target patient population, [E] expected launch date and [F] size of developer company.
- Key Commercialization Strategies: A detailed discussion on the various strategies that can be adopted by the drug developers across key commercialization stages including a timeline representation of the key strategies adopted.
- Digital Therapeutics for Depressive Disorders Case Study: A detailed discussion on the upcoming digital health solutions for the management / treatment of depression, featuring information on the various product development pathways adopted by companies involved in this segment of the market.
KEY QUESTIONS ANSWERED IN THIS REPORT
- How many companies are currently engaged in this market?
- Which are the leading companies in this market?
- What factors are likely to influence the evolution of this market?
- What is the current and future market size?
- What is the CAGR of this market?
- How is the current and future market opportunity likely to be distributed across key market segments?
REASONS TO BUY THIS REPORT
- The report provides a comprehensive market analysis, offering detailed revenue projections of the overall market and its specific sub-segments. This information is valuable to both established market leaders and emerging entrants.
- Stakeholders can leverage the report to gain a deeper understanding of the competitive dynamics within the market. By analyzing the competitive landscape, businesses can make informed decisions to optimize their market positioning and develop effective go-to-market strategies.
- The report offers stakeholders a comprehensive overview of the market, including key drivers, barriers, opportunities, and challenges. This information empowers stakeholders to stay abreast of market trends and make data-driven decisions to capitalize on growth prospects.
ADDITIONAL BENEFITS
- Complimentary PPT Insights Packs
- Complimentary Excel Data Packs for all Analytical Modules in the Report
- 15% Free Content Customization
- Detailed Report Walkthrough Session with Research Team
- Free Updated report if the report is 6-12 months old or older
TABLE OF CONTENTS
1. PREFACE
- 1.1. Scope of the Report
- 1.2. Research Methodology
- 1.2.1. Research Assumptions
- 1.2.2. Project Methodology
- 1.2.3. Forecast Methodology
- 1.2.4. Robust Quality Control
- 1.2.5. Key Considerations
- 1.2.5.1. Demographics
- 1.2.5.2. Economic Factors
- 1.2.5.3. Government Regulations
- 1.2.5.4. Supply Chain
- 1.2.5.5. COVID Impact / Related Factors
- 1.2.5.6. Market Access
- 1.2.5.7. Healthcare Policies
- 1.2.5.8. Industry Consolidation
- 1.3 Key Questions Answered
- 1.4. Chapter Outlines
2. EXECUTIVE SUMMARY
3. INTRODUCTION
- 3.1. An Overview of Depression and Depressive Disorders
- 3.2. Signs and Symptoms of Depression
- 3.3. Types of Depression
- 3.4. Epidemiology of Depression
- 3.5. Causes of Depression
- 3.6. Diagnosis of Depression
- 3.7. Current Treatment Paradigms
- 3.7.1. Pharmacological Treatment
- 3.7.2. Psychological Treatment
- 3.7.3. Other Treatments
- 3.8. Innovative Therapeutic Strategies
- 3.9. Future Perspectives
4. PIPELINE REVIEW: MARKETED AND CLINICAL STAGE DRUGS
- 4.1. Chapter Overview
- 4.2. Depressive Disorders: Marketed and Development Pipeline
- 4.2.1. Analysis by Phase of Development
- 4.2.2. Analysis by Type of Depressive Disorder
- 4.2.3. Analysis by Type of Therapy
- 4.2.4. Analysis by Type of Molecules
- 4.2.5. Analysis by Route of Administration
- 4.2.6. Analysis by Dosing Frequency
- 4.2.7. Analysis by Type of Drug and Drug Class
- 4.2.8. Major Depressive Disorder
- 4.2.8.1. Analysis by Phase of Development
- 4.2.8.2. Analysis by Route of Administration
- 4.2.8.3. Analysis by Dosing Frequency
- 4.2.8.4. Key Players
- 4.2.9. Bipolar Disorder / Bipolar Depression
- 4.2.9.1. Analysis by Phase of Development
- 4.2.9.2. Analysis by Route of Administration
- 4.2.9.3. Analysis by Dosing Frequency
- 4.2.9.4. Key Players
- 4.2.10. Treatment-Resistant Depression
- 4.2.10.1. Analysis by Phase of Development
- 4.2.10.2. Analysis by Route of Administration
- 4.2.10.3. Analysis by Dosing Frequency
- 4.2.10.4. Key Players
- 4.2.11. Postpartum Depression and Depression (Type Unknown)
- 4.2.11.1. Analysis by Phase of Development
- 4.2.11.2. Analysis by Route of Administration
- 4.2.11.3. Analysis by Dosing Frequency
- 4.2.11.4. Key Players
- 4.2.12 Grid Analysis: Distribution by Phase of Development, Type of Depressive Disorder and Type of Drug
- 4.3. Depressive Disorders: List of Drug Developers
- 4.3.1. Analysis by Year of Establishment of Developers
- 4.3.2. Analysis by Company Size
- 4.3.3. Analysis by Geographical Location of Developers
- 4.3.4. Analysis by Type of Depressive Disorder
- 4.3.5. Key Developers
- 4.3.6. Grid Analysis: Distribution by Location of Developer, Company Size and Type of Depressive Disorder
- 4.4 Other Novel Ways to Treat Depression
- 4.4.1. Role of Neurostimulation Devices
- 4.4.2. Role of Microbiome Therapeutics
5. CASE STUDY: DISCONTINUED DRUG DEVELOPMENT PROGRAMS
- 5.1. Chapter Overview
- 5.2. Depressive Disorders: Discontinued Drugs
- 5.2.1. Analysis by Year of Discontinuation
- 5.2.2. Analysis by Phase of Discontinuation
- 5.2.3. Analysis by Mechanism of Action
- 5.2.4. Analysis by Type of Depressive Disorder
- 5.2.5. Key Players
- 5.2.6. Analysis by Reason for Discontinuation
- 5.3. Depressive Disorders: Discontinued Clinical Trials
- 5.3.1. Year-wise Trend of Discontinued Trials
- 5.3.2. Analysis of Discontinued Clinical Trials by Phase of Development
- 5.3.3. Analysis of Discontinued Clinical Trials by Sponsor / Collaborator
- 5.3.4. Analysis of Discontinued Clinical Trials by Geography
- 5.3.5. Analysis of Discontinued Clinical Trials by Reason of Discontinuation
- 5.4. Concluding Remarks
6. PARTNERSHIPS AND COLLABORATIONS
- 6.1. Chapter Overview
- 6.2. Partnership Models
- 6.3. Depressive Disorders: List of Partnerships and Collaborations
- 6.3.1. Analysis by Year of Partnerships
- 6.3.2. Analysis by Type of Partnership
- 6.3.3. Analysis by Type and Year pf Partnership
- 6.3.4. Analysis by Area of Focus
- 6.3.5. Analysis by Type of Depressive Disorder
- 6.3.6. Regional Analysis
- 6.3.6.1. Local and International Agreements
- 6.3.6.2. Intercontinental and Intracontinental Agreements
- 6.3.7. Most Active Players: Analysis by Number of Partnerships
- 6.3.8. Big Pharma Players
7. FUNDING AND INVESTMENT ANALYSIS
- 7.1. Chapter Overview
- 7.2. Types of Funding
- 7.3. Depressive Disorders: Funding and Investment Analysis
- 7.3.1. Analysis by Number of Instances
- 7.3.2. Analysis by Amount Invested
- 7.3.3. High Value Deals: Analysis by Year
- 7.3.4. Analysis by Type of Funding
- 7.3.5. Analysis by Number of Funding Instances across Different Therapeutic Areas
- 7.3.6. Most Active Players
- 7.3.7. Most Active Investors
- 7.4. Concluding Remarks
8. CLINICAL TRIAL ANALYSIS
- 8.1. Chapter Overview
- 8.2. Scope and Methodology
- 8.3. Depressive Disorders: Clinical Trial Analysis
- 8.3.1. Analysis by Trial Registration Year
- 8.3.2. Analysis by Trial Phase
- 8.3.3. Analysis by Recruitment Status
- 8.3.4. Analysis by Type of Sponsor / Collaborator
- 8.3.5. Analysis by Type of Depressive Disorder
- 8.3.6. Analysis by Type of Drug Class
- 8.3.7. Most Active Players
- 8.3.8. Analysis by Number of Clinical Trials and Geography
- 8.3.9. Analysis by Number of Clinical Trials, Trial Phase and Recruitment Status
- 8.3.10. Analysis by Number of Clinical Trials, Type of Depressive Disorder and Geography
- 8.3.11. Analysis by Number of Clinical Trials, Type of Depressive Disorder, Trial Phase and Geography
- 8.3.12. Analysis by Number of Clinical Trials, Type of Drug Class and Geography
- 8.3.13. Analysis by Number of Clinical Trials, Type of Drug Class, Trial Phase and Geography
- 8.3.14. Analysis by Enrolled Patient Population and Geography
- 8.3.15. Analysis by Enrolled Patient Population, Trial Phase and Recruitment Status
- 8.3.16. Analysis by Enrolled Patient Population, Type of Depressive Disorder and Geography
- 8.3.17. Analysis by Enrolled Patient Population, Type of Depressive Disorder, Trial Phase and Geography
- 8.3.18. Analysis by Enrolled Patient Population, Type of Drug Class and Geography
- 8.3.19. Analysis by Enrolled Patient Population, Type of Drug Class, Trial Phase and Geography
- 8.4. Concluding Remarks
- 8.4.1. Emerging Molecules to Watch
- 8.4.2. Most Important Trials to Watch
9. CLINICAL TRIAL ENDPOINTS ANALYSIS
- 9.1. Chapter Overview
- 9.2. Scope and Methodology
- 9.3. Overview of the Most Common Primary Endpoints
- 9.4. Primary Endpoints Evaluated for Major Depressive Disorder: Comparative Analysis of Late-Stage Drugs
- 9.5. Primary Endpoints Evaluated for Bipolar Disorder: Comparative Analysis of Late-Stage Drugs
- 9.6. Primary Endpoints Evaluated for Other Types of Depressive Disorder: Comparative Analysis of Late-Stage Drugs
10. CLINICAL AND COMMERCIAL ATTRACTIVENESS ANALYSIS
- 10.1. Chapter Overview
- 10.2. Methodology
- 10.2.1. Assumptions and Key Parameters
- 10.3. Clinical and Commercial Attractiveness Analysis: Depressive Disorders
- 10.3.1. Clinical and Commercial Attractiveness Analysis: Major Depressive Disorder
- 10.3.2. Clinical and Commercial Attractiveness Analysis: Bipolar Disorder
- 10.3.3. Clinical and Commercial Attractiveness Analysis: Other Types of Depressive Disorder
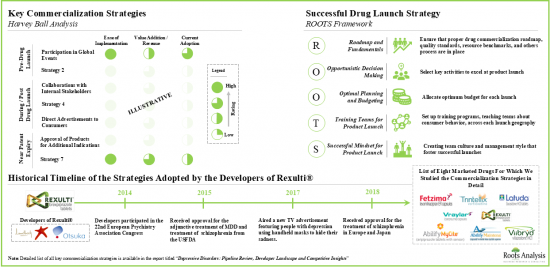
11. KEY COMMERCIALIZATION STRATEGIES
- 11.1. Chapter Overview
- 11.2. Successful Drug Launch Strategy: ROOTS Framework
- 11.3. Successful Drug Launch Strategy: Product Differentiation
- 11.4. Commercialization Strategies Adopted Based on Development Stage of Product
- 11.5. Approved Molecules for Treating Depressive Disorders
- 11.5.1. Abilify Mycite(R)
- 11.5.2. Abilify Maintena(R)
- 11.5.3. Rexulti(R)
- 11.5.4. Vraylar (R)
- 11.5.5. Trintellix(R)
- 11.5.6. Fetzima(R)
- 11.5.7. Latuda(R)
- 11.5.8. Viibryd(R)
- 11.6. Key Commercialization Strategies Adopted by Companies Focused on Depressive Disorders
- 11.6.1. Strategies Adopted Before the Approval of Drug
- 11.6.1.1. Participation in Global Events
- 11.6.2. Strategies Adopted During the Launch of Drug
- 11.6.2.1. Collaboration with Internal Stakeholders and Pharmaceutical Firms
- 11.6.2.2. Awareness through Product Websites
- 11.6.2.3. Direct to Consumer (DTC) Advertisements
- 11.6.3. Strategies Adopted Post Drug Launch / Near Patent Expiry of Drug
- 11.6.3.1. Approval of Drug in Multiple Geographies
- 11.6.3.2. Approval of Drug for Multiple Indications
- 11.6.1. Strategies Adopted Before the Approval of Drug
- 11.7. Concluding Remarks
12. DIGITAL THERAPEUTICS FOR DEPRESSIVE DISORDERS
- 12.1. Chapter Overview
- 12.2. An Overview of Digital Therapeutics
- 12.3. Development and Commercialization Pathway for Digital Therapeutics
- 12.3.1. Discovery and Preclinical Research
- 12.3.2. Clinical Trials and Validation
- 12.3.3. Engaging Insurance Providers / Payers
- 12.3.4. Distribution and Marketing
- 12.4. Digital Therapeutics for Depressive Disorders
- 12.4.1. Standalone Software Applications
- 12.4.2. Personal Coaching
- 12.4.3. AI Support
- 12.4.4. Gaming Solutions
- 12.5. Concluding Remarks
13. CONCLUDING REMARKS
- 13.1. Chapter Overview
- 13.2. Key Takeaways
14. APPENDIX 1: TABULATED DATA
15. APPENDIX 2: LIST OF COMPANIES AND ORGANIZATIONS
List of Tables
- Table 3.1 List of FDA Approved Antidepressants
- Table 4.1 Depressive Disorders: Marketed and Development Pipeline
- Table 4.2 Depressive Disorders: Information on Special Designations
- Table 4.3 Depressive Disorders: Information on Site of Drug Administration
- Table 4.4 Depressive Disorders: Information on Drug Type, Drug Class and Mechanism of Action
- Table 4.5 Depressive Disorders: Developer Overview
- Table 4.6 List of Neurostimulation Devices (Invasive) for Depression
- Table 4.7 List of Neurostimulation Devices (Non-Invasive) for Depression
- Table 5.1 Depressive Disorders: Pipeline of Discontinued Drugs
- Table 5.2 Depressive Disorders: List of Discontinued Clinical Trials
- Table 5.3 Depressive Disorders: List of Discontinued Drugs (Unvalidated)
- Table 6.1 Depressive Disorders: Partnerships and Collaborations
- Table 7.1 Depressive Disorders: Funding and Investments
- Table 7.2 Funding and Investment Analysis: Summary of Investments
- Table 8.1 Clinical Trial Analysis: Emerging Molecules to Watch
- Table 8.2 Clinical Trial Analysis: Most Important Trials to Watch
- Table 9.1 Clinical Trial Endpoint Analysis: List of Drugs
- Table 9.2 Clinical Endpoint Analysis: Key Primary Endpoints Evaluated for Major Depressive Disorder
- Table 9.3 Clinical Endpoint Analysis: Key Primary Endpoints Evaluated for Bipolar Disorder / Bipolar Depression
- Table 9.4 Clinical Trial Endpoint Analysis: Key Primary Endpoints Evaluated for Other Depressive Disorders
- Table 11.1 Drug Snapshot: Abilify Mycite(R)
- Table 11.2 Drug Snapshot: Abilify Maintena(R)
- Table 11.3 Drug Snapshot: Rexulti(R)
- Table 11.4 Drug Snapshot: Vraylar(R)
- Table 11.5 Drug Snapshot: Trintellix(R)
- Table 11.6 Drug Snapshot: Fetzima(R)
- Table 11.7 Drug Snapshot: Latuda(R)
- Table 11.8 Drug Snapshot: Viibryd(R)
- Table 11.9 Patient Support Services on Product Websites of Drugs for Depressive Disorders: Comparative Analysis
- Table 11.10 Key Commercialization Strategies: Harvey Ball Analysis by Ease of Implementation, Value Addition and Current Adoption
- Table 12.1 Digital Therapeutics for Depressive Disorders: List of Solutions
- Table 13.1 Depressive Disorders: Summary of Competitive Insights
- Table 14.1 Global Prevalence of Depression: Distribution by Gender and Age Groups
- Table 14.2 Depressive Disorders: Distribution by Phase of Development
- Table 14.3 Depressive Disorders: Distribution by Type of Depressive Disorder
- Table 14.4 Depressive Disorders: Distribution by Type of Depressive Disorder and Phase of Development
- Table 14.5 Depressive Disorders: Distribution by Type of Therapy
- Table 14.6 Depressive Disorders: Distribution by Type of Molecules
- Table 14.7 Depressive Disorders: Distribution by Route of Administration
- Table 14.8 Depressive Disorders: Distribution by Dosing Frequency
- Table 14.9 Depressive Disorders: Distribution by Type Drug and Drug Class
- Table 14.10 Major Depressive Disorder: Distribution by Phase of Development
- Table 14.11 Major Depressive Disorder: Distribution by Route of Administration
- Table 14.12 Major Depressive Disorder: Distribution by Dosing Frequency
- Table 14.13 Major Depressive Disorder: Key Players
- Table 14.14 Bipolar Disorder / Bipolar Depression: Distribution by Phase of Development
- Table 14.15 Bipolar Disorder / Bipolar Depression: Distribution by Route of Administration
- Table 14.16 Bipolar Disorder / Bipolar Depression: Distribution by Dosing Frequency
- Table 14.17 Bipolar Disorder / Bipolar Depression: Key Players
- Table 14.18 Treatment-Resistant Depression: Distribution by Phase of Development
- Table 14.19 Treatment-Resistant Depression: Distribution by Route of Administration
- Table 14.20 Treatment-Resistant Depression: Distribution by Dosing Frequency
- Table 14.21 Postpartum Depression and Depression (Type Unknown): Distribution by Phase of Development
- Table 14.22 Postpartum Depression and Depression (Type Unknown): Distribution by Route of Administration
- Table 14.23 Postpartum Depression and Depression (Type Unknown): Distribution by Dosing Frequency
- Table 14.24 Depressive Disorders: Distribution by Year of Establishment of Developer
- Table 14.25 Depressive Disorders: Distribution by Company Size (Employee Count)
- Table 14.26 Depressive Disorders: Distribution of Developers by Geographical Location (Continents)
- Table 14.27 Depressive Disorders: Distribution of Developers by Geographical Location (Countries)
- Table 14.28 Depressive Disorders: Distribution of Developers by Type of Depressive Disorder
- Table 14.29 Depressive Disorders: Key Players
- Table 14.30 Failure Analysis: Cumulative Distribution of Drugs by Year of Discontinuation
- Table 14.31 Failure Analysis: Distribution by Phase of Discontinuation
- Table 14.32 Failure Analysis: Distribution by Mechanism of Action
- Table 14.33 Failure Analysis: Distribution by Type of Depressive Disorder
- Table 14.34 Failure Analysis: Key Players
- Table 14.35 Failure Analysis: Distribution by Reason for Discontinuation
- Table 14.36 Failure Analysis: Relative Distribution by Reasons for Discontinuation and Phase of Development
- Table 14.37 Failure Analysis: Distribution of Discontinued Trials by Trial Phase and Average Time to Discontinuation
- Table 14.38 Failure Analysis: Distribution of Discontinued Trials by Type of Sponsor / Collaborator
- Table 14.39 Failure Analysis: Distribution of Discontinued Trials by Reason for Discontinuation
- Table 14.40 Partnerships and Collaborations: Cumulative Trend of Activity, by Year
- Table 14.41 Partnerships and Collaborations: Distribution by Type of Partnership
- Table 14.42 Partnerships and Collaborations: Distribution by Type and Year of Partnership
- Table 14.43 Partnerships and Collaborations: Distribution by Area of Focus
- Table 14.44 Partnerships and Collaborations: Distribution by Type of Depressive Disorder
- Table 14.45 Partnerships and Collaborations: Regional Distribution
- Table 14.46 Partnerships and Collaborations: Intercontinental and Intracontinental Distribution
- Table 14.47 Partnerships and Collaborations: Most Active Players
- Table 14.48 Funding and Investment Analysis: Cumulative Number of Instances by Year
- Table 14.49 Funding and Investment Analysis: Cumulative Amount Invested by Year (USD Million)
- Table 14.50 Funding and Investments: Average Amount Invested per Year (USD Million)
- Table 14.51 Funding and Investment Analysis: High Value Deals (USD Million)
- Table 14.52 Funding and Investment Analysis: Distribution of Instances by Type of Funding
- Table 14.53 Funding and Investment Analysis: Distribution of the Total Amount Invested by Type of Funding (USD Million)
- Table 14.54 Funding and Investment Analysis: Distribution of Number of Instances by Type of Funding
- Table 14.55 Funding and Investment Analysis: Distribution of Amount Invested by Type of Funding (USD Million)
- Table 14.56 Funding and Investment Analysis: Distribution of Funding Instances across Major Therapeutic Areas
- Table 14.57 Funding and Investment Analysis: Most Active Players
- Table 14.58 Clinical Trial Analysis: Cumulative Distribution of Clinical Trials by Start Year
- Table 14.59 Clinical Trial Analysis: Distribution of Clinical Trials by Study Start Year and Geography
- Table 14.60 Clinical Trial Analysis: Distribution of Patients Enrolled by Study Start Year
- Table 14.61 Clinical Trial Analysis: Distribution by Trial Phase and Patients Enrolled
- Table 14.62 Clinical Trial Analysis: Distribution by Trial Status
- Table 14.63 Clinical Trial Analysis: Distribution by Type of Sponsor / Collaborator
- Table 14.64 Clinical Trial Analysis: Distribution by Type of Depressive Disorder and Recruiting Status
- Table 14.65 Clinical Trial Analysis: Distribution by Type of Depressive Disorder and Trial Registration Year
List of Figures
- Figure 1.1 Depressive Disorders: Scope and Competitive Insights
- Figure 3.1 Depression: Key Facts
- Figure 3.2 Depression: Common Signs and Symptoms
- Figure 3.3 Prevalence of Depression in Major Geographical Regions
- Figure 3.4 Prevalence of Depression in Major Geographical Regions by Gender
- Figure 3.5 Global Prevalence of Depression: Distribution by Gender and Age Groups
- Figure 3.6 Prevalence of Various Types of Depression in the US
- Figure 3.7 Causes of Depression
- Figure 4.1 Depressive Disorders: Distribution by Phase of Development
- Figure 4.2 Depressive Disorders: Distribution by Type of Depressive Disorder
- Figure 4.3 Depressive Disorders: Distribution by Type of Depressive Disorder and Phase of Development
- Figure 4.4 Depressive Disorders: Distribution by Type of Therapy
- Figure 4.5 Depressive Disorders: Distribution by Type of Molecule
- Figure 4.6 Depressive Disorders: Distribution by Route of Administration
- Figure 4.7 Depressive Disorders: Distribution by Dosing Frequency
- Figure 4.8 Depressive Disorders: Distribution by Type of Drug and Drug Class
- Figure 4.9 Major Depressive Disorder: Distribution by Phase of Development
- Figure 4.10 Major Depressive Disorder: Distribution by Route of Administration
- Figure 4.11 Major Depressive Disorder: Distribution by Dosing Frequency
- Figure 4.12 Major Depressive Disorder: Key Players
- Figure 4.13 Bipolar Disorder / Bipolar Depression: Distribution by Phase of Development
- Figure 4.14 Bipolar Disorder / Bipolar Depression: Distribution by Route of Administration
- Figure 4.15 Bipolar Disorder / Bipolar Depression: Distribution by Dosing Frequency
- Figure 4.16 Bipolar Disorder / Bipolar Depression: Key Players
- Figure 4.17 Treatment-Resistant Depression: Distribution by Phase of Development
- Figure 4.18 Treatment-Resistant Depression: Distribution by Route of Administration
- Figure 4.19 Treatment-Resistant Depression: Distribution by Dosing Frequency
- Figure 4.20 Treatment-Resistant Depression: Key Players
- Figure 4.21 Postpartum Depression and Depression (Type Unknown): Distribution by Phase of Development
- Figure 4.22 Postpartum Depression and Depression (Type Unknown): Distribution by Route of Administration
- Figure 4.23 Postpartum Depression and Depression (Type Unknown): Distribution by Dosing Frequency
- Figure 4.24 Grid Analysis: Distribution of Pipeline Therapies by Phase of Development, Type of Depressive Disorder and Type of Drug
- Figure 4.25 Depressive Disorders: Distribution by Year of Establishment of Developer
- Figure 4.26 Depressive Disorders: Distribution by Size of Developer (Employee Count)
- Figure 4.27 Depressive Disorders: Distribution of Developers by Geographical Location (Continents)
- Figure 4.28 Depressive Disorders: Distribution of Developers by Geographical Location (Countries)
- Figure 4.29 Depressive Disorders: Distribution of Developers by Type of Depressive Disorder
- Figure 4.30 Depressive Disorders: Leading Players
- Figure 4.31 Grid Analysis: Distribution by Location of Developer, Company Size (Employee Count) and Type of Depressive Disorder
- Figure 5.1 Failure Analysis: Cumulative Distribution of Drugs by Year of Discontinuation
- Figure 5.2 Failure Analysis: Distribution by Phase of Discontinuation
- Figure 5.3 Failure Analysis: Distribution by Mechanism of Action
- Figure 5.4 Failure Analysis: Distribution by Type of Depressive Disorder
- Figure 5.5 Failure Analysis: Key Players
- Figure 5.6 Failure Analysis: Distribution by Reason of Discontinuation
- Figure 5.7 Failure Analysis: Relative Distribution by Reasons for Discontinuation and Phase of Development
- Figure 5.8 Failure Analysis: Year-wise Distribution of Discontinued Trials
- Figure 5.9 Failure Analysis: Distribution of Discontinued Trials by Trial Phase and Average Time to Discontinuation
- Figure 5.10 Failure Analysis: Distribution of Discontinued Trials by Type of Sponsor / Collaborator
- Figure 5.11 Failure Analysis: Distribution of Discontinued Trials by Geography
- Figure 5.12 Failure Analysis: Distribution of Discontinued Trials by Year of Discontinuation and Geography
- Figure 5.13 Failure Analysis: Distribution of Discontinued Trials by Reason of Discontinuation
- Figure 5.14 Bubble Analysis: Distribution of Discontinued Trials by Year of Discontinuation, Reason of Discontinuation and Phase of Development
- Figure 6.1 Partnerships and Collaborations: Cumulative Trend of Activity, by Year
- Figure 6.2 Partnerships and Collaborations: Distribution by Type of Partnership
- Figure 6.3 Partnerships and Collaborations: Distribution by Type and Year of Partnership
- Figure 6.4 Partnerships and Collaborations: Distribution by Area of Focus
- Figure 6.5 Partnerships and Collaborations: Distribution by Type of Depressive Disorder
- Figure 6.6 Partnerships and Collaborations: Regional Distribution
- Figure 6.7 Partnerships and Collaborations: Intercontinental and Intracontinental Distribution
- Figure 6.8 Partnerships and Collaborations: Most Active Players
- Figure 6.9 Partnerships and Collaborations: Activity of Big Pharmaceutical Companies
- Figure 7.1 Funding and Investment Analysis: Distribution by Type of Funding and Year of Establishment of Developer
- Figure 7.2 Funding and Investment Analysis: Cumulative Number of Instances by Year
- Figure 7.3 Funding and Investment Analysis: Cumulative Amount Invested by Year (USD Million)
- Figure 7.4 Funding and Investment Analysis: Average Amount Invested per Year (USD Million)
- Figure 7.5 Funding and Investment Analysis: High Value Deals (USD Million)
- Figure 7.6 Funding and Investment Analysis: Distribution of Instances by Type of Funding
- Figure 7.7 Funding and Investment Analysis: Distribution of the Total Amount Invested by Type of Funding (USD Million)
- Figure 7.8 Funding and Investment Analysis: Distribution of Number of Instances by Type of Funding
- Figure 7.9 Funding and Investment Analysis: Distribution of Amount Invested by Type of Funding (USD Million)
- Figure 7.10 Funding and Investment Analysis: Distribution of Funding Instances across Major Therapeutic Areas
- Figure 7.11 Funding and Investment Analysis: Most Active Players
- Figure 7.12 Funding and Investment Analysis: Key Investors
- Figure 7.11 Funding and Investment Summary (USD Million)
- Figure 8.1 Clinical Trial Analysis: Cumulative Distribution of Clinical Trials by Start Year
- Figure 8.2 Clinical Trial Analysis: Distribution of Clinical Trials by Study Start Year and Geography
- Figure 8.3 Clinical Trial Analysis: Distribution of Patients Enrolled by Study Start Year
- Figure 8.4 Clinical Trial Analysis: Distribution by Trial Phase and Patients Enrolled
- Figure 8.5 Clinical Trial Analysis: Distribution by Trial Status
- Figure 8.6 Clinical Trial Analysis: Distribution by Type of Sponsor / Collaborator
- Figure 8.7 Clinical Trial Analysis: Distribution by Type of Depressive Disorder and Recruitment Status
- Figure 8.8 Clinical Trial Analysis: Distribution by Type of Depressive Disorder and Trial Registration Year
- Figure 8.9 Clinical Trial Analysis: Distribution by Type of Drug Class
- Figure 8.10 Clinical Trials Analysis: Most Active Industry and Non-Industry Players in Terms of Number of Trials Conducted
- Figure 8.11 Clinical Trial Analysis: Distribution of Clinical Trials by Geography
- Figure 8.12 Clinical Trial Analysis: Distribution of Clinical Trials by Trial Phase, Recruitment Status and Geography
- Figure 8.13 Clinical Trial Analysis: Distribution of Clinical Trials by Type of Depressive Disorder and Geography
- Figure 8.14 Clinical Trial Analysis: Distribution of Clinical Trials by Trial Phase, Type of Depressive Disorder and Geography
- Figure 8.15 Clinical Trial Analysis: Distribution of Clinical Trials by Type of Drug Class and Geography
- Figure 8.16 Clinical Trial Analysis: Distribution of Clinical Trials by Trial Phase, Mechanism of Action and Geography
- Figure 8.17 Clinical Trial Analysis: Distribution of Enrolled Patient Population by Geography
- Figure 8.18 Clinical Trial Analysis: Distribution of Enrolled Patient Population by Trial Phase, Recruitment Status and Geography
- Figure 8.19 Clinical Trial Analysis: Distribution of Enrolled Patient Population by Type of Depressive Disorder and Geography
- Figure 8.20 Clinical Trial Analysis: Distribution of Enrolled Patient Population by Trial Phase, Type of Depressive Disorder and Geography
- Figure 8.21 Clinical Trial Analysis: Distribution of Enrolled Patient Population by Type of Drug Class and Geography
- Figure 8.22 Clinical Trial Analysis: Distribution of Enrolled Patient Population by Trial Phase, Mechanism of Action and Geography
- Figure 10.1 Clinical Commercial Attractiveness Analysis: Late-Stage Molecules Under Investigation for Treating Depressive Disorders
- Figure 10.2 Clinical and Commercial Attractiveness Analysis: Late-Stage Molecules Under Investigation for Treating Major Depressive Disorder
- Figure 10.3 Clinical and Commercial Attractiveness Analysis: Late-Stage Molecules Under Investigation for Treating Bipolar Disorder / Bipolar Depression
- Figure 10.4 Clinical and Commercial Attractiveness Analysis: Late-Stage Molecules Under Investigation for Treating Other Depressive Disorders
- Figure 11.1 Successful Drug Launch Strategy: ROOTS Framework
- Figure 11.2 Successful Drug Launch Strategy: Product Differentiation
- Figure 11.3 Common Commercialization Strategies Adopted Based on Development Stage of Product
- Figure 11.4 Harvey Ball Analysis: Commercialization Strategies Adopted by Companies Focused on Depressive Disorders
- Figure 11.5 Participation in Global Events: Historical Timeline
- Figure 11.6 Approved Drugs for Depressive Disorders: Promotional Activities through Product Websites
- Figure 11.7 Approval of Drugs in Multiple Geographies: Historical Timeline
- Figure 11.8 Approval of Drugs for Multiple Indications: Historical Timeline
- Figure 12.1 Prescription Digital Therapeutics: Process Map
- Figure 12.2 Digital Therapeutics: Google Trends

