
PUBLISHER: Roots Analysis | PRODUCT CODE: 1762537

PUBLISHER: Roots Analysis | PRODUCT CODE: 1762537
China Biologics Contract Manufacturing Market: Industry Trends and Global Forecasts - Distribution by Type of Product, Expression System Used, Scale of Operation, Company Size and Type of Biologic
CHINA BIOLOGICS CONTRACT MANUFACTURING MARKET: OVERVIEW
As per Roots Analysis, the global China biologics contract manufacturing market valued at USD 0.8 billion in the current year is anticipated to grow at a CAGR of 13% during the forecast period.
The market sizing and opportunity analysis has been segmented across the following parameters:
Type of Product
- APIs
- FDFs
Expression System Used
- Mammalian Systems
- Microbial Systems
- Other Expression Systems
Scale of Operation
- Preclinical / Clinical Scale Operations
- Commercial Operations
Company Size
- Small Companies
- Mid-sized Companies
- Large / Very Large Companies
Type of Biologic
- Antibodies
- Vaccines
- Other Biologics
CHINA BIOLOGICS CONTRACT MANUFACTURING MARKET: GROWTH AND TRENDS
Biologics represent one of the fastest growing segments of the pharmaceutical industry. This can
be attributed to the rapid pace of innovation in this field, driven by the need for effective and personalized pharmacological interventions. Notably, China which was the epicenter of the COVID-19 pandemic, is the world's second largest pharmaceutical market and accounts for nearly 20% of the global output of APIs. Further, with over 25 biologics and biosimilar products approved till date and close to 1,000 clinical trials being conducted to investigate a variety of biologics and biosimilars, the biologics contract manufacturing market in China is growing at a healthy pace. Apart from this, several benefits, such as lower manufacturing costs, enhanced reimbursement policies, availability of cheap and skilled labor and a supportive regulatory landscape, has facilitated China in becoming an attractive choice for various stakeholders engaged in the biologics contract manufacturing market.
It is worth noting that most of the contract service providers engaged in this domain have profound experience in niche and emerging areas. In addition, the innate expertise and availability of required capabilities, as well as infrastructure, enables such service providers to effectively fulfil the requirements of their clients, while eliminating costly oversights and reducing chances of product failure.
CHINA BIOLOGICS CONTRACT MANUFACTURING MARKET: KEY INSIGHTS
The report delves into the current state of the China biologics contract manufacturing market and identifies potential growth opportunities within industry. Some key findings from the report include:
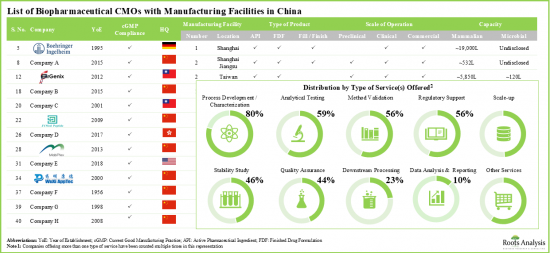
- Over 35 CMOs / CDMOs in China claim to offer a variety of services related to development and manufacturing of a wide range of biotherapeutic products.
- Several players provide one-stop solutions and are capable of operating at various scales; the landscape includes a mix of both established players and new entrants.
- At present, only a handful of firms claim to have capabilities for the manufacturing of novel biologics.
- In order to tap the increasing opportunity for biologics in Asia-Pacific, China has emerged a preferred choice for CMOs.
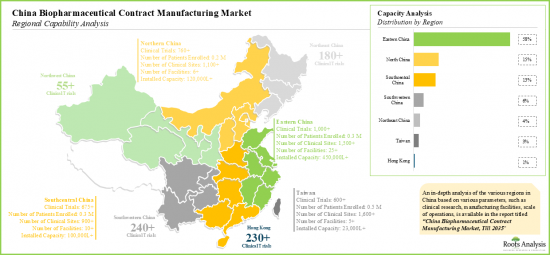
- To cater to the evolving needs of clients / sponsors, CMOs have established facilities across different regions of China; Eastern China, with the maximum number of sites, has emerged as a manufacturing hub.
- With over 80 deals inked in past five years, there has been a surge in the partnership activity within this domain; majority of these collaborations were signed for the development and manufacturing of antibody-based products.
- The number of partnerships signed within this domain has increased at a CAGR of 21% in the past few years.
- More than 60% of the reported deals were inked in relation to clinical stage molecules.
- Big pharma players have also made significant investments in this region, including establishing new facilities, expanding existing R&D centers and growing manufacturing facilities, focused on biotherapeutics.
- Pfizer invested USD 350 million to establish a new state-of-art global biotechnology center in Hangzhou, China for the production of high quality biosimilars to meet both local and international demand.
- Merck partnered with GenScript to establish a plasmid and viral vector manufacturing platform in order to expediate development and commercialization of cell and gene therapies in Chinese and global market.
- We expect global biopharmaceutical developers to continue to outsource their manufacturing operations to China in the long term; the CMO industry in the region is likely to grow at an annualized rate of ~13%, till 2030.
Example Players in the China Biologics Contract Manufacturing Market
- ChemPartner Biologics
- JHL Biotech
- JOINN Biologics
- MabPlex
- Mycenax Biotech
- WuXi AppTec
CHINA BIOLOGICS CONTRACT MANUFACTURING MARKET: RESEARCH COVERAGE
- Market Sizing and Opportunity Analysis: The report features an in-depth analysis of the China biologics contract manufacturing market, focusing on key market segments, including [A] type of product, [B] expression system used, [C] scale of operation, [D] company size and [E] type of biologic.
- Market Landscape: A comprehensive evaluation of companies offering contract manufacturing services for biopharmaceuticals in China, based on several relevant parameters, such as [A] year of establishment, [B] company size, [C] scale of operation, [D] location of headquarters, [E] number of manufacturing facilities, [F] location of facilities, [G] type of business segment, [H] type of manufacturing service(s) offered, [I] type of biologic(s) manufactured, [J] type of expression system(s) used, [K] type of bioreactor(s) used, [L] mode of operation, [M] type of packaging and [N] affiliations to regulatory accreditations and certifications.
- Partnerships and Collaborations: An insightful analysis of the deals inked by stakeholders in the biopharmaceutical manufacturing market in China, based on several parameters, such as [A] year of partnership, [B] type of partnership, [C] scale of operation, [D] type of biologic, [E] focus area of the deal, [F] target indication, [G] most active players (in terms of number of partnerships signed) and [H] geography.
- Recent Expansions: A comprehensive evaluation of expansion initiatives undertaken by contract manufacturers in China, based on several relevant parameters, such as [A] year of expansion, [B] type of expansion, [C] scale of operation of manufacturing facility, [D] type of biologic and [E] location of manufacturing facility.
- Clinical Trial Analysis: An insightful analysis of clinical trials related to biopharmaceuticals conducted in China, based on several parameters, such as [A] trial registration year, [B] trial phase, [C] trial recruitment status, [D] type of sponsor / collaborator, [E] geography and [F] number of patients enrolled.
- Capacity Analysis: A detailed analysis of installed capacity for manufacturing biopharmaceuticals in China, based on several parameters, such as [A] company size, [B] scale of operation, [C] key geographical regions and [D] expression system used.
- Big Pharma Initiatives: A comprehensive analysis of the recent initiatives undertaken by big pharma players in China for the manufacturing of biopharmaceuticals, based on various relevant parameters, such as [A] number of initiatives, [B] year of initiative and [C] benchmark analysis of big pharma players.
- Make Versus Buy Decision Making Framework: A detailed qualitative analysis, focusing on the various factors that need to be considered by drug / therapy developers while deciding whether to manufacture their respective products in-house or engage the services of a CMO.
- Company Profiles: In-depth profiles of the companies that have a diverse range of capabilities for the development, manufacturing and packaging of biopharmaceutical products, focusing on [A] overview of the company, [B] financial information (if available), [C] service portfolio, [D] details related to manufacturing capabilities and facilities and [E] recent developments and an informed future outlook.
- Case Study: A detailed comparison of the important characteristics of large and small molecule drugs, along with details on the various steps involved in their respective manufacturing processes.
- SWOT Analysis: An analysis of industry affiliated trends, opportunities and challenges, which are likely to impact the evolution of China biologics contract manufacturing market; it includes a Harvey ball analysis, assessing the relative impact of each SWOT parameter on industry dynamics.
KEY QUESTIONS ANSWERED IN THIS REPORT
- How many companies are currently engaged in this market?
- Which are the leading companies in this market?
- What factors are likely to influence the evolution of this market?
- What is the current and future market size?
- What is the CAGR of this market?
- How is the current and future market opportunity likely to be distributed across key market segments?
REASONS TO BUY THIS REPORT
- The report provides a comprehensive market analysis, offering detailed revenue projections of the overall market and its specific sub-segments. This information is valuable to both established market leaders and emerging entrants.
- Stakeholders can leverage the report to gain a deeper understanding of the competitive dynamics within the market. By analyzing the competitive landscape, businesses can make informed decisions to optimize their market positioning and develop effective go-to-market strategies.
- The report offers stakeholders a comprehensive overview of the market, including key drivers, barriers, opportunities, and challenges. This information empowers stakeholders to stay abreast of market trends and make data-driven decisions to capitalize on growth prospects.
ADDITIONAL BENEFITS
- Complimentary PPT Insights Packs
- Complimentary Excel Data Packs for all Analytical Modules in the Report
- 15% Free Content Customization
- Detailed Report Walkthrough Session with Research Team
- Free Updated report if the report is 6-12 months old or older
TABLE OF CONTENTS
1. PREFACE
- 1.1. Scope of the Report
- 1.2. Research Methodology
- 1.2.1. Research Assumptions
- 1.2.2. Project Methodology
- 1.2.3. Forecast Methodology
- 1.2.4. Robust Quality Control
- 1.2.5. Key Considerations
- 1.2.5.1. Demographics
- 1.2.5.2. Economic Factors
- 1.2.5.3. Government Regulations
- 1.2.5.4. Supply Chain
- 1.2.5.5. COVID Impact / Related Factors
- 1.2.5.6. Market Access
- 1.2.5.7. Healthcare Policies
- 1.2.5.8. Industry Consolidation
- 1.3 Key Questions Answered
- 1.4. Chapter Outlines
2. EXECUTIVE SUMMARY
3. INTRODUCTION
- 3.1. Chapter Overview
- 3.2. Overview of Biopharmaceuticals
- 3.3. Manufacturing Biopharmaceuticals
- 3.3.1. Types of Expression Systems Used
- 3.3.1.1. Bacterial Expression Systems
- 3.3.1.2. Yeast Expression Systems
- 3.3.1.3. Insect Expression Systems
- 3.3.1.4. Plant Expression Systems
- 3.3.1.5. Mammalian Expression Systems
- 3.3.1.6. Fungal Expression Systems
- 3.3.2. Processing Steps
- 3.3.2.1. Upstream Processing
- 3.3.2.2. Downstream Processing
- 3.3.1. Types of Expression Systems Used
- 3.4. Overview of Contract Manufacturing
- 3.4.1. Contract Manufacturing Scenario in China
- 3.5. Need for Outsourcing in the Biopharmaceutical Industry
- 3.5.1. Biopharmaceutical Outsourcing in China: Regulatory Scenario
- 3.6. Commonly Outsourced Operations in the Biopharmaceutical Industry
- 3.7. Basic Guidelines for Selecting a CMO Partner
- 3.8. Advantages of Outsourcing Manufacturing Services
- 3.8.1. Benefits of Engaging Chinese Contract Service Providers
- 3.9. Risks and Challenges Associated with Biopharmaceutical Contract Manufacturing
- 3.9.1. Challenges Associated with Engaging Chinese Contract Service Providers
- 3.10. Future Perspective
4. CASE STUDY: COMPARISON OF SMALL MOLECULES AND LARGE MOLECULES
- 4.1. Chapter Overview
- 4.2. Small Molecule and Large Molecule Drugs / Therapies
- 4.2.1. Comparison of Key Characteristics
- 4.2.2. Comparison of Manufacturing Processes
- 4.2.3. Comparison of Key Manufacturing-Related Challenges
5. COMPETITIVE LANDSCAPE
- 5.1. Chapter Overview
- 5.2. Chinese Biopharmaceutical Contract Manufacturers: Overall Market Landscape
- 5.2.1. Analysis by Year of Establishment
- 5.2.2. Analysis by Company Size
- 5.2.3. Analysis by Scale of Operation
- 5.2.4. Analysis by Location of Headquarters
- 5.2.5. Analysis by Location of Manufacturing Facilities
- 5.2.6. Analysis by Type of Product
- 5.2.7. Analysis by Types of Services Offered
- 5.2.8. Analysis by Type of Biologic
- 5.2.9. Analysis by Expression System Used
- 5.2.10. Analysis by Type of Bioreactor Used
- 5.2.11. Analysis by Mode of Operation of Bioreactor
- 5.2.12. Analysis by Packaging Form Used
- 5.2.13. Analysis by Regulatory Accreditations / Certifications
6. COMPANY PROFILES
- 6.1. Chapter Overview
- 6.2. ChemPartner Biologics
- 6.2.1. Company Overview
- 6.2.2. Service Portfolio
- 6.2.2.1. Cell Line Development
- 6.2.2.2. Process Development
- 6.2.2.3. Formulation Development
- 6.2.2.4. Aseptic Filling and Freeze Drying
- 6.2.2.5. Drug Developability and Manuafcturing Study
- 6.2.2.6. Container Extractables and Leachables Study
- 6.2.2.7. Analytical Development and Testing
- 6.2.3. Manufacturing Facilities and Capabilities
- 6.2.4. Recent Developments and Future Outlook
- 6.3. JHL Biotech
- 6.3.1. Company Overview
- 6.3.2. Service Portfolio
- 6.3.2.1. Cell Line and Process Development
- 6.3.2.2. Analytical and Formulation Development
- 6.3.2.3. cGMP Manufacturing
- 6.3.2.4. Quality Systems
- 6.3.2.5. Regulatory Support
- 6.3.2.6. Project Management Services
- 6.3.3. Manufacturing Facilities and Capabilities
- 6.3.4. Recent Developments and Future Outlook
- 6.4. JOINN Biologics
- 6.4.1. Company Overview
- 6.4.2. Service Portfolio
- 6.4.2.1. Development Services
- 6.4.2.2. Manufacturing Services
- 6.4.2.3. Fill / Finish Services
- 6.4.2.4. Quality Assurance and Quality Control
- 6.4.3. Manufacturing Facilities and Capabilities
- 6.4.4. Recent Developments and Future Outlook
- 6.5 MabPlex
- 6.5.1. Company Overview
- 6.5.2. Service Portfolio
- 6.5.2.1. Development Services
- 6.5.2.2. GMP Manufacturing Services
- 6.5.3. Manufacturing Facilities and Capabilities
- 6.5.4. Recent Developments and Future Outlook
- 6.6. Mycenax Biotech
- 6.6.1. Company Overview
- 6.6.2. Service Portfolio
- 6.6.2.1. Cell Development Services
- 6.6.2.2. Process Development Services
- 6.6.2.3. Analytical and Quality Control
- 6.6.2.4. GMP Manuafacturing Services
- 6.6.3. Manufacturing Facilities and Capabilities
- 6.6.4. Recent Developments and Future Outlook
- 6.7. WuXi AppTec
- 6.7.1. Company Overview
- 6.7.2. Financial Information
- 6.7.3. Service Portfolio
- 6.7.3.1. Discovery Sciences
- 6.7.3.2. Development Services
- 6.7.3.3. Testing Services
- 6.7.3.4. Clinical Manufacturing Services
- 6.7.3.5. Commercial Manufacturing Services
- 6.7.3.6. Fill / Finish Operations
- 6.7.4. Manufacturing Facilities and Capabilities
- 6.7.5. Recent Developments and Future Outlook
7. PARTNERSHIPS
- 7.1. Chapter Overview
- 7.2. Partnership Models
- 7.3. Chinese Biopharmaceutical Contract Manufacturers: Recent Partnerships
- 7.3.1. Analysis by Year of Partnership
- 7.3.2. Analysis by Type of Partnership
- 7.3.3. Analysis by Scale of Operation
- 7.3.4. Analysis by Type of Biologic
- 7.3.5. Analysis by Focus Area
- 7.3.6. Analysis by Therapeutic Area
- 7.3.7. Most Active Players: Analysis by Number of Partnerships
- 7.3.8. Geographical Analysis
- 7.3.8.1. Geographical Distribution by Number of Partnerships
- 7.3.8.2. Intercontinental and Intracontinental Agreements
8. RECENT EXPANSIONS
- 8.1. Chapter Overview
- 8.2. Chinese Biopharmaceutical Contract Manufacturers: Recent Expansions
- 8.2.1. Analysis by Year of Expansion
- 8.2.2. Analysis by Type of Expansion
- 8.2.3. Analysis by Scale of Operation
- 8.2.4. Analysis by Type of Biologic
- 8.2.5. Analysis by Location of Expansion Project
- 8.2.6. Analysis by Capacity of Expanded Facility
- 8.2.7. Most Active Players: Analysis by Number of Expansions
- 8.2.8. Analysis by Region
9. CLINICAL TRIAL ANALYSIS
- 9.1. Chapter Overview
- 9.2. Scope and Methodology
- 9.3. Clinical Trial Analysis: Biologic Drugs
- 9.3.1. Analysis by Trial Registration Year
- 9.3.2. Analysis by Trial Phase
- 9.3.3. Analysis by Trial Status
- 9.3.4. Geographical Analysis by Number of Clinical Trials
- 9.3.5. Geographical Analysis by Enrolled Patient Population
- 9.3.6. Analysis of Enrolled Patient Population by Trial Registration Year
- 9.3.7. Analysis of Enrolled Patient Population by Trial Phase
- 9.3.8. Analysi by Type of Sponsor / Collaborator
- 9.3.9. Most Active Players: Analysis by Number of Registered Trials
- 9.3.10. Analysis by Clinical Trial Center
10. REGIONAL CAPABILITY ANALYSIS
- 10.1. Chapter Overview
- 10.2. Assumptions and Key Parameters
- 10.3. Overall Landscape of Chinese Biopharmaceuticals Contract Manufacturers
- 10.4. Regional Capability Analysis: Biopharmaceuticals Contract Manufacturers in Northern China
- 10.5. Regional Capability Analysis: Biopharmaceuticals Contract Manufacturers in Eastern China
- 10.6. Regional Capability Analysis: Biopharmaceuticals Contract Manufacturers in Central China
- 10.7. Regional Capability Analysis: Biopharmaceuticals Contract Manufacturers in Southern China
11. CAPACITY ANALYSIS
- 11.1. Chapter Overview
- 11.2. Assumptions and Methodology
- 11.3. Chinese Biopharmaceutical Contract Manufactures: Installed Capacity
- 11.3.1. Analysis by Company Size
- 11.3.2. Analysis by Scale of Operation
- 11.3.3. Analysis by Expression System Used
- 11.3.4. Analysis by Location of Manufacturing Facility
- 11.3.5. Analysis by Company Size and Location of Manufacturing Facility
- 11.3.6. Analysis by Scale of Operation and Location of Manufacturing Facility
- 11.4. Concluding Remarks
12. BIG PHARMA BIOPHARMACEUTICAL MANUFACTURING INITIATIVES IN CHINA
- 12.1. Chapter Overview
- 12.2. List of Biopharmaceutical R&D and Manufacturing Initiatives of Big Pharma Players in China
- 12.2.1. Analysis by Number of Initiatives
- 12.2.2. Analysis by Year of Initiative
- 12.2.3. Analysis by Company and Year of Initiative
- 12.2.4. Analysis by Type of Initiative
- 12.2.5. Analysis by Type of Biologic
- 12.3. Competitive Benchmarking of Big Pharmaceutical Players
- 12.3.1. Harvey Ball Analysis: Big Pharma Investment Summary
- 12.3.2. Geographical Analysis by Investment Made
13. MAKE VERSUS BUY DECISION MAKING FRAMEWORK
- 13.1. Chapter Overview
- 13.2. Assumptions and Key Parameters
- 13.3. Chinese Biopharmaceutical Contract Manufacturers: Make versus Buy Decision Making
- 13.3.1. Scenario 1
- 13.3.2. Scenario 2
- 13.3.3. Scenario 3
- 13.3.4. Scenario 4
- 13.4. Conclusion
14. MARKET SIZING AND OPPORTUNITY ANALYSIS
- 14.1. Chapter Overview
- 14.2. Key Assumptions and Forecast Methodology
- 14.3. Biopharmaceutical Contract Manufacturing Market in China, Till 2035
- 14.3.1. Biopharmaceutical Contract Manufacturing Market in China for APIs, Till 2035
- 14.3.2. Biopharmaceutical Contract Manufacturing Market in China for FDFs, Till 2035
- 14.4. Biopharmaceutical Contract Manufacturing Market in China, Till 2035: Distribution by Expression System Used
- 14.4.1. Biopharmaceutical Contract Manufacturing Market in China, Till 2035: Share of Mammalian Systems
- 14.4.2. Biopharmaceutical Contract Manufacturing Market in China, Till 2035: Share of Microbial Systems
- 14.4.3. Biopharmaceutical Contract Manufacturing Market in China, Till 2035: Share of Other Expression Systems
- 14.5. Biopharmaceutical Contract Manufacturing Market in China, Till 2035: Distribution by Scale of Operation
- 14.5.1. Biopharmaceutical Contract Manufacturing Market in China, Till 2035: Share of Preclinical / Clinical Scale Operations
- 14.5.2. Biopharmaceutical Contract Manufacturing Market in China, Till 2035: Share of Commercial Operations
- 14.6. Biopharmaceutical Contract Manufacturing Market in China, Till 2035: Distribution by Company Size
- 14.6.1. Biopharmaceutical Contract Manufacturing Market in China, Till 2035: Share of Small Companies
- 14.6.2. Biopharmaceutical Contract Manufacturing Market in China, Till 2035: Share of Mid-sized Companies
- 14.6.3. Biopharmaceutical Contract Manufacturing Market in China, Till 2035: Share of Large and Very Large Companies
- 14.7. Biopharmaceutical Contract Manufacturing Market in China, Till 2035: Distribution by Type of Biologic
- 14.7.1. Biopharmaceutical Contract Manufacturing Market in China, Till 2035: Share of Antibodies
- 14.7.2. Biopharmaceutical Contract Manufacturing Market in China, Till 2035: Share of Vaccines
- 14.7.3. Biopharmaceutical Contract Manufacturing Market in China, Till 2035: Share of Other Biologics
15 COVID-19 Impact on China Biopharmaceutical CMO Market
- 15.1. Chapter Overview
- 15.2. Current Opinions and Recuperative Initiatives of Key Players
- 15.2.1. WuXi AppTec
- 15.2.2. Boehringer Ingelheim
- 15.2.3. GE Healthcare
- 15.2.4. Lonza
- 15.2.5. AmbioPharm
- 15.2.6. Impact on China Biopharmaceutical Contract Manufacturing Market
16. SWOT ANALYSIS
- 16.1. Chapter Overview
- 16.2. Strengths
- 16.3. Weaknesses
- 16.4. Opportunities
- 16.5. Threats
- 16.6. Comparison of SWOT Factors
- 16.7. Concluding Remarks
17. FUTURE OF THE CHINA BIOPHARMACEUTICAL CMO MARKET
- 17.1. Chapter Overview
- 17.2. Outsourcing Activities Anticipated to Increase in Future
- 17.3. Shift from One-time Contracts to Strategic Partnerships
- 17.4. Adoption of Innovative Technologies
- 17.4.1. Single Use Bioreactors
- 17.4.2. Novel Bioprocessing Techniques
- 17.4.3. Bioprocess Automation
- 17.5. Growing Popularity of the Quality by Design Principle in Bioprocessing
- 17.6. Increasing Focus on Niche Therapeutic Areas
- 17.7. Biosimilars Market to Contribute to Contract Service Revenues
- 17.8. Capability and Facility Expansions to Establish One Stop Shop Expertise
- 17.9. Increase in Financial In-flow and Outsourcing Budgets
- 17.10. Challenges Faced by Sponsors and Service Providers
- 17.10.1. Concerns Associated with Single Use Systems
- 17.10.2. Issues Related to Capacity Fluctuations
- 17.11. Concluding Remarks
18. INTERVIEW TRANSCRIPTS
19. APPENDIX 1: TABULATED DATA
20. APPENDIX 2: LIST OF COMPANIES AND ORGANISTIONS
List of Tables
- Table 4.1. Small Molecules and Large Molecules: Comparison of Development Characteristics
- Table 5.1. List of Chinese Biopharmaceutical Contract Manufacturers
- Table 5.2. Chinese Biopharmaceutical Contract Manufacturers: Information on Scale of Operation
- Table 5.3. Chinese Biopharmaceutical Contract Manufacturers: Information on Type of Product
- Table 5.4. Chinese Biopharmaceutical Contract Manufacturers: Information on Type of Services Offered
- Table 5.5. Chinese Biopharmaceutical Contract Manufacturers: Information on Type of Biologic
- Table 5.6. Chinese Biopharmaceutical Contract Manufacturers: Information on Type of Expression System Used
- Table 5.7. Chinese Biopharmaceutical Contract Manufacturers: Information on Type of Bioreactor Used
- Table 5.8. Chinese Biopharmaceutical Contract Manufacturers: Information on Mode of Operation of Bioreactor
- Table 5.9. Chinese Biopharmaceutical Contract Manufacturers: Information on Type of Packaging Form Used
- Table 5.10. Chinese Biopharmaceutical Contract Manufacturers: Information on Regulatory Accreditations
- Table 6.1. ChemPartner Biologics: Company Overview
- Table 6.2. ChemPartner Biologics: Overview of Manufacturing Capabilities
- Table 6.3. ChemPartner Biologics: Recent Developments and Future Outlook
- Table 6.4. JHL Biotech: Company Overview
- Table 6.5. JHL Biotech: Overview of Manufacturing Capabilities
- Table 6.6. JHL Biotech: Recent Developments and Future Outlook
- Table 6.7. JOINN Biologics: Company Overview
- Table 6.8. JOINN Biologics: Overview of Manufacturing Capabilities
- Table 6.9. MabPlex: Company Overview
- Table 6.10. MabPlex: Overview of Manufacturing Capabilities
- Table 6.11. MabPlex: Recent Developments and Future Outlook
- Table 6.12. Mycenax Biotech: Company Overview
- Table 6.13. Mycenax Biotech: Overview of Manufacturing Capabilities
- Table 6.14. Mycenax Biotech: Recent developments and Future Outlook
- Table 6.15. WuXi AppTec: Company Overview
- Table 6.16. WuXi Biologics: Overview of Manufacturing Capabilities
- Table 6.17. WuXi Biologics: Recent Developments and Future Outlook
- Table 7.1. Chinese Biopharmaceutical Contract Manufacturers: List of Partnerships, Since 2016
- Table 8.1. Chinese Biopharmaceutical Contract Manufacturers: List of Expansions, Since 2016
- Table 10.1. Chinese Biopharmaceutical Contract Manufacturers: Regional Distribution by Type of Product
- Table 11.1 China Biopharmaceutical Contract Manufacturers: Installed Capacity
- Table 11.2. Capacity Analysis: Average Capacity based on Company Size (Sample Dataset)
- Table 11.3. Capacity Analysis: Total Installed Capacity in China
- Table 18.1. Chinese Biopharmaceutical Contract Manufacturers: Distribution by Year of Establishment
- Table 18.2. Chinese Biopharmaceutical Contract Manufacturers: Distribution by Company Size
- Table 18.3. Chinese Biopharmaceutical Contract Manufacturers: Distribution by Scale of Operation
- Table 18.4. Chinese Biopharmaceutical Contract Manufacturers: Distribution by Location of Headquarters
- Table 18.5. Chinese Biopharmaceutical Contract Manufacturers: Distribution by Location of Headquarters (Within China)
- Table 18.6. Chinese Biopharmaceutical Contract Manufacturers: Distribution by Location of Manufacturing Facilities (Country-Wise)
- Table 18.7. Chinse Biopharmaceutical Contract Manufacturers: Distribution by Type of Product
- Table 18.8. Chinese Biopharmaceutical Contract Manufacturers: Distribution by Type of Services Offered
- Table 18.9. Chinese Biopharmaceutical Contract Manufacturers: Distribution by Type of Biologic
- Table 18.10. Chinese Biopharmaceutical Contract Manufacturers: Distribution by Type of Expression System Used
- Table 18.11. Chinese Biopharmaceutical Contract Manufacturers: Distribution by Type of Bioreactor Used
- Table 18.12. Chinese Biopharmaceutical Contract Manufacturers: Distribution by Mode of Operation of Bioreactor
- Table 18.13. Chinese Biopharmaceutical Contract Manufacturers: Distribution by Type of Packaging Form Used
- Table 18.14. Chinese Biopharmaceutical Contract Manufacturers: Distribution by Regulatory Accreditations / Certifications
- Table 18.15. WuXi Biologics: Annual Revenues, Since FY 2016 (RMB Million)
- Table 18.16. WuXi Biologics: Revenues by Regions of Operation, Since FY 2019 (RMB Million)
- Table 18.17. Recent Partnerships: Cumulative Distribution by Year of Partnership
- Table 18.18. Recent Partnerships: Distribution by Partnership Model
- Table 18.19. Recent Partnerships: Year-wise Trend by Type of Partnership
- Table 18.20. Recent Partnerships: Distribution by Scale of Operation
- Table 18.21. Recent Partnerships: Distribution by Type of Biologic
- Table 18.22. Recent Partnerships: Distribution by Focus Area
- Table 18.23. Recent Partnerships: Distribution by Therapeutic Area
- Table 18.24. Recent Partnerships: Most Active Players
- Table 18.25. Geographical Distribution by Number of Partnerships
- Table 18.26. Geographical Distribution by Type of Partnership Model
- Table 18.27. Recent Partnerships: Intercontinental and Intracontinental Distribution
- Table 18.28. Recent Expansions: Cumulative Distribution by Year of Expansion, Since 2016
- Table 18.29. Recent Expansions: Distribution by Type of Expansion
- Table 18.30. Recent Expansions: Distribution by Sale of Operation
- Table 18.31. Recent Expansions: Distribution by Type of Biologic
- Table 18.32. Recent Expansions: Distribution by Type of Biologic and Type of Expansion
- Table 18.33. Recent Expansions: Distribution by Location of Expansion Project
- Table 18.34. Recent Expansions: Distribution by Type of Expansion and Location of Facility
- Table 18.35. Recent Expansions: Distribution by Capacity of Expanded Facility (L)
- Table 18.36. Recent Expansions: Most Active Players
- Table 18.37. Geographical Distribution by Number of Expansions
- Table 18.38. Geographical Distribution by Type of Expansion
- Table 18.39. Recent Expansions: Geographical Distribution by Country
- Table 18.40. Clinical Trials: Distribution by Trial Registration Year (Cumulative Year-wise Trend)
- Table 18.41. Clinical Trials: Distribution of Active Trials by Trial Phase
- Table 18.42. Clinical Trials: Distribution by Trial Recruitment Status
- Table 18.43. Clinical Trials: Distribution by Trial Registration Year and Trial Recruitment Status
- Table 18.44. Clinical Trials: Distribution by Geography
- Table 18.45. Clinical Trials: Distribution of Enrolled Patient Population by Geography
- Table 18.46. Clinical Trials: Distribution of Enrolled Patient Population by Trial
- Table 18.47. Clinical Trials: Distribution of Enrolled Patient Population in Active Trials by Trial Phase
- Table 18.48. Clinical Trials: Distribution by Type of Sponsor / Collaborator
- Table 18.49. Clinical Trials: Most Active Industry Players (In terms of Number of Registered Trials)
- Table 18.50. Clinical Trials: Most Active Non-Industry Players (In terms of Number of Registered Trials)
- Table 18.51. Clinical Trials: Distribution by Clinical Trial Centers
- Table 18.52. Regional Distribution of Chinese Biopharmaceutical Contract Manufacturers by Location of Manufacturing Facilities
- Table 18.53. Chinese Biopharmaceutical Contract Manufacturers: Regional Distribution by Type of Product
- Table 18.54. Regional Capability Analysis: Northern China
- Table 18.55. Regional Capability Analysis: Eastern China
- Table 18.56. Regional Capability Analysis: Central China
- Table 18.57. Regional Capability Analysis: Southern China
- Table 18.58. Chinese Biopharmaceutical Contract Manufacturing Capacity: Distribution by Range of Installed Capacity
- Table 18.59. Chinese Biopharmaceutical Contract Manufacturing Capacity: Distribution by Company Size
- Table 18.60. Chinese Biopharmaceutical Contract Manufacturing Capacity: Distribution by Scale of Operation
- Table 18.61. Chinese Biopharmaceutical Contract Manufacturing Capacity: Distribution by Type of Expression System Used
- Table 18.62. Chinese Biopharmaceutical Contract Manufacturing Capacity: Distribution by Location of Manufacturing Facility
- Table 18.63. Chinese Biopharmaceutical Contract Manufacturing Capacity: Distribution by Company Size and Location of Manufacturing Facility
- Table 18.64. Chinese Biopharmaceutical Contract Manufacturing Capacity: Distribution by Scale of Operation and Location of Manufacturing Facility
- Table 18.65. Big Pharma Players in China: Distribution by Number of Biopharmaceutical Manufacturing Focused Initiatives
- Table 18.66. Big Pharma Players in China: Cumulative Distribution by Year of Initiative
- Table 18.67. Big Pharma Players in China: Distribution by Company and Year of Initiative
- Table 18.68. Big Pharma Players in China: Distribution by Type of Initiative
- Table 18.69. Big Pharma Players in China: Distribution by Type of Biologic
- Table 18.70. Big Pharma Players in China: Distribution by Company and Type of Biologic
- Table 18.71. Harvey Ball Analysis: Big Pharma Investment Summary
- Table 18.72. Big Pharma Players in China: Distribution by Location of Initiative
- Table 18.73. Big Pharma Players in China: Regional Distribution of Initiatives
- Table 18.74. Big Pharma Players in China: Distribution by Company and Location of Initiative
- Table 18.75. Biopharmaceutical Contract Manufacturing Market in China, Till 2035 (USD Billion)
- Table 18.76. Biopharmaceutical Contract Manufacturing Market in China for APIs, Till 2035 (USD Billion)
- Table 18.77. Biopharmaceutical Contract Manufacturing Market in China for FDFs, Till 2035 (USD Billion)
- Table 18.78. Biopharmaceutical Contract Manufacturing Market in China: Distribution by Type of Expression System Used
- Table 18.79. Biopharmaceutical Contract Manufacturing Market in China: Share of Mammalian Systems, Till 2035 (USD Billion)
- Table 18.80. Biopharmaceutical Contract Manufacturing Market in China: Share of Microbial Systems, Till 2035 (USD Billion)
- Table 18.81. Biopharmaceutical Contract Manufacturing Market in China: Share of Other Expression Systems, Till 2035 (USD Billion)
- Table 18.82. Biopharmaceutical Contract Manufacturing Market in China: Distribution by Scale of Operation (USD Billion)
- Table 18.83. Biopharmaceutical Contract Manufacturing Market in China: Share of Preclinical / Clinical Scale Operations, Till 2035 (USD Billion)
- Table 18.84. Biopharmaceutical Contract Manufacturing Market in China: Share of Commercial Scale of Operations, Till 2035 (USD Billion)
- Table 18.85. Biopharmaceutical Contract Manufacturing Market in China: Distribution by Company Size (USD Billion)
- Table 18.86. Biopharmaceutical Contract Manufacturing Market in China: Share of Small Companies, Till 2035 (USD Billion)
- Table 18.87. Biopharmaceutical Contract Manufacturing Market in China: Share of Mid-sized Companies, Till 2035 (USD Billion)
- Table 18.88. Biopharmaceutical Contract Manufacturing Market in China: Share of Large and Very Large Companies, Till 2035 (USD Billion)
- Table 18.89. Biopharmaceutical Contract Manufacturing Market in China: Distribution by Type of Biologic (USD Billion)
- Table 18.90. Biopharmaceutical Contract Manufacturing Market in China: Share of Antibodies, Till 2035 (USD Billion)
- Table 18.91. Biopharmaceutical Contract Manufacturing Market in China: Share of Vaccines, Till 2035 (USD Billion)
- Table 18.92. Biopharmaceutical Contract Manufacturing Market in China: Share of Others, Till 2035 (USD Billion)
- Table 18.93. Biopharmaceutical Contract Manufacturing Market in China, Till 2035: COVID-19 Impact Informed Scenario (USD Billion)
List of Figures
- Figure 3.1. Types of Biopharmaceuticals
- Figure 3.2. Key Steps Involved in the Manufacturing of Biopharmaceuticals
- Figure 3.3. Type of Third-Party Service Providers
- Figure 3.4. Chinese Regulatory Scenario: Responsibilities of the Contract Giver
- Figure 3.5. Chinese Regulatory Scenario: Responsibilities of the Contract Acceptor
- Figure 3.6. Important Aspects of the Contract
- Figure 3.7. Commonly Outsourced Operations
- Figure 3.8. Key Factors to Consider while Selecting a CMO Partner
- Figure 3.9. Risks and Challenges Associated with Contract Manufacturing
- Figure 4.1. Small Molecules versus Large Molecules: Comparison of Key Characteristics
- Figure 4.2. Small Molecule versus Large Molecules: Comparison of Manufacturing Process
- Figure 5.1. Chinese Biopharmaceutical Contract Manufacturers: Distribution by Year of Establishment
- Figure 5.2. Chinese Biopharmaceutical Contract Manufacturers: Distribution by Company Size
- Figure 5.3. Chinese Biopharmaceutical Contract Manufacturers: Distribution by Scale of Operation
- Figure 5.4. Chinese Biopharmaceutical Contract Manufacturers: Distribution by Location of Headquarters
- Figure 5.5. Chinese Biopharmaceutical Contract Manufacturers: Distribution by Location of Manufacturing Facilities (Country-Wise)
- Figure 5.6. Chinese Biopharmaceutical Contract Manufacturers: Distribution by Type of Product
- Figure 5.7. Chinese Biopharmaceutical Contract Manufacturers: Distribution by Type of Services Offered
- Figure 5.8. Chinese Biopharmaceutical Contract Manufacturers: Distribution by Type of Biologic
- Figure 5.9. Chinese Biopharmaceutical Contract Manufacturers: Distribution by Type of Expression System Used
- Figure 5.10. Chinese Biopharmaceutical Contract Manufacturers: Distribution by Type of Bioreactor Used
- Figure 5.11. Chinese Biopharmaceutical Contract Manufacturers: Distribution by Mode of Operation of Bioreactor
- Figure 5.12. Chinese Biopharmaceutical Contract Manufacturers: Distribution by Type of Packaging Form Used
- Figure 5.13. Chinese Biopharmaceutical Contract Manufacturers: Distribution by Regulatory Accreditations / Certifications
- Figure 6.1. JOINN Biologics: Development Services
- Figure 6.2. WuXi Biologics: Annual Revenues, Since FY 2016 (RMB Million)
- Figure 6.3. WuXi of Biologics: Revenues by Regions of Operation, Since FY 2019 (RMB Million)
- Figure 7.1. Recent Partnerships: Cumulative Distribution by Year of Partnership
- Figure 7.2. Recent Partnerships: Distribution by Partnership Model
- Figure 7.3. Recent Partnerships: Year-wise Trend by Type of Partnership
- Figure 7.4. Recent Partnerships: Distribution by Scale of Operation
- Figure 7.5. Recent Partnerships: Distribution by Type of Biologic
- Figure 7.6. Recent Partnerships: Distribution by Focus Area
- Figure 7.7. Recent Partnerships: Distribution by Therapeutic Area
- Figure 7.8. Recent Partnerships: Most Active Players
- Figure 7.9. Geographical Distribution by Number of Partnerships
- Figure 7.10. Geographical Distribution by Type of Partnership Model
- Figure 7.11. Recent Partnerships: Intercontinental and Intracontinental Distribution
- Figure 8.1. Recent Expansions: Cumulative Distribution by Year of Expansion, Since 2016
- Figure 8.2. Recent Expansions: Distribution by Type of Expansion
- Figure 8.3. Recent Expansions: Distribution by Scale of Operation
- Figure 8.4. Recent Expansions: Distribution by Type of Biologic
- Figure 8.5. Recent Expansions: Distribution by Type of Biologic and Type of Expansion
- Figure 8.6. Recent Expansions: Distribution by Location of Expansion Project
- Figure 8.7. Recent Expansions: Distribution by Type of Expansion and Location of Facility
- Figure 8.8. Recent Expansions: Distribution by Capacity of Expanded Facility (L)
- Figure 8.9. Recent Expansions: Most Active Players
- Figure 8.10. Geographical Distribution by Number of Expansion
- Figure 8.11. Geographical Distribution by Type of Expansion
- Figure 8.12. Geographical Distribution by Country
- Figure 9.1. Clinical Trials: Distribution by Trial Registration Year (Cumulative Year-wise Trend)
- Figure 9.2. Clinical Trials: Distribution of Active Trials by Trial Phase
- Figure 9.3. Clinical Trials: Distribution by Trial Recruitment Status
- Figure 9.4. Clinical Trials: Distribution by Trial Registration Year and Trial Recruitment Status
- Figure 9.5. Clinical Trial Analysis: Distribution by Geography
- Figure 9.6. Clinical Trials: Distribution of Enrolled Patient Population by Geography
- Figure 9.7. Clinical Trials: Distribution of Enrolled Patient Population by Trial Registration Year
- Figure 9.8. Clinical Trials: Distribution of Enrolled Patient Population in Active Trials by Trial Phase
- Figure 9.9. Clinical Trials: Distribution by Type of Sponsor / Collaborator
- Figure 9.10. Clinical Trials: Most Active Industry Players (In Terms of Number of Registered Trials)
- Figure 9.11. Clinical Trials: Most Active Non-Industry Players (In Terms of Number of Registered Trials)
- Figure 9.12. Clinical Trials: Distribution by Clinical Trial Centers
- Figure 10.1. Regional Distribution of Chinese Biopharmaceutical Contract Manufacturers by Location of Manufacturing Facilities
- Figure 10.2. Regional Capability Analysis: Northern China
- Figure 10.3. Regional Capability Analysis: Eastern China
- Figure 10.4. Regional Capability Analysis: Eastern China
- Figure 10.5. Regional Capability Analysis: Southern China
- Figure 11.1. Chinese Biopharmaceutical Contract Manufacturing Capacity: Distribution by Range of Installed Capacity
- Figure 11.2. Chinese Biopharmaceutical Contract Manufacturing Capacity: Distribution by Company Size
- Figure 11.3. Chinese Biopharmaceutical Contract Manufacturing Capacity: Distribution by Scale of Operation
- Figure 11.4. Chinese Biopharmaceutical Contract Manufacturing Capacity: Distribution by Type of Expression System Used
- Figure 11.5. Chinese Biopharmaceutical Contract Manufacturing Capacity: Distribution by Location of Manufacturing Facility
- Figure 11.6. Chinese Biopharmaceutical Contract Manufacturing Capacity: Distribution by Company Size and Location of Manufacturing Facility
- Figure 11.7. Chinese Biopharmaceutical Contract Manufacturing Capacity: Distribution by Scale of Operation and Location of Manufacturing Facility
- Figure 12.1. Big Pharma Players in China: Distribution by Number of Biopharmaceutical Manufacturing Focused Initiatives
- Figure 12.2. Big Pharma Players in China: Cumulative Distribution by Year of Initiative
- Figure 12.3. Big Pharma Players in China: Distribution by Company and Year of Initiative
- Figure 12.4. Big Pharma Players in China: Distribution by Type of Initiative
- Figure 12.5. Big Pharma Players in China: Distribution by Type of Biologic
- Figure 12.6. Big Pharma Players in China: Distribution by Company and Type of Biologic
- Figure 12.7. Harvey Ball Analysis: Big Pharma Investment Summary
- Figure 12.8. Big Pharma Players in China: Distribution by Location of Initiative
- Figure 12.9. Big Pharma Players in China: Regional Distribution of Initiatives
- Figure 12.10. Big Pharma Players in China: Distribution by Company and Location of Initiative
- Figure 13.1. Make versus Buy Decision Making Framework
- Figure 13.2. Make versus Buy Decision Making: Possible Scenario Descriptions
- Figure 14.1. Biopharmaceutical Contract Manufacturing Market in China, Till 2035 (USD Million)
- Figure 14.2. Biopharmaceutical Contract Manufacturing Market in China for APIs, Till 2035 (USD Million)
- Figure 14.3. Biopharmaceutical Contract Manufacturing Market in China for FDFs, Till 2035 (USD Million)
- Figure 14.4. Biopharmaceutical Contract Manufacturing Market in China: Distribution by Type of Expression System Used (USD Billion)
- Figure 14.5. Biopharmaceutical Contract Manufacturing Market in China: Share of Mammalian Systems, Till 2035 (USD Billion)
- Figure 14.6. Biopharmaceutical Contract Manufacturing Market in China: Share of Microbial Systems, Till 2035 (USD Billion)
- Figure 14.7. Biopharmaceutical Contract Manufacturing Market in China: Share of Other Expression Systems, Till 2035 (USD Billion)
- Figure 14.8. Biopharmaceutical Contract Manufacturing Market in China: Distribution by Scale of Operation (USD Billion)
- Figure 14.9. Biopharmaceutical Contract Manufacturing Market in China: Share of Preclinical / Clinical Scale Operations, Till 2035 (USD Billion)
- Figure 14.10. Biopharmaceutical Contract Manufacturing Market in China: Share of Commercial Operations, Till 2035 (USD Billion)
- Figure 14.11. Biopharmaceutical Contract Manufacturing Market in China: Distribution by Company Size, 2020, 2025 and 2030 (USD Billion)
- Figure 14.12. Biopharmaceutical Contract Manufacturing Market in China: Share of Small Companies, Till 2035 (USD Billion)
- Figure 14.13. Biopharmaceutical Contract Manufacturing Market in China: Share of Mid-sized Companies, Till 2035 (USD Billion)
- Figure 14.14. Biopharmaceutical Contract Manufacturing Market in China: Share of Large / Very Large Companies, Till 2035 (USD Billion)
- Figure 14.15. Biopharmaceutical Contract Manufacturing: Distribution of Manufacturing Agreements Based on Type of Biologics and Geography
- Figure 14.16. Biopharmaceutical Contract Manufacturing Market in China: Distribution by Type of Biologic (USD Billion)
- Figure 14.17. Biopharmaceutical Contract Manufacturing Market in China: Share of Antibodies, Till 2035 (USD Billion)
- Figure 14.18. Biopharmaceutical Contract Manufacturing Market in China: Share of Vaccines, Till 2035 (USD Billion)
- Figure 14.19. Biopharmaceutical Contract Manufacturing Market in China: Share of Other Biologics, Till 2035 (USD Billion)
- Figure 15.1. Biopharmaceutical Contract Manufacturing Market in China, Till 2035: COVID-19 Impact Informed Scenario (USD Billion)
- Figure 16.1. Chinese Biopharmaceutical Contract Manufacturers: SWOT Analysis
- Figure 16.2. Comparison of SWOT Factors: Harvey Ball Analysis

