
PUBLISHER: Roots Analysis | PRODUCT CODE: 1762539

PUBLISHER: Roots Analysis | PRODUCT CODE: 1762539
Non-Viral Transfection Reagents Market : Industry Trends and Global Forecasts - Distribution by Type of Non-Viral Transfection Method, Application Areas, End-User, and Key Geographical Regions
NON-VIRAL TRANSFECTION REAGENTS MARKET: OVERVIEW
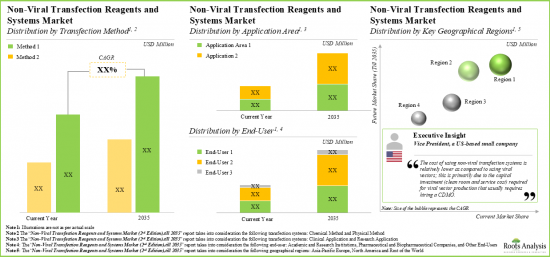
As per Roots Analysis, the global non-viral transfection reagents market valued at USD 633 million in the current year is projected to grow at a CAGR of 8.0% during the forecast period, till 2035.
The market sizing and opportunity analysis has been segmented across the following parameters:
Type of Non-Viral Transfection Method
- Chemical Methods
- Physical Methods
- Other Methods
Application Areas
- Clinical Applications
- Research Applications
End-User
- Academic and Research Institutions
- Pharmaceutical Companies
- Other End-Users
Key Geographical Regions
- North America
- Europe
- Asia-Pacific
- Rest of the World
NON-VIRAL TRANSFECTION REAGENTS MARKET: GROWTH AND TRENDS
Over the years, a large number of nucleic acid-based therapies have gained regulatory approval, underscoring both their therapeutic potential and rising popularity. As a result, there has been an increased demand for vectors capable of efficiently delivering these therapies. Notably, transfection is one such process of artificially introducing genetic material / nucleic acid into the cells with the use of specific carriers / vectors. However, conventional transfection through viral vectors poses several challenges, such as complications related to immunogenicity and cytotoxicity along with being a cost-intensive development process. Consequently, the demand for alternative gene drug vehicles such as non-viral transfection reagents has increased. The non-viral transfection reagents can overcome limitations, such as inflammation and non-specific transduction, associated with viral vectors. Further, these vectors are significantly cost effective than their virus-based counterparts, implying the potential for use in the development of more affordable products in the gene therapy market.
In non-viral transfection method, the gene transfer to cells may involve either direct introduction of DNA into the host cell, or the delivery of carrier gene by a complex formation with lipids, polymers or lipo-polymers. In both cases, gene sequences are inserted into a plasmid (vector) for its expression within the host. Due to low immunogenicity, non-viral transfection systems allow re-dosing of genetic material without the risk of complications. Moreover, such reagents are more economical than viral vectors as they can be easily produced in large quantities.
NON-VIRAL TRANSFECTION REAGENTS MARKET: KEY INSIGHTS
The report delves into the current state of the non-viral transfection reagents market and identifies potential growth opportunities within industry. Some key findings from the report include:
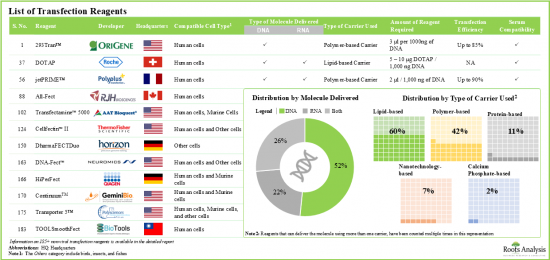
- Over 185 non-viral transfection reagents are currently available in the market; of these, ~60% use lipid-based carriers to enable the transfection of genetic material.
- In pursuit of building a competitive edge, industry stakeholders are actively enhancing their respective offerings to comply with the evolving industry benchmarks.
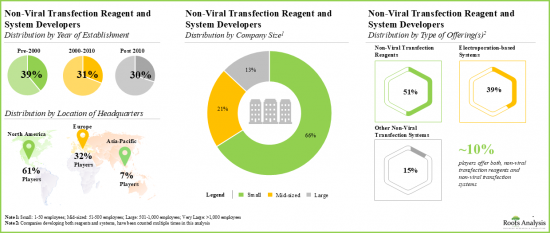
- Over 20 electroporation-based systems and more than 35 other non-viral transfection systems have been developed for the delivery of DNA, RNA and protein fragments, in different types of cells.
- Developers are focused on the integration of advanced features in their respective systems, in order to maintain their competitive position in the market.
- The current market landscape of non-viral transfection and reagent developers features the presence of both established and emerging players, located across key global regions.
- A notable increase in published scientific literature related to non-viral transfection methods and techniques has been observed in the past few years.
- In the past four years, around 870 patents have been filed / granted related to non-viral transfection methods; of these, over 60% of the patents were by non-academic players.
- Foreseeing a lucrative potential, big pharma players have also undertaken several initiatives focused on non-viral transfection; notably, all collaborations inked by such players in the past two years were focused on preclinical operations.
- In order to optimize the price of advanced therapies, innovators are anticipated to forge alliances with non-viral transfection reagent and system developers.
- Cost is a key determinant for the adoption of non-viral transfection techniques; the pricing strategy framework is likely to assist players in evaluating competitive prices for their reagents.
- The market is likely to witness an annual growth of 8.0%; the projected opportunity is expected to be well distributed across different transfection methods, application areas, end-users and key geographical regions
NON-VIRAL TRANSFECTION REAGENTS MARKET: KEY SEGMENTS
Physical Methods Segment holds the Largest Share of the Non-Viral Transfection Reagents Market
Based on the type of non-viral transfection method, the market is segmented into chemical methods, physical methods and other methods. At present, the physical methods segment holds the maximum share of the global non-viral transfection reagents market. Further, the non-viral transfection reagents market for other methods segment is expected to show the highest market growth potential during the forecast period.
By Application Areas, Clinical Applications is the Fastest Growing Segment of the Global Non-Viral Transfection Reagents Market
Based on the application areas, the market is segmented into clinical applications and research applications. At present, the research applications segment holds the maximum share of the global non-viral transfection reagents market. Further, the market for clinical applications segment is expected to grow at a higher CAGR during the forecast period.
By End-User, Academic and Research Institutions Segment Accounts for the Largest Share of the Global Non-Viral Transfection Reagents Market
Based on the end-user, the market is segmented into academic and research institutions, pharmaceutical companies and other end-users. Currently, the academic and research institutions segment captures the highest proportion of the global non-viral transfection reagents market. However, the pharmaceutical companies segment is expected to grow at a higher CAGR during the forecast period.
North America Accounts for the Largest Share of the Market
Based on key geographical regions, the market is segmented into North America, Europe, Asia-Pacific and Rest of the World. Currently, North America dominates the global non-viral transfection reagents market and accounts for the largest revenue share. Further, the market in Asia-Pacific is likely to grow at a higher CAGR in the coming future.
Example Players in the Non-Viral Transfection Reagents Market
- Altogen Biosystems
- Bio-Rad Laboratories
- BEX
- BTX
- Celsion
- Genprex
- Inovio Pharmaceuticals
- MaxCyte
- MilliporeSigma
- Nepa Gene
- OZ Biosciences
- Thermo Fisher Scientific
NON-VIRAL TRANSFECTION REAGENTS MARKET: RESEARCH COVERAGE
- Market Sizing and Opportunity Analysis: The report features an in-depth analysis of the global non-viral transfection reagents market, focusing on key market segments, including [A] type of non-viral transfection method, [B] application areas, [C] end-user and [D] key geographical regions.
- Non-Viral Transfection Reagents Market Landscape: A comprehensive evaluation of the companies developing non-viral transfection reagents, based on several relevant parameters, such as [A] type of carrier used, [B] compatible cell type, [C] type of molecule delivered and [D] serum compatibility. Additionally, a comprehensive evaluation of non-viral transfection reagent developers, based on several relevant parameters, such as [A] year of establishment, [B] company size and [C] location of headquarters.
- Electroporation-Based Transfection Systems Market Landscape: A detailed analysis of the companies developing electroporation-based non-viral transfection systems, based on several relevant parameters, such as [A] compatible cell type and [B] type of molecule delivered. Additionally, a comprehensive evaluation of electroporation transfection systems developers, based on several relevant parameters, such as [A] year of establishment, [B] company size and [C] location of headquarters.
- Other Non-Viral Transfection Systems Market Landscape: An insightful evaluation of the companies developing other non-viral transfection systems, based on several relevant parameters, such as [A] compatible cell type and [B] type of molecule delivered. Additionally, a comprehensive evaluation of other non-viral transfection systems developers, based on several relevant parameters, such as [A] year of establishment, [B] company size and [C] location of headquarters.
- Company Competitiveness Analysis: A comprehensive competitive analysis of non-viral transfection reagent and system developers, examining factors, such as [A] developer strength and [B] product portfolio strength.
- Technology Competitiveness Analysis: A detailed analysis of electroporation transfection systems and other non-viral transfection systems, examining factors, such as [A] developer strength and [B] product portfolio strength.
- Company Profiles: In-depth profiles of key players that are engaged in the development of non-viral transfection reagents and systems, focusing on [A] overview of the company, [B] financial information (if available) and [C] recent developments and an informed future outlook.
- Potential Strategic Partners: An insightful analysis of more than 80 cell and gene therapy developers that are likely to partner with non-viral transfection reagent and system developers, based on several relevant parameters, such as [A] pipeline maturity, [B] developer strength, [C] pipeline strength and [D] type of therapy.
- Benchmark Analysis: A comprehensive benchmark analysis of various non-viral focused initiatives undertaken by big pharma players, based on several relevant parameters, such as [A] year of initiative, [B] type of initiative, [C] type of therapy and [D] target therapeutic area.
- Patent Analysis: An in-depth analysis of patents filed / granted till date in the non-viral transfection systems domain, based on various relevant parameters, such as [A] type of patent, [B] publication year, [C] application year, [D] geography, [E] type of applicant, [F] CPC symbols, [G] emerging focus areas, [H] leading players (in terms of number of patents granted / filed), [I] patent benchmarking and [J] valuation analysis.
- Publication Analysis: An insightful analysis of over 450 peer-reviewed, scientific articles focused on non-viral transfection reagents and systems, based on various relevant parameters, such as [A] year of publication, [B] type of publication, [C] type of molecule delivered, [D] target therapeutic area, [E] key focus areas, [F] popular cells and cell lines. Additionally, the section includes analysis of the leading publishers across different geographies and key journals (in terms of number of articles published).
- Roots Analysis Pricing Strategy Framework: A detailed framework for analyzing the pricing strategy of a company's non-viral transfection reagents and its competitive market position, including an equation to estimate reagent prices based on their characteristics.
KEY QUESTIONS ANSWERED IN THIS REPORT
- How many companies are currently engaged in this market?
- Which are the leading companies in this market?
- What factors are likely to influence the evolution of this market?
- What is the current and future market size?
- What is the CAGR of this market?
- How is the current and future market opportunity likely to be distributed across key market segments?
REASONS TO BUY THIS REPORT
- The report provides a comprehensive market analysis, offering detailed revenue projections of the overall market and its specific sub-segments. This information is valuable to both established market leaders and emerging entrants.
- Stakeholders can leverage the report to gain a deeper understanding of the competitive dynamics within the market. By analyzing the competitive landscape, businesses can make informed decisions to optimize their market positioning and develop effective go-to-market strategies.
- The report offers stakeholders a comprehensive overview of the market, including key drivers, barriers, opportunities, and challenges. This information empowers stakeholders to stay abreast of market trends and make data-driven decisions to capitalize on growth prospects.
ADDITIONAL BENEFITS
- Complimentary PPT Insights Packs
- Complimentary Excel Data Packs for all Analytical Modules in the Report
- 15% Free Content Customization
- Detailed Report Walkthrough Session with Research Team
- Free Updated report if the report is 6-12 months old or older
TABLE OF CONTENTS
1. PREFACE
- 1.1. Scope of the Report
- 1.2. Research Methodology
- 1.2.1. Research Assumptions
- 1.2.2. Project Methodology
- 1.2.3. Forecast Methodology
- 1.2.4. Robust Quality Control
- 1.2.5. Key Considerations
- 1.2.5.1. Demographics
- 1.2.5.2. Economic Factors
- 1.2.5.3. Government Regulations
- 1.2.5.4. Supply Chain
- 1.2.5.5. COVID Impact / Related Factors
- 1.2.5.6. Market Access
- 1.2.5.7. Healthcare Policies
- 1.2.5.8. Industry Consolidation
- 1.3 Key Questions Answered
- 1.4. Chapter Outlines
2. EXECUTIVE SUMMARY
3. INTRODUCTION
- 3.1. Chapter Overview
- 3.2. Introduction to Transfection
- 3.3. Methods of Transfection
- 3.3.1. Viral Transfection Systems
- 3.3.1.1. Types of Viral Transfection Vectors
- 3.3.1.1.1. Adeno-associated Virus-based Vectors
- 3.3.1.1.2. Adenovirus-based Vectors
- 3.3.1.1.3. Herpes Virus-based Vectors
- 3.3.1.1.4. Lentivirus-based Vectors
- 3.3.1.1.5. Retroviral-based Vectors
- 3.3.1.1. Types of Viral Transfection Vectors
- 3.3.2. Non-Viral Transfection Systems
- 3.3.2.1. Chemical-based Transfection
- 3.3.2.1.1. Lipoplexes-based Transfection
- 3.3.2.1.2. Polyplexes-based Transfection
- 3.3.2.1.3. Lipo-polyplexes-based Transfection
- 3.3.2.1.4. Dendrimer-based Transfection
- 3.3.2.1.5. Cell Penetrating Peptide-based Transfection
- 3.3.2.2. Physical Transfection Systems
- 3.3.2.2.1. Electroporation-based Transfection
- 3.3.2.2.2. Gene Gun-based Transfection
- 3.3.2.2.3. Sonoporation-based Transfection
- 3.3.2.2.4. Microinjection-based Transfection
- 3.3.2.2.5. Magnetofection-based Transfection
- 3.3.2.1. Chemical-based Transfection
- 3.3.1. Viral Transfection Systems
- 3.4. Applications of Transfection
- 3.4.1. Advanced Therapeutic Medicinal Product Development
- 3.4.2. Gene Silencing
- 3.4.3. Generation of Stable Cell Lines
- 3.4.4. Large-scale Protein Production
- 3.4.5. Stem Cell Engineering
- 3.5. Future Perspectives
4. NON-VIRAL TRANSFECTION REAGENTS: MARKET LANDSCAPE
- 4.1. Chapter Overview
- 4.2. List of Non-Viral Transfection Reagents
- 4.2.1. Analysis by Type of Carrier Used
- 4.2.2. Analysis by Compatible Cell Type
- 4.2.3. Analysis by Type of Molecule Delivered
- 4.2.4. Analysis by Serum Compatibility
- 4.3 List of Non-Viral Transfection Reagent Developers
- 4.3.1. Analysis by Year of Establishment
- 4.3.2. Analysis by Company Size
- 4.3.3. Analysis by Location of Headquarters (Region-wise)
- 4.3.4. Analysis by Location of Headquarters (Country-wise)
5. ELECTROPORATION-BASED TRANSFECTION SYSTEMS: MARKET LANDSCAPE
- 5.1. Chapter Overview
- 5.2. List of Electroporation-based Transfection Systems
- 5.2.1. Analysis by Compatible Cell Type
- 5.2.2. Analysis by Type of Molecule Delivered
- 5.3. List of Electroporation-based Transfection System Developers
- 5.3.1. Analysis by Year of Establishment
- 5.3.2. Analysis by Company Size
- 5.3.3. Analysis by Location of Headquarters (Region -wise)
- 5.3.4. Analysis by Location of Headquarters (Country-wise)
6. OTHER NON-VIRAL TRANSFECTION SYSTEMS: MARKET LANDSCAPE
- 6.1. Chapter Overview
- 6.2. List of Other Non-Viral Transfection Systems
- 6.2.1. Analysis by Compatible Cell Type
- 6.2.2. Analysis by Type of Molecule Delivered
- 6.3. List of Other Non-Viral Transfection System Developers
- 6.3.1. Analysis by Year of Establishment
- 6.3.2. Analysis by Company Size
- 6.3.3. Analysis by Location of Headquarters (Region-wise)
- 6.3.4. Analysis by Location of Headquarters (Country-wise)
7. COMPANY COMPETITIVENESS ANALYSIS
- 7.1. Chapter Overview
- 7.2. Methodology and Key Parameters
- 7.3. Non-Viral Transfection Reagent Developers: Company Competitiveness Analysis
- 7.3.1. Non-Viral Transfection Reagent Developers based in North America
- 7.3.2. Non-Viral Transfection Reagent Developers based in Europe
- 7.3.3. Non-Viral Transfection Reagent Developers based in Asia-Pacific and Rest of the World
8. TECHNOLOGY COMPETITIVENESS ANALYSIS
- 8.1. Chapter Overview
- 8.2. Methodology and Key Parameters
- 8.3. Electroporation-based Transfection Systems: Technology Competitiveness Analysis
- 8.3.1. Technologies Offered by Players based in North America
- 8.3.2. Technologies Offered by Players based in Europe
- 8.3.3. Technologies Offered by Players based in Asia-Pacific and Rest of the World
- 8.4. Other Non-Viral Transfection Systems: Technology Competitiveness Analysis
- 8.4.1. Technologies Offered by Players based in North America
- 8.4.2. Technologies Offered by Players based in Europe
- 8.4.3. Technologies Offered by Players based in Asia-Pacific and Rest of the World
9. COMPANY PROFILES
- 9.1. Chapter Overview
- 9.2. Non-Viral Transfection Reagent Developers
- 9.2.1. MilliporeSigma
- 9.2.1.1. Company Overview
- 9.2.1.2. Financial Information
- 9.2.1.3. Recent Developments and Future Outlook
- 9.2.2. OZ Biosciences
- 9.2.2.1. Company Overview
- 9.2.2.2. Recent Developments and Future Outlook
- 9.2.3. Thermo Fisher Scientific
- 9.2.3.1. Company Overview
- 9.2.3.2. Financial Information
- 9.2.3.3. Recent Development and Future Outlook
- 9.2.1. MilliporeSigma
- 9.3. Electroporation-based Transfection System Developers
- 9.3.1. BEX
- 9.3.1.1. Company Overview
- 9.3.1.2. Recent Developments and Future Outlook
- 9.3.2. Bio-Rad Laboratories
- 9.3.2.1. Company Overview
- 9.3.2.2. Financial Information
- 9.3.2.3. Recent Developments and Future Outlook
- 9.3.3. BTX (A subsidiary of Harvard Bioscience)
- 9.3.3.1. Company Overview
- 9.3.3.2. Recent Developments and Future Outlook
- 9.3.4. MaxCyte
- 9.3.4.1. Company Overview
- 9.3.4.2. Financial Information
- 9.3.4.3. Recent Developments and Future Outlook
- 9.3.5. NepaGene
- 9.3.5.1. Company Overview
- 9.3.5.2. Recent Developments and Future Outlook
- 9.3.1. BEX
- 9.4. Other Non-Viral Transfection System Developers
- 9.4.1. Imunon (Formerly known as Celsion)
- 9.4.1.1. Company Overview
- 9.4.1.2. Recent Developments and Future Outlook
- 9.4.2. Genprex
- 9.4.2.1. Company Overview
- 9.4.2.2. Financial Information
- 9.4.2.3. Recent Developments and Future Outlook
- 9.4.3. Inovio Pharmaceuticals
- 9.4.3.1. Company Overview
- 9.4.3.2. Financial Information
- 9.4.3.3. Recent Developments and Future Outlook
- 9.4.1. Imunon (Formerly known as Celsion)
10. POTENTIAL STRATEGIC PARTNERS
- 10.1. Chapter Overview
- 10.2. Scope and Methodology
- 10.3. Non-Viral Transfection System Developers: Potential Strategic Partners in North America
- 10.3.1. Most Likely Partners
- 10.3.2. Likely Partners
- 10.3.3. Less Likely Partners
- 10.3.4. Least Likely Partners
- 10.4. Non-Viral Transfection System Developers: Potential Strategic Partners in Europe
- 10.4.1. Most Likely Partners
- 10.4.2. Likely Partners
- 10.4.3. Less Likely Partners
- 10.5. Non-Viral Transfection System Developers: Potential Strategic Partners in Asia-Pacific and Rest of the World
- 10.5.1. Most Likely Partners
- 10.5.2. Likely Partners
- 10.5.3. Less Likely Partners
11. BIG PHARMA INITIATIVES
- 11.1. Chapter Overview
- 11.2. Scope and Methodology
- 11.3. None-Viral Transfection Reagents and System Developers: Big Pharma Initiatives
- 11.3.1. Analysis by Year of Initiative
- 11.3.2. Analysis by Number of Initiative
- 11.3.3. Analysis by Type of Initiative
- 11.3.4. Analysis by Type of Therapy
- 11.3.5. Analysis by Target Therapeutic Area
12. PATENT ANALYSIS
- 12.1. Chapter Overview
- 12.2. Scope and Methodology
- 12.3. Non-Viral Transfection Reagents and Systems: Patent Analysis
- 12.3.1. Analysis by Publication Year
- 12.3.2. Analysis by Application Year
- 12.3.3. Analysis by Patent Jurisdiction
- 12.3.4. Analysis by Type of Applicant
- 12.3.5. Analysis by CPC Sections
- 12.3.6. Analysis by Emerging Focus Areas (Word Cloud Representation)
- 12.3.7. Leading Players: Analysis by Number of Patents
- 12.4. Non-Viral Transfection Reagents and Systems: Patent Benchmarking Analysis
- 12.4.1. Analysis by Patent Characteristics (CPC Symbols)
- 12.4.2. Analysis by Geography
- 12.5. Non-Viral Transfection Reagents and Systems: Patent Valuation Analysis
13. PUBLICATION ANALYSIS
- 13.1. Chapter Overview
- 13.2. Scope and Methodology
- 13.3. Non-Viral Transfection Reagents and Systems: Recent Publications
- 13.4. Analysis by Year of Publication
- 13.5. Analysis by Type of Publication
- 13.6. Analysis by Type of Molecule Delivered
- 13.7. Analysis by Target Therapeutic Area
- 13.8. Analysis by Key Focus Areas (Word Cloud Representation)
- 13.9. Analysis by Prominent Cells and Cell Lines (Word Cloud Representation)
- 13.10. Leading Publishers: Analysis by Number of Publications
- 13.11. Prominent Journals: Analysis by Number of Publications
- 13.12. Prominent Copyright Holders: Analysis by Number of Publications
- 13.13. Key Funding Institutes: Analysis by Number of Publications
14. ROOTS ANALYSIS PRICING STRATEGY FRAMEWORK
- 14.1. Chapter Overview
- 14.2. Roots Analysis Framework
- 14.2.1. Methodology
- 14.2.2. Theoretical Framework and Price Evaluation Hypothesis
- 14.2.3. Results and Interpretation
- 14.2.3.1. Product Price Evaluation Matrix: Based on Transfection Efficiency
- 14.2.3.2. Product Price Evaluation Matrix: Based on Compatible Cell Type
- 14.2.3.3. Product Price Evaluation Matrix: Based on Type of Carrier Used
- 14.2.3.4. Product Price Evaluation Matrix: Based on Type of Molecule Delivered
- 14.2.3.5. Product Price Evaluation Matrix: Based on Serum Compatibility
- 14.3. Concluding Remarks
15. MARKET SIZING AND OPPORTUNITY ANALYSIS
- 15.1. Chapter Overview
- 15.2. Forecast Methodology and Key Assumptions
- 15.3. Non-Viral Transfection Reagents and Systems Market, Till 2035
- 15.4. Non-Viral Transfection Reagents and Systems Market: Analysis by Type of Non-Viral Transfection Method, Till 2035
- 15.5. Non-Viral Transfection Reagents and Systems Market: Analysis by End-User, Till 2035
- 15.6. Non-Viral Transfection Reagents and Systems Market: Analysis by Application Area, Till 2035
- 15.7. Non-Viral Transfection Reagents and Systems Market: Analysis by Key Geographical Regions, Till 2035
- 15.7.1. Non-Viral Transfection Reagents and Systems Market in North America, Till 2035
- 15.7.1.1. Non-Viral Transfection Reagents and Systems Market in North America: Analysis by Type of End-User, Till 2035
- 15.7.1.1.1. Non-Viral Transfection Reagents and Systems Market in North America for Pharmaceutical Companies, Till 2035
- 15.7.1.1.2. Non-Viral Transfection Reagents and Systems Market in North America for Academic and Research Institutions, Till 2035
- 15.7.1.1.3. Non-Viral Transfection Reagents and Systems Market in North America for Other End-Users, Till 2035
- 15.7.1.2. Non-Viral Transfection Reagents and Systems Market in North America: Analysis by Application Area, Till 2035
- 15.7.1.2.1. Non-Viral Transfection Reagents and Systems Market in North America for Research Applications, Till 2035
- 15.7.1.2.2. Non-Viral Transfection Reagents and Systems Market in North America for Clinical Applications, Till 2035
- 15.7.1.1. Non-Viral Transfection Reagents and Systems Market in North America: Analysis by Type of End-User, Till 2035
- 15.7.2. Non-Viral Transfection Reagents and Systems Market in Europe, Till 2035
- 15.7.2.1. Non-Viral Transfection Reagents and Systems Market in Europe: Analysis by Type of End-User, Till 2035
- 15.7.2.1.1. Non-Viral Transfection Reagents and Systems Market in Europe for Pharmaceutical Companies, Till 2035
- 15.7.2.1.2. Non-Viral Transfection Reagents and Systems Market in Europe for Academic and Research Institutions, Till 2035
- 15.7.2.1.3. Non-Viral Transfection Reagents and Systems Market in Europe for Other End-Users, Till 2035
- 15.7.2.2. Non-Viral Transfection Reagents and Systems Market in Europe: Analysis by Application Area, Till 2035
- 15.7.2.2.1. Non-Viral Transfection Reagents and Systems Market in Europe for Research Applications, Till 2035
- 15.7.2.2.2. Non-Viral Transfection Reagents and Systems Market in Europe for Clinical Applications, Till 2035
- 15.7.2.1. Non-Viral Transfection Reagents and Systems Market in Europe: Analysis by Type of End-User, Till 2035
- 15.7.3. Non-Viral Transfection Reagents and Systems Market in Asia-Pacific, Till 2035
- 15.7.3.1. Non-Viral Transfection Reagents and Systems Market in Asia-Pacific: Analysis by Type of End-User, Till 2035
- 15.7.3.1.1. Non-Viral Transfection Reagents and Systems Market in Asia-Pacific for Pharmaceutical Companies, Till 2035
- 15.7.3.1.2. Non-Viral Transfection Reagents and Systems Market in Asia-Pacific for Academic and Research Institutions, Till 2035
- 15.7.3.1.3. Non-Viral Transfection Reagents and Systems Market in Asia-Pacific for Other End-Users, Till 2035
- 15.7.3.2. Non-Viral Transfection Reagents and Systems Market in Asia-Pacific: Analysis by Application Area, Till 2035
- 15.7.3.2.1. Non-Viral Transfection Reagents and Systems Market in Asia-Pacific for Research Applications, Till 2035
- 15.7.3.2.2. Non-Viral Transfection Reagents and Systems Market in Asia-Pacific for Clinical Applications, Till 2035
- 15.7.3.1. Non-Viral Transfection Reagents and Systems Market in Asia-Pacific: Analysis by Type of End-User, Till 2035
- 15.7.4. Non-Viral Transfection Reagents and Systems Market in Rest of the World, Till 2035
- 15.7.4.1. Non-Viral Transfection Reagents and Systems Market in Rest of the World: Analysis by Type of End-User, Till 2035
- 15.7.4.1.1. Non-Viral Transfection Reagents and Systems Market in Rest of the World for Pharmaceutical Companies, Till 2035
- 15.7.4.1.2. Non-Viral Transfection Reagents and Systems Market in Rest of the World for Academic and Research Institutions, Till 2035
- 15.7.4.1.3. Non-Viral Transfection Reagents and Systems Market in Rest of the World for Other End-Users, Till 2035
- 15.7.4.2. Non-Viral Transfection Reagents and Systems Market in Rest of the World: Analysis by Application Area, Till 2035
- 15.7.4.2.1. Non-Viral Transfection Reagents and Systems Market in Rest of the World for Research Applications, Till 2035
- 15.7.4.2.2. Non-Viral Transfection Reagents and Systems Market in Rest of the World for Clinical Applications, Till 2035
- 15.7.4.1. Non-Viral Transfection Reagents and Systems Market in Rest of the World: Analysis by Type of End-User, Till 2035
- 15.7.1. Non-Viral Transfection Reagents and Systems Market in North America, Till 2035
16. EXECUTIVE INSIGHTS
17. CONCLUSION
18. APPENDIX I: TABULATED DATA
19. APPENDIX II: LIST OF COMPANIES AND ORGANIZATIONS
List of Tables
- Table 3.1. Specifications of Viral Vectors
- Table 4.1. Non-Viral Transfection Reagents: Information on Type of Carrier Used, Compatible Cell Type and Volume of Reagent (per unit)
- Table 4.2. Non-Viral Transfection Reagents: Information on Type of Molecule Delivered, Serum Compatibility and Transfection Efficiency
- Table 4.3. Non-Viral Transfection Reagents: Information on Storage Temperature, Number of Transfections Per Unit Volume of Reagent and Cost of Reagent (USD)
- Table 4.4. Non-Viral Transfection Reagent Developers: Information on Year of Establishment, Company Size and Location of Headquarters
- Table 5.1. Electroporation-based Transfection Systems: Information on Compatible Cell Type and Type of Molecule Delivered
- Table 5.2. Electroporation-based Transfection Systems: Information Output Voltage, Pulse and Cost of System (USD)
- Table 5.3. Electroporation-based Transfection System Developers: Information on Year of Establishment, Company Size and Location of Headquarters
- Table 6.1. Other Non-Viral Transfection Systems: Information on Compatible Cell Type and Type of Molecule Delivered
- Table 6.2 Other Non-Viral Transfection System Developers: Information on Year of Establishment, Company Size and Location of Headquarters
- Table 9.1. List of Companies Profiled
- Table 9.2. Altogen Biosystems: Company Snapshot
- Table 9.3. Altogen Biosystems: Recent Developments and Future Outlook
- Table 9.4. Millipore Sigma: Company Snapshot
- Table 9.5. Millipore Sigma: Recent Developments and Future Outlook
- Table 9.6. OZ Biosciences: Company Snapshot
- Table 9.7. OZ Biosciences: Recent Developments and Future Outlook
- Table 9.8. Thermo Fisher Scientific: Company Snapshot
- Table 9.9. Thermo Fisher Scientific: Recent Developments and Future Outlook
- Table 9.10. BEX: Company Snapshot
- Table 9.11. BEX: Recent Developments and Future Outlook
- Table 9.12. Bio-Rad Laboratories: Company Snapshot
- Table 9.13. Bio-Rad Laboratories: Recent Developments and Future Outlook
- Table 9.14. BTX: Company Snapshot
- Table 9.15. BTX: Recent Developments and Future Outlook
- Table 9.16. MaxCyte: Company Snapshot
- Table 9.17. MaxCyte: Recent Developments and Future Outlook
- Table 9.18. NepaGene: Company Snapshot
- Table 9.19. NepaGene: Recent Developments and Future Outlook
- Table 9.20. Imunon: Company Snapshot
- Table 9.21. Imunon: Recent Developments and Future Outlook
- Table 9.22. Genprex: Company Snapshot
- Table 9.23. Genprex: Recent Developments and Future Outlook
- Table 9.24. Inovio Pharmaceuticals: Company Snapshot
- Table 9.25. Inovio Pharmaceuticals: Recent Developments and Future Outlook
- Table 10.1. Most Likely Partners: Non-Viral Vector-based Therapy Developers Headquartered in North America
- Table 10.2. Likely Partners: Non-Viral Vector-based Therapy Developers Headquartered in North America
- Table 10.3. Less Likely Partners: Non-Viral Vector-based Therapy Developers Headquartered in North America
- Table 10.4. Least Likely Partners: Non-Viral Vector-based Therapy Developers Headquartered in North America
- Table 10.5. Most Likely Partners: Non-Viral Vector-based Therapy Developers Headquartered in Europe
- Table 10.6. Likely Partners: Non-Viral Vector-based Therapy Developers Headquartered in Europe
- Table 10.7. Less Likely Partners: Non-Viral Vector-based Therapy Developers Headquartered in Europe
- Table 10.8. Most Likely Partners: Non-Viral Vector-based Therapy Developers Headquartered in Asia-Pacific and Rest of the World
- Table 10.9. Likely Partners: Non-Viral Vector-based Therapy Developers Headquartered in Asia-Pacific and Rest of the World
- Table 10.10. Less Likely Partners: Non-Viral Vector-based Therapy Developers Headquartered in Asia-Pacific and Rest of the World
- Table 11.1. Big Pharma Initiatives: List of Non-Viral Transfection Focused Initiatives
- Table 12.1. Patent Analysis: Top CPC Sections
- Table 12.2. Patent Analysis: Top CPC Symbols
- Table 12.3. Patent Analysis: Top CPC Codes
- Table 12.4. Patent Analysis: Summary of Benchmarking Analysis
- Table 12.5. Patent Analysis: List of Leading Patents (by Highest Relative Valuation)
- Table 14.1. Product Price Evaluation Matrix: Based on Transfection Efficiency
- Table 14.2. Product Price Evaluation Matrix: Based on Compatible Cell Type
- Table 14.3. Product Price Evaluation Matrix: Based on Type of Carrier Used
- Table 14.4. Product Price Evaluation Matrix: Based on Type of Molecule Delivered
- Table 14.5. Product Price Evaluation Matrix: Based on Serum Compatibility
- Table 18.1. Non-Viral Transfection Reagents: Distribution by Type of Carrier Used
- Table 18.2. Non-Viral Transfection Reagents: Distribution by Compatible Cell Type
- Table 18.3. Non-Viral Transfection Reagents: Distribution by Type of Molecule Delivered
- Table 18.4. Non-Viral Transfection Reagents: Distribution by Serum Compatibility
- Table 18.5. Non-Viral Transfection Reagent Developers: Distribution by Year of Establishment
- Table 18.6. Non-Viral Transfection Reagent Developers: Distribution by Company Size
- Table 18.7. Non-Viral Transfection Reagent Developers: Distribution by Location of Headquarters (Region-wise)
- Table 18.8. Non-Viral Transfection Reagent Developers: Distribution by Location of Headquarters (Country-wise)
- Table 18.9. Electroporation-based Transfection Systems: Distribution by Compatible Cell Type
- Table 18.10. Electroporation-based Transfection Systems: Distribution by Type of Molecule Delivered
- Table 18.11. Electroporation-based Transfection System Developers: Distribution by Year of Establishment
- Table 18.12. Electroporation-based Transfection System Developers: Distribution by Company Size
- Table 18.13. Electroporation-based Transfection System Developers: Distribution by Location of Headquarters (Region-wise)
- Table 18.14. Electroporation-based Transfection System Developers: Distribution by Location of Headquarters (Country-wise)
- Table 18.15. Other Non-Viral Transfection Systems: Distribution by Compatible Cell Type
- Table 18.16. Other Non-Viral Transfection Systems: Distribution by Type of Molecule Delivered
- Table 18.17. Other Non-Viral Transfection Systems: Distribution by Year of Establishment
- Table 18.18. Other Non-Viral Transfection System Developers: Distribution by Company Size
- Table 18.19. Other Non-Viral Transfection System Developers: Distribution by Location of Headquarters (Region-wise)
- Table 18.20. Other Non-Viral Transfection System Developers: Distribution by Location of Headquarters (Country-wise)
- Table 18.21 MilliporeSigma: Annual Revenues, Since 2016 (USD Billion)
- Table 18.22 Thermo Fisher Scientific: Annual Revenues, Since 2016 (USD Billion)
- Table 18.23 Bio-Rad Laboratories: Annual Revenues, Since 2016 (USD Million)
- Table 18.24 MaxCyte: Annual Revenues, Since 2016 (USD Million)
- Table 18.25 Genprex: Annual Revenues, Since 2016 (USD Million)
- Table 18.26 Inovio Pharmaceuticals: Annual Revenues, Since 2016 (USD Million)
- Table 18.27 Big Pharma Initiatives: Cumulative Distribution by Year of Initiative
- Table 18.28 Big Pharma Initiatives: Distribution by Number of Initiatives
- Table 18.29 Big Pharma Initiatives: Distribution by Type of Initiative
- Table 18.30 Big Pharma Initiatives: Distribution by Type of Therapy
- Table 18.31 Big Pharma Initiatives: Distribution by Target Therapeutic Area
- Table 18.32 Patent Analysis: Distribution by Type of Patent
- Table 18.33 Patent Analysis: Distribution by Publication Year
- Table 18.34 Patent Analysis: Distribution by Application Year
- Table 18.35 Patent Analysis: Distribution by Patent Jurisdiction
- Table 18.36 Patent Analysis: Distribution by Type of Applicant
- Table 18.37 Patent Analysis: Distribution by CPC Sections
- Table 18.38 Leading Players (Industry): Distribution by Number of Patents
- Table 18.39 Leading Players (Non-Industry): Distribution by Number of Patents
- Table 18.40 Patent Benchmarking: Distribution by Patent Characteristics
- Table 18.41 Patent Analysis (Leading Industry Players): Benchmarking by CPC Symbols
- Table 18.42 Patent Analysis: Distribution by Patent Age
- Table 18.43 Non-Viral Transfection Reagents and Systems: Patent Valuation
- Table 18.44 Publication Analysis: Cumulative Year-wise Trend
- Table 18.45 Publication Analysis: Distribution by Type of Publication
- Table 18.46 Publication Analysis: Distribution by Type of Molecule Delivered
- Table 18.47 Publication Analysis: Distribution by Target Therapeutic Area
- Table 18.48 Leading Publishers: Distribution by Number of Publications
- Table 18.49 Prominent Journals: Distribution by Number of Publications
- Table 18.50 Prominent Copyright Holders: Distribution by Number of Publications
- Table 18.51 Key Funding Institutes: Distribution by Number of Publications
- Table 18.52 Overall Non-Viral Transfection Reagents and Systems Market, Conservative, Base and Optimistic Scenario, Till 2035 (USD Million)
- Table 18.53 Non-Viral Transfection Systems Market, Conservative, Base and Optimistic Scenario: Distribution by Type of Non-Viral Transfection Method, Till 2035 (USD Million)
- Table 18.54 Non-Viral Transfection Systems Market, Conservative, Base and Optimistic Scenario: Distribution by End-User, Till 2035 (USD Million)
- Table 18.55 Non-Viral Transfection Systems Market, Conservative, Base and Optimistic Scenario: Distribution by Application Area, Till 2035 (USD Million)
- Table 18.56 Non-Viral Transfection Systems Market, Conservative, Base and Optimistic Scenario: Distribution by Key Geographical Regions, Till 2035 (USD Million)
- Table 18.57 Non-Viral Transfection Systems Market in North America, Conservative, Base and Optimistic Scenario, Till 2035 (USD Million)
- Table 18.58 Non-Viral Transfection Systems Market in North America for Pharmaceutical Companies, Conservative, Base and Optimistic Scenario, Till 2035 (USD Million)
- Table 18.59 Non-Viral Transfection Systems Market in North America for Academic and Research Institutions, Conservative, Base and Optimistic Scenario, Till 2035 (USD Million)
- Table 18.60 Non-Viral Transfection Systems Market in North America for Other End-Users, Conservative, Base and Optimistic Scenario, Till 2035 (USD Million)
- Table 18.61 Non-Viral Transfection Systems Market in North America for Research Applications, Conservative, Base and Optimistic Scenario, Till 2035 (USD Million)
- Table 18.62 Non-Viral Transfection Systems Market in North America for Clinical Applications, Conservative, Base and Optimistic Scenario, Till 2035 (USD Million)
- Table 18.63 Non-Viral Transfection Systems Market in Europe, Conservative, Base and Optimistic Scenario, Till 2035 (USD Million)
- Table 18.64 Non-Viral Transfection Systems Market in Europe for Pharmaceutical Companies, Conservative, Base and Optimistic Scenario, Till 2035 (USD Million)
- Table 18.65 Non-Viral Transfection Systems Market in Europe for Academic and Research Institutions, Conservative, Base and Optimistic Scenario, Till 2035 (USD Million)
- Table 18.66 Non-Viral Transfection Systems Market in Europe for Other End-Users, Conservative, Base and Optimistic Scenario, Till 2035 (USD Million)
- Table 18.67 Non-Viral Transfection Systems Market in Europe for Research Applications, Conservative, Base and Optimistic Scenario, Till 2035 (USD Million)
- Table 18.68 Non-Viral Transfection Systems Market in Europe for Clinical Applications, Conservative, Base and Optimistic Scenario, Till 2035 (USD Million)
- Table 18.69 Non-Viral Transfection Systems Market in Asia-Pacific, Conservative, Base and Optimistic Scenario, Till 2035 (USD Million)
- Table 18.70 Non-Viral Transfection Systems Market in Asia-Pacific for Pharmaceutical Companies, Conservative, Base and Optimistic Scenario, Till 2035 (USD Million)
- Table 18.71 Non-Viral Transfection Systems Market in Asia-Pacific for Academic and Research Institutions, Conservative, Base and Optimistic Scenario, Till 2035 (USD Million)
- Table 18.72 Non-Viral Transfection Systems Market in Asia-Pacific for Other End-Users, Conservative, Base and Optimistic Scenario, Till 2035 (USD Million)
- Table 18.73 Non-Viral Transfection Systems Market in Asia-Pacific for Research Applications, Conservative, Base and Optimistic Scenario, Till 2035 (USD Million)
- Table 18.74 Non-Viral Transfection Systems Market in Asia-Pacific for Clinical Applications, Conservative, Base and Optimistic Scenario, Till 2035 (USD Million)
- Table 18.75 Non-Viral Transfection Systems Market in Rest of the World, Conservative, Base and Optimistic Scenario, Till 2035 (USD Million)
- Table 18.76 Non-Viral Transfection Systems Market in Rest of the World for Pharmaceutical Companies, Conservative, Base and Optimistic Scenario, Till 2035 (USD Million)
- Table 18.77 Non-Viral Transfection Systems Market in Rest of the World for Academic and Research Institutions, Conservative, Base and Optimistic Scenario, Till 2035 (USD Million)
- Table 18.78 Non-Viral Transfection Systems Market in Rest of the World for Other End-Users, Conservative, Base and Optimistic Scenario, Till 2035 (USD Million)
- Table 18.79 Non-Viral Transfection Systems Market in Rest of the World for Research Applications, Conservative, Base and Optimistic Scenario, Till 2035 (USD Million)
- Table 18.80 Non-Viral Transfection Systems Market in Rest of the World for Clinical Applications, Conservative, Base and Optimistic Scenario, Till 2035 (USD Million)
List of Figures
- Figure 2.1 Executive Summary: Current Landscape of Non-Viral Transfection Reagents
- Figure 2.2 Executive Summary: Current Landscape of Electroporation-based Non-Viral Transfection Systems
- Figure 2.3 Executive Summary: Current Landscape of Other Non-Viral Transfection Systems
- Figure 2.4 Executive Summary: Big Pharma Initiatives
- Figure 2.5 Executive Summary: Patent Analysis
- Figure 2.6 Executive Summary: Publication Analysis
- Figure 2.7 Executive Summary: Market Forecast and Opportunity Analysis
- Figure 3.1 Commonly Used Viral Vectors
- Figure 3.2 Types of Non-Viral Transfection Methods
- Figure 3.3 Electroporation Mechanism
- Figure 3.4 Gene Gun Mechanism
- Figure 3.5 Sonoporation Mechanism
- Figure 3.6 Microinjection Mechanism
- Figure 3.7 Magnetofection Mechanism
- Figure 3.8 Applications of Transfection
- Figure 4.1 Non-Viral Transfection Reagents: Distribution by Type of Carrier Used
- Figure 4.2 Non-Viral Transfection Reagents: Distribution by Compatible Cell Type
- Figure 4.3 Non-Viral Transfection Reagents: Distribution by Type of Molecule Delivered
- Figure 4.4 Non-Viral Transfection Reagents: Distribution by Serum Compatibility
- Figure 4.5 Non-Viral Transfection Reagent Developers: Distribution by Year of Establishment
- Figure 4.6 Non-Viral Transfection Reagent Developers: Distribution by Company Size
- Figure 4.7 Non-Viral Transfection Reagent Developers: Distribution by Location of Headquarters (Region-wise)
- Figure 4.8 Non-Viral Transfection Reagent Developers: Distribution by Location of Headquarters (Country-wise)
- Figure 5.1 Electroporation-based Transfection Systems: Distribution by Compatible Cell Type
- Figure 5.2 Electroporation-based Transfection Systems: Distribution by Type of Molecule Delivered
- Figure 5.3 Electroporation-based Transfection System Developers: Distribution by Year of Establishment
- Figure 5.4 Electroporation-based Transfection System Developers: Distribution by Company Size
- Figure 5.5 Electroporation-based Transfection System Developers: Distribution by Location of Headquarters (Region-wise)
- Figure 5.6 Electroporation-based Transfection System Developers: Distribution by Location of Headquarters (Country-wise)
- Figure 6.1 Other Non-Viral Transfection Systems: Distribution by Compatible Cell Type
- Figure 6.2 Other Non-Viral Transfection Systems: Distribution by Type of Molecule Delivered
- Figure 6.3 Other Non-Viral Transfection Systems: Distribution by Year of Establishment
- Figure 6.4 Other Non-Viral Transfection System Developers: Distribution by Company Size
- Figure 6.5 Other Non-Viral Transfection System Developers: Distribution by Location of Headquarters (Region-wise)
- Figure 6.6 Other Non-Viral Transfection System Developers: Distribution by Location of Headquarters (Country-wise)
- Figure 7.1 Company Competitiveness Analysis: Distribution of Non-Viral Transfection Reagent Developers based in North America
- Figure 7.2 Company Competitiveness Analysis: Distribution of Non-Viral Transfection Reagent Developers based in Europe
- Figure 7.3 Company Competitiveness Analysis: Distribution of Non-Viral Transfection Reagent Developers based in Asia-Pacific and Rest of the World
- Figure 8.1 Electroporation-based Systems: Distribution of Technologies Offered by Players based in North America
- Figure 8.2 Electroporation-based Systems: Distribution of Technologies Offered by Players based in Europe
- Figure 8.3 Electroporation-based Systems: Distribution of Technologies Offered by Players based in Asia-Pacific and Rest of the World
- Figure 8.4 Other Non-Viral Transfection Systems: Distribution of Technologies Offered by Players based in North America
- Figure 8.5 Other Non-Viral Transfection Systems: Distribution of Technologies Offered by Players based in Europe
- Figure 8.6 Other Non-Viral Transfection Systems: Distribution of Technologies Offered by Players based in Asia-Pacific and Rest of the World
- Figure 9.1 MilliporeSigma: Annual Revenues, Since 2016 (USD Billion)
- Figure 9.2 Thermo Fisher Scientific: Annual Revenues, Since 2016 (USD Billion)
- Figure 9.3 Bio-Rad Laboratories: Annual Revenues, Since 2016 (USD Million)
- Figure 9.4 MaxCyte: Annual Revenues, Since 2016 (USD Million)
- Figure 9.5 Genprex: Annual Revenues, Since 2016 (USD Million)
- Figure 9.6 Inovio Pharmaceuticals: Annual Revenues, Since 2016 (USD Million)
- Figure 11.1 Big Pharma Initiatives: Cumulative Distribution by Year of Initiative
- Figure 11.2 Big Pharma Initiatives: Distribution by Number of Initiatives
- Figure 11.3 Big Pharma Initiatives: Distribution by Type of Initiative
- Figure 11.4 Big Pharma Initiatives: Distribution by Type of Therapy
- Figure 11.5 Big Pharma Initiatives: Distribution by Target Therapeutic Area
- Figure 12.1 Patent Analysis: Distribution by Type of Patent
- Figure 12.2 Patent Analysis: Distribution by Publication Year
- Figure 12.3 Patent Analysis: Distribution by Application Year
- Figure 12.4 Patent Analysis: Distribution by Patent Jurisdiction
- Figure 12.5 Patent Analysis: Distribution by Type of Applicant
- Figure 12.6 Patent Analysis: Distribution by CPC Sections
- Figure 12.7 Word Cloud: Emerging Focus Areas
- Figure 12.8 Leading Players (Industry): Distribution by Number of Patents
- Figure 12.9 Leading Players (Non-Industry): Distribution by Number of Patents
- Figure 12.10 Patent Benchmarking: Distribution by Patent Characteristics
- Figure 12.11 Patent Analysis (Leading Industry Players): Benchmarking by CPC Symbols
- Figure 12.12 Patent Analysis: Distribution by Patent Age
- Figure 12.13 Non-Viral Transfection Reagents and Systems: Patent Valuation
- Figure 13.1 Publication Analysis: Cumulative Year-wise Trend
- Figure 13.2 Publication Analysis: Distribution by Type of Publication
- Figure 13.3 Publication Analysis: Distribution by Type of Molecule Delivered
- Figure 13.4 Publication Analysis: Distribution by Target Therapeutic Area
- Figure 13.5 Word Cloud: Key Focus Areas
- Figure 13.6 Word Cloud: Popular Cells and Cell Lines
- Figure 13.7 Leading Publishers: Distribution by Number of Publications
- Figure 13.8 Prominent Journals: Distribution by Number of Publications
- Figure 13.9 Prominent Copyright Holders: Distribution by Number of Publications
- Figure 13.10 Key Funding Institutes: Distribution by Number of Publications
- Figure 14.1 Non-Viral Transfection Reagents and Systems: Roots Analysis Pricing Strategy Framework
- Figure 14.2 Non-Viral Transfection Reagents and Systems: Roots Analysis Pricing Strategy Graphical Interpretation
- Figure 15.1 Overall Non-Viral Transfection Reagents and Systems Market, Till 2035 (USD Million)
- Figure 15.2 Non-Viral Transfection Systems Market: Distribution by Type of Non-Viral Transfection Method, Till 2035 (USD Million)
- Figure 15.3 Non-Viral Transfection Systems Market: Distribution by End-User, Till 2035 (USD Million)
- Figure 15.4 Non-Viral Transfection Systems Market: Distribution by Application Area, Till 2035 (USD Million)
- Figure 15.5 Non-Viral Transfection Systems Market: Distribution by Key Geographical Regions, Till 2035 (USD Million)
- Figure 15.6 Non-Viral Transfection Systems Market in North America, Till 2035 (USD Million)
- Figure 15.7 Non-Viral Transfection Systems Market in North America for Pharmaceutical Companies, Till 2035 (USD Million)
- Figure 15.8 Non-Viral Transfection Systems Market in North America for Academic and Research Institutions, Till 2035 (USD Million)
- Figure 15.9 Non-Viral Transfection Systems Market in North America for Other End-Users, Till 2035 (USD Million)
- Figure 15.10 Non-Viral Transfection Systems Market in North America for Research Applications, Till 2035 (USD Million)
- Figure 15.11 Non-Viral Transfection Systems Market in North America for Clinical Applications, Till 2035 (USD Million)
- Figure 15.12 Non-Viral Transfection Systems Market in Europe, Till 2035 (USD Million)
- Figure 15.13 Non-Viral Transfection Systems Market in Europe for Pharmaceutical Companies, Till 2035 (USD Million)
- Figure 15.14 Non-Viral Transfection Systems Market in Europe for Academic and Research Institutions, Till 2035 (USD Million)
- Figure 15.15 Non-Viral Transfection Systems Market in Europe for Other End-Users, Till 2035 (USD Million)
- Figure 15.16 Non-Viral Transfection Systems Market in Europe for Research Applications, Till 2035 (USD Million)
- Figure 15.17 Non-Viral Transfection Systems Market in Europe for Clinical Applications, Till 2035 (USD Million)
- Figure 15.18 Non-Viral Transfection Systems Market in Asia-Pacific, Till 2035 (USD Million)
- Figure 15.19 Non-Viral Transfection Systems Market in Asia-Pacific for Pharmaceutical Companies, Till 2035 (USD Million)
- Figure 15.20 Non-Viral Transfection Systems Market in Asia-Pacific for Academic and Research Institutions, Till 2035 (USD Million)
- Figure 15.21 Non-Viral Transfection Systems Market in Asia-Pacific for Other End-Users, Till 2035 (USD Million)
- Figure 15.22 Non-Viral Transfection Systems Market in Asia-Pacific for Research Applications, Till 2035 (USD Million)
- Figure 15.23 Non-Viral Transfection Systems Market in Asia-Pacific for Clinical Applications, Till 2035 (USD Million)
- Figure 15.24 Non-Viral Transfection Systems Market in Rest of the World, Till 2035 (USD Million)
- Figure 15.25 Non-Viral Transfection Systems Market in Rest of the World for Pharmaceutical Companies, Till 2035 (USD Million)
- Figure 15.26 Non-Viral Transfection Systems Market in Rest of the World for Academic and Research Institutions, Till 2035 (USD Million)
- Figure 15.27 Non-Viral Transfection Systems Market in Rest of the World for Other End-Users, Till 2035 (USD Million)
- Figure 15.28 Non-Viral Transfection Systems Market in Rest of the World for Research Applications, Till 2035 (USD Million)
- Figure 15.29 Non-Viral Transfection Systems Market in Rest of the World for Clinical Applications, Till 2035 (USD Million)
- Figure 17.1. Conclusion: Current Landscape of Non-Viral Transfection Reagents
- Figure 17.2 Conclusion: Current Landscape of Electroporation-based Non-Viral Transfection Systems
- Figure 17.3 Conclusion: Current Landscape of Other Non-Viral Transfection Systems
- Figure 17.4 Conclusion: Big Pharma Initiatives
- Figure 17.5 Conclusion: Patent Analysis
- Figure 17.6 Conclusion: Publication Analysis
- Figure 17.7 Conclusion: Market Forecast and Opportunity Analysis

