
PUBLISHER: Roots Analysis | PRODUCT CODE: 1771289

PUBLISHER: Roots Analysis | PRODUCT CODE: 1771289
Complement Inhibitors Market: Industry Trends and Global Forecasts - Distribution by Target Disease Indication, Therapeutic Area, Type of Molecule, Target Pathway, Type of Therapy, Route of Administration, Key Geographical Regions
GLOBAL COMPLEMENT INHIBITORS MARKET: OVERVIEW
As per Roots Analysis, the global complement inhibitors market is estimated to grow from USD 9.1 billion in the current year to USD 7.8 billion by 2035, at a CAGR of 15% during the forecast period, till 2035.
The market sizing and opportunity analysis has been segmented across the following parameters:
Target Disease Indication
- Atypical Hemolytic Uremic Syndrome
- Cardiac Transplantation Rejection
- Cold Agglutinin Disease
- COVID-19
- Generalized Myasthenia Gravis
- Guillain-Barre Syndrome
- Hereditary Angioedema
- Neuromyelitis Optica
- Paroxysmal Nocturnal Hemoglobinuria
Therapeutic Area
- Cardiovascular Disorders
- Genetic Disorders
- Hematological and Vascular Disorders
- Infectious Diseases
- Neurological Disorders
- Neuromuscular Disorders
Type of Molecule
- Biologic
- Small Molecule
Target Pathway
- Alternate Pathway
- Classical Pathway
- Lectin Pathway
- Terminal Pathway
Type of Therapy
- Monotherapy
- Combination Therapy
Route of Administration
- Intravenous
- Oral
- Subcutaneous
Key Geographical Regions
- North America
- Europe
- Asia-Pacific
GLOBAL COMPLEMENT INHIBITORS MARKET: GROWTH AND TRENDS
Complement system was discovered in the 19th century as a part of immune system, responsible for tissue repair and homeostasis, thereby providing first line of defense against multiple infections. This complete process is in association with a complex and highly regulated assembly of proteins which involve several soluble and surface-bound complement components, including receptors and regulators, which are primarily generated by the liver. These proteins, making the base for complement therapeutics, interact with multiple immune cells and complement the action of antibodies, which are in turn responsible for killing the infectious agents. Additionally, the complement system contributes to maintaining homeostasis in healthy organisms by facilitating the clearance of apoptotic cells and regulating cell survival. However, when complement activation is insufficient, pathogens can proliferate, and the suppression of complement regulators may occur, ultimately leading to disease. Consequently, therapeutics targeting the complement system have been developed to inhibit its activation, which helps reduce tissue inflammation and modulate the adaptive immune response to both foreign and self-antigens.
Driven by encouraging clinical research efforts, new pharmaceutical entrants, broadening of disease focus, and a rising desire to get beyond C5 with some innovative ways, the complement inhibitors market is expected to capture a significant share in the pharmaceutical market with more drug candidates getting approved and marketed over the coming decade.
GLOBAL COMPLEMENT INHIBITORS MARKET: KEY INSIGHTS
The report delves into the current state of global complement inhibitors market and identifies potential growth opportunities within industry. Some key findings from the report include:
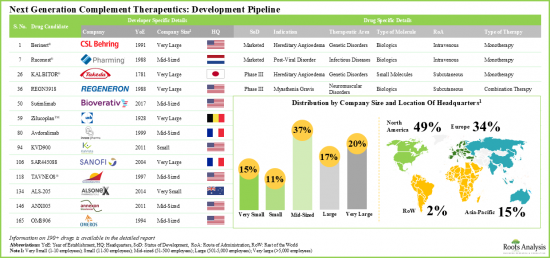
- Over 190 therapeutic candidates, targeting complement system for the treatment of multiple disease indications, are being investigated by various pharmaceutical companies across the globe.
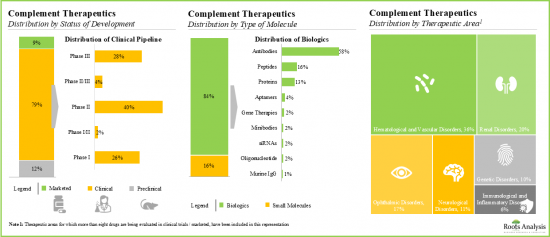
- Majority (~80%) of complement therapeutics are currently being evaluated in clinical trials; more than 75% of the pipeline candidates are biologics, specifically monoclonal antibodies.
- North America has emerged as the hub, featuring the presence of approximately 50% developers. The market is currently dominated by the presence of mid-sized players (37% of the total number of stakeholders). Interestingly, 15% of the players are big pharma companies engaged in the development of such therapeutics for multiple therapeutic areas.
- 850+ clinical trials related to complement therapeutics have been registered till date; majority (53%) of these trials were / are being conducted across various clinical sites based in Europe.
- The clinical research activity, in terms of number of trials registered, is reported to have increased at a CAGR of 21%, during the given period. Of the total number of trials registered, close to 60% have already been completed, while 24% of the studies are actively recruiting participants.
- A variety of articles focused on complement therapeutics have been published by eminent authors in high-impact journals.
- Over the years, there has been a gradual rise in the number of publications related to complement therapeutics; 1,460 research articles were published during the given time period.
- More than 40% of the articles focused on next generation complement therapeutics were published post-2019.
- Frontiers in Immunology emerged to be the most popular journal with majority of the publications focused on infectious diseases (21%) and renal disorders (16%).
- Grants worth over USD 800 million have been awarded to various organizations in order to support the ongoing research efforts for innovation of novel complement therapeutics. Around 20% of the grants were funded by the National Cancer Institute.
- The increasing number of patents being filed for complement therapeutics is indicative of the rising interest of stakeholders and extensive R&D efforts being undertaken in this field.
- Over 3,490 patents related to complement therapeutics have been filed / granted in this domain; this number can be attributed to the incessant R&D efforts being made in this domain.
- More than 60% of the patent applications have been filed for complement therapeutics by various industry players; examples include AbbVie and Alexion Pharmaceuticals.
- Only 4% of the patents have a significantly higher relative valuation; this is primarily because of the low number of citations of the patents filed recently.
- Maximum, over 45% of the partnerships were signed for product development and commercialization purposes. Further, majority of the agreements were signed by players based in North America (66%).
- Several investors, having realized the opportunity within this segment, have collectively invested a sum of ~USD 14.2 billion, across 74 funding instances.
- Around 40% of the companies engaged in this domain primarily received funding through secondary offerings. Further, 70% of the funding instances were reported by players headquartered in North America.
- Big pharma players have undertaken a variety of initiatives, ranging from proprietary product development to strategic investments.
- With a promising development pipeline and encouraging clinical research outcomes, the complement therapeutics market is anticipated to grow at an annualized rate of more than 15%, over the next decade.
- The opportunity is likely to be well distributed across various target pathways, types of therapies, routes of administration and key geographical regions.
Example Players in the Complement Inhibitors Market
- Amgen
- CSL Behring
- Innovent Biologics
- Novartis
- Regeneron
- Roche
- Sanofi
- Takeda
- UCB
PRIMARY RESEARCH OVERVIEW
The opinions and insights presented in this study were influenced by discussions conducted with multiple stakeholders. The research report features detailed transcripts of interviews conducted with the following industry stakeholders:
- Physician, Company A
- Hematologist Oncologist, Company B
- Senior Scientific Consultant, Company C
- Nephrology Clinician-Scientist, Company D
- Professor of Nephrology, Company E
GLOBAL COMPLEMENT INHIBITORS MARKET: RESEARCH COVERAGE
- Market Sizing and Opportunity Analysis: The report features an in-depth analysis of the global complement inhibitors market, focusing on key market segments, including [A] target disease indication, [B] therapeutic area, [C] type of molecule, [D] target pathway, [E] type of therapy, [F] route of administration and [G] key geographical regions.
- Market Landscape: A comprehensive evaluation of next generation complement therapeutics, considering various parameters, such as [A] status of development, [B] type of molecule, [C] type of drug, [D] biological target, [E] target pathway, [F] mechanism of action, [G] target disease indication(s), [H] therapeutic area(s), [I] route of administration, [J] type of therapy and [K] dosing frequency. Additionally, the section includes a comprehensive evaluation of players developing next generation complement therapeutics based on parameters, such as [A] year of establishment, [B] company size and [D] location of headquarters.
- Company Profiles: In-depth profiles of companies engaged in the development of next generation complement therapeutics, focusing on [A] company overview, [B] financial information (if available), [C] product portfolio and [D] recent developments and an informed future outlook.
- Clinical Trial Analysis: A comprehensive analysis of clinical studies of various next generation complement therapeutics, examining factors, such as [A] current trial status, [B] trial registration year, [C] trial phase, [D] enrolled patient population, [E] type of sponsor / collaborator, [F] type of study, [G] study design, [H] leading industry and non-industry players, [I] key indication(s), [J] popular therapeutics area(s), [K] type of treatment, [L] type of drug, [M] emerging focus areas and [N] regional distribution of trials.
- Publication Analysis: An insightful analysis of more than 1,450 peer-reviewed, scientific articles related to research on next generation complement therapeutics, based on various relevant parameters, such as [A] year of publication, [B] emerging focus areas, [C] top authors, [D] key research journals, [E] popular indication(s) and [F] therapeutic area(s).
- Grant Analysis: A detailed analysis of grants awarded to various research institutes for the projects related to next generation complement therapeutics, based on various relevant parameters, such as [A] year of grant awarded, [B] amount awarded, [C] funding institute center, [D] support period, [E] type of grant, [F] activity code while highlighting popular recipient organizations, [F] popular NIH departments, [G] study section, [H] type of recipient organization, [I] emerging focus areas of the grants, [J] purpose of grant awarded, [K] prominent program officers and [L] location of recipient organizations.
- Patent Analysis: An insightful analysis of patents filed / granted for next generation complement therapeutics, based on various relevant parameters, such as [A] patent publication year, [B] type of patent, [C] geographical location, [D] CPC symbols, [E] type of applicant, [F] patent age, [G] emerging focus areas, [H] leading industry and non-industry players (in terms of number of patents granted / filed), [I] patent characteristics, [J] patent benchmarking and [K] patent valuation.
- Partnerships and Collaborations: A comprehensive analysis of deals inked by stakeholders in this domain, based on several relevant parameters, such as [A] year of partnership, [B] type of partnership, [C] biological target, [D] target pathway, [E] emerging focus area, [F] type of partner, [G] popular disease indication, [H] therapeutic area and [I] geographical distribution of partnership activity.
- Funding and Investments: An in-depth analysis of the fundings raised by companies engaged in complement inhibitors market, based on relevant parameters, such as [A] year of funding, [B] amount invested, [C] type of funding, [D] geographical analysis, [E] most active players and [F] most active investors.
- Big Pharma Players: A comprehensive analysis of big pharma players engaged in the field of complement inhibitors market, based on several relevant parameters, such as [A] number of therapeutics under development, [B] type of molecule, [C] status of development, [D] number of therapeutic areas, [E] number of partnerships, [F] number of patents and [G] years of experience.
KEY QUESTIONS ANSWERED IN THIS REPORT
- How many companies are currently engaged in this market?
- Which are the leading companies in this market?
- What factors are likely to influence the evolution of this market?
- What is the current and future market size?
- What is the CAGR of this market?
- How is the current and future market opportunity likely to be distributed across key market segments?
REASONS TO BUY THIS REPORT
- The report provides a comprehensive market analysis, offering detailed revenue projections of the overall market and its specific sub-segments. This information is valuable to both established market leaders and emerging entrants.
- Stakeholders can leverage the report to gain a deeper understanding of the competitive dynamics within the market. By analyzing the competitive landscape, businesses can make informed decisions to optimize their market positioning and develop effective go-to-market strategies.
- The report offers stakeholders a comprehensive overview of the market, including key drivers, barriers, opportunities, and challenges. This information empowers stakeholders to stay abreast of market trends and make data-driven decisions to capitalize on growth prospects.
ADDITIONAL BENEFITS
- Complimentary Excel Data Packs for all Analytical Modules in the Report
- 15% Free Content Customization
- Detailed Report Walkthrough Session with Research Team
- Free Updated report if the report is 6-12 months old or older
TABLE OF CONTENTS
1. PREFACE
- 1.1. Scope of the Report
- 1.2. Research Methodology
- 1.2.1. Research Assumptions
- 1.2.2. Project Methodology
- 1.2.3. Forecast Methodology
- 1.2.4. Robust Quality Control
- 1.2.5. Key Considerations
- 1.2.5.1. Demographics
- 1.2.5.2. Economic Factors
- 1.2.5.3. Government Regulations
- 1.2.5.4. Supply Chain
- 1.2.5.5. COVID Impact / Related Factors
- 1.2.5.6. Market Access
- 1.2.5.7. Healthcare Policies
- 1.2.5.8. Industry Consolidation
- 1.3 Key Questions Answered
- 1.4. Chapter Outlines
2. EXECUTIVE SUMMARY
3. INTRODUCTION
- 3.1. Overview of Complement System
- 3.2. Immune Cells Involved in Complement System
- 3.3. Characteristics of Complement System
- 3.4. Functions of Complement System
- 3.5. Role of Complement in Homeostasis and Stress Conditions
- 3.6. Activation of Complement System
- 3.6.1. Steps in Complement Activation
- 3.7. Sources of Key Complement Proteins
- 3.8. Functions of Complement Proteins of Classical Pathway
- 3.9. Pathways of Complement System
- 3.9.1. Classical Pathway
- 3.9.2. Lectin Pathway
- 3.9.3. Alternative Pathway
- 3.9.4. Terminal Pathway
- 3.10. Consequences of a Dysregulated Complement System
- 3.11. Diseases related to Defects in Complement Proteins
- 3.12. Types of Complement Therapeutics
- 3.13. Limitations of Complement Therapeutics
- 3.14. Future of Next Generation Complement Therapeutics
4. NEXT GENERATION COMPLEMENT THERAPEUTICS: MARKET LANDSCAPE
- 4.1. Analysis Methodology and Key Parameters
- 4.2. Next Generation Complement Therapeutics: Development Pipeline
- 4.2.1. Analysis by Status of Development
- 4.2.2. Analysis by Type of Molecule
- 4.2.3. Analysis by Status of Development and Type of Molecule
- 4.2.4. Analysis by Type of Drug
- 4.2.5. Analysis by Biological Target
- 4.2.6. Analysis by Target Pathway
- 4.2.7. Analysis by Mechanism of Action
- 4.2.8. Analysis by Mechanism of Action and Target Pathway
- 4.2.9. Analysis by Target Disease Indication(s)
- 4.2.10. Analysis by Status of Development and Target Disease Indication(s)
- 4.2.11. Analysis by Therapeutic Area
- 4.2.12. Analysis by Therapeutic Area and Type of Molecule
- 4.2.13. Analysis by Route of Administration
- 4.2.14. Analysis by Type of Therapy
- 4.2.15. Analysis by Dosing Frequency
- 4.2.16. Grid Analysis: Type of Therapy, Type of Molecule, Route of Administration and Mechanism of Action
- 4.3. Next Generation Complement Therapeutics: List of Drugs with Special Designations
- 4.3.1. Analysis by Special Designation
- 4.4. Next Generation Complement Therapeutics: Developer Landscape
- 4.4.1. Analysis by Year of Establishment
- 4.4.2. Analysis by Company Size
- 4.4.3. Analysis by Region of Headquarters
- 4.4.4. Analysis by Company Size and Region of Headquarters
- 4.4.5. Leading Players: Analysis by Number of Therapeutics
5. COMPANY PROFILES
- 5.1. Amgen
- 5.1.1. Company Overview
- 5.1.2. Financial Information
- 5.1.3. Product Portfolio
- 5.1.4. Recent Developments and Future Outlook
- 5.2. CSL Behring
- 5.2.1. Company Overview
- 5.2.2. Financial Information
- 5.2.3. Product Portfolio
- 5.2.4. Recent Developments and Future Outlook
- 5.3. Innovent Biologics
- 5.3.1. Company Overview
- 5.3.2. Financial Information
- 5.3.3. Product Portfolio
- 5.3.4. Recent Developments and Future Outlook
- 5.4. Novartis
- 5.4.1. Company Overview
- 5.4.2. Financial Information
- 5.4.3. Product Portfolio
- 5.4.4. Recent Developments and Future Outlook
- 5.5. Regeneron
- 5.5.1. Company Overview
- 5.5.2. Financial Information
- 5.5.3. Product Portfolio
- 5.5.4. Recent Developments and Future Outlook
- 5.6. Roche
- 5.6.1. Company Overview
- 5.6.2. Financial Information
- 5.6.3. Product Portfolio
- 5.6.4. Recent Developments and Future Outlook
- 5.7. Sanofi
- 5.7.1. Company Overview
- 5.7.2. Financial Information
- 5.7.3. Product Portfolio
- 5.7.4. Recent Developments and Future Outlook
- 5.8. Takeda
- 5.8.1. Company Overview
- 5.8.2. Financial Information
- 5.8.3. Product Portfolio
- 5.8.4. Recent Developments and Future Outlook
- 5.9. UCB
- 5.9.1. Company Overview
- 5.9.2. Financial Information
- 5.9.3. Product Portfolio
- 5.9.4. Recent Developments and Future Outlook
6. CLINICAL TRIAL ANALYSIS
- 6.1. Analysis Methodology and Key Parameters
- 6.2. Next Generation Complement Therapeutics: List of Clinical Trials
- 6.2.1. Analysis by Trial Status
- 6.2.2. Cumulative Analysis by Trial Registration Year
- 6.2.3. Analysis by Trial Registration Year and Status
- 6.2.4. Analysis by Trial Phase
- 6.2.5. Analysis by Trial Phase and Patients Enrolled
- 6.2.6. Analysis by Trial Registration Year and Patients Enrolled
- 6.2.7. Analysis by Type of Sponsor / Collaborator
- 6.2.8. Analysis by Type of Study
- 6.2.9. Analysis by Study Design
- 6.2.10. Most Active Industry Players: Analysis by Number of Trials
- 6.2.11. Most Active Non-Industry Players: Analysis by Number of Trials
- 6.2.12. Analysis by Disease Indication
- 6.2.13. Most Popular Therapeutic Areas: Analysis by Number of Trials
- 6.2.14. Analysis by Type of Treatment
- 6.2.15. Analysis by Type of Drug
- 6.2.16. Word Cloud Analysis: Emerging Focus Areas
- 6.2.17. Analysis by Top Indications and Phase of the Trial
- 6.2.18. Analysis by Top Indications and Leading Industry Players
- 6.2.19. Analysis by Trial Location
- 6.2.20. Analysis by Geography and Trial Status
7. PUBLICATION ANALYSIS
- 7.1. Analysis Methodology and Key Parameters
- 7.2. Next Generation Complement Therapeutics: List of Publications
- 7.2.1. Analysis by Year of Publication
- 7.2.2. Word Cloud Analysis: Emerging Focus Areas
- 7.2.3. Top Authors: Analysis by Number of Publications
- 7.2.4. Key Journals based on Number of Publications
- 7.2.5. Key Journals based on Impact Factor
- 7.2.6. Popular Indications based on Number of Publications
- 7.2.7. Popular Therapeutic Areas based on Number of Publications
8. GRANT ANALYSIS
- 8.1. Analysis Methodology and Key Parameters
- 8.1.1. Analysis by Year of Grants Awarded
- 8.1.2. Analysis by Amount Awarded
- 8.1.3. Analysis by Funding Institute Center
- 8.1.4. Analysis by Support Period
- 8.1.5. Analysis by Funding Institute Center and Support Period
- 8.1.6. Analysis by Type of Grant
- 8.1.7. Analysis by Activity Code
- 8.1.8. Popular Recipient Organizations: Analysis by Number of Grants
- 8.1.9. Popular Recipient Organizations: Analysis by Amount Awarded
- 8.1.10. Popular NIH Departments: Analysis by Number of Grants
- 8.1.11. Analysis by Study Section
- 8.1.12. Analysis by Type of Recipient Organization
- 8.1.13. Word Cloud Analysis: Emerging Focus Areas
- 8.1.14. Analysis by Purpose of Grant
- 8.1.15. Prominent Program Officers: Analysis by Number of Grants
- 8.1.16. Analysis by Location of Recipient Organizations
9. PATENT ANALYSIS
- 9.1. Analysis Methodology and Key Parameters
- 9.2. Next Generation Complement Therapeutics: List of Patents
- 9.2.1. Analysis by Patent Publication Year
- 9.2.2. Analysis of Year-wise Granted Patents
- 9.2.3. Analysis by Type of Patent
- 9.2.4. Analysis by Granted Patents and Patent Applications
- 9.2.5. Analysis by Geography
- 9.2.6. Analysis by CPC Symbols
- 9.2.7. Analysis by Type of Applicant
- 9.2.8. Analysis of Patents by Age
- 9.2.9. Word Cloud Analysis: Emerging Focus Areas
- 9.2.10. Leading Industry Players: Analysis by Number of Patents
- 9.2.11. Leading Non-Industry Players: Analysis by Number of Patents
- 9.2.12. Leading Individual Assignees: Analysis by Number of Patents
- 9.2.13. Leading Players: Benchmarking by Patent Characteristics (CPC Symbols)
- 9.2.14. Patent Valuation: Analysis Methodology and Parameters
- 9.2.15. Patent Valuation: Analysis by Relative Valuation
10. PARTNERSHIPS AND COLLABORATIONS
- 10.1. Next Generation Complement Therapeutics: List of Partnerships and Collaborations
- 10.1.1. Analysis by Year-wise Trend of Partnership
- 10.1.2. Analysis by Type of Partnership
- 10.1.3. Analysis by Year and Type of Partnership
- 10.1.4. Most Popular Drug: Analysis by Number of Partnerships
- 10.1.5. Analysis by Biological Target
- 10.1.6. Analysis by Target Pathway
- 10.1.7. Word Cloud Analysis: Emerging Focus Areas
- 10.1.8. Analysis by Drug and Type of Partnership
- 10.1.9. Analysis by Type of Partner
- 10.1.10. Analysis by Popular Disease Indication
- 10.1.11. Analysis by Popular Disease Indication and Type of Partnership
- 10.1.12. Analysis by Therapeutic Area
- 10.1.13. Analysis by Therapeutic Area and Type of Partnership
- 10.1.14. Regional Analysis of Partnerships
- 10.1.15. Intercontinental and Intracontinental Agreements
11. FUNDING AND INVESTMENT ANALYSIS
- 11.1. Next Generation Complement Therapeutics: List of Funding and Investments
- 11.1.1. Cumulative Year-wise Trend
- 11.1.2. Analysis by Amount Invested per Year
- 11.1.3. Analysis by Type of Funding and Year of Establishment
- 11.1.4. Analysis of Instances by Type of Funding
- 11.1.5. Analysis of Amount Invested by Type of Funding
- 11.1.6. Analysis by Year, Type of Funding and Amount Invested
- 11.1.7. Most Active Investors: Analysis by Number of Instances
- 11.1.8. Most Active Players: Analysis by Number of Funding Instances
- 11.1.9. Most Active Players: Analysis by Amount Raised
- 11.1.10. Analysis of Amount by Drug
- 11.1.11. Analysis of Number of Instances by Drug
- 11.1.12. Summary of Investments
12. BIG PHARMA PLAYERS
- 12.1. Analysis Methodology and Key Parameters
- 12.2. Scoring of Parameters
- 12.3. Big Pharma Players: Information on Revenues Generated
- 12.3.1. Analysis by Supplier Strength
- 12.3.2. Analysis by Portfolio Strength
- 12.3.3. Analysis by Portfolio Diversity
- 12.3.4. Benchmarking: Spider Web Analysis
- 12.3.5. Benchmarking: Harvey Ball Analysis
- 12.3.6. Benchmarking: Wind Rose Chart
13. MARKET SIZING AND OPPORTUNITY ANALYSIS
- 13.1. Forecast Methodology and Key Parameters
- 13.2. Global Next Generation Complement Therapeutics Market, Till 2035
- 13.3. Global Next Generation Complement Therapeutics Market for Marketed Drugs, Till 2035
- 13.3.1. Next Generation Complement Therapeutics Market for Marketed Drugs, Till 2035: Distribution by Target Disease Indication
- 13.3.1.1. Next Generation Complement Therapeutics Market for Paroxysmal Nocturnal Hemoglobinuria, Till 2035
- 13.3.1.2. Next Generation Complement Therapeutics Market for Hereditary Angioedema, Till 2035
- 13.3.2. Next Generation Complement Therapeutics Market for Marketed Drugs, Till 2035: Distribution by Type of Molecule
- 13.3.2.1. Next Generation Complement Therapeutics Market for Biologics, Till 2035
- 13.3.2.2. Next Generation Complement Therapeutics Market for Small Molecules, Till 2035
- 13.3.3. Next Generation Complement Therapeutics Market for Marketed Drugs, Till 2035: Distribution by Target Pathway
- 13.3.3.1. Next Generation Complement Therapeutics Market for Terminal Pathway, Till 2035
- 13.3.3.2. Next Generation Complement Therapeutics Market for Classical Pathway, Till 2035
- 13.3.3.3. Next Generation Complement Therapeutics Market for Alternate Pathway, Till 2035
- 13.3.3.4. Next Generation Complement Therapeutics Market for Lectin Pathway, Till 2035
- 13.3.4. Next Generation Complement Therapeutics Market for Marketed Drugs, Till 2035: Distribution by Type of Therapy
- 13.3.4.1. Next Generation Complement Therapeutics Market for Monotherapy, Till 2035
- 13.3.4.2. Next Generation Complement Therapeutics Market for Combination Therapy, Till 2035
- 13.3.5. Next Generation Complement Therapeutics Market for Marketed Drugs, Till 2035: Distribution by Route of Administration
- 13.3.5.1. Next Generation Complement Therapeutics Market for Intravenous Drugs, Till 2035
- 13.3.5.2. Next Generation Complement Therapeutics Market for Subcutaneous Drugs, Till 2035
- 13.3.5.3. Next Generation Complement Therapeutics Market for Oral Drugs, Till 2035
- 13.3.1. Next Generation Complement Therapeutics Market for Marketed Drugs, Till 2035: Distribution by Target Disease Indication
- 13.4. Product-wise Sales Forecast for Marketed Drugs
- 13.4.1. Berinert (CSL Behring)
- 13.4.1.1. Sales Forecast (USD Billion)
- 13.4.2. EMPAVELI (Apellis Pharmaceuticals)
- 13.4.2.1. Sales Forecast (USD Billion)
- 13.4.3. ORLADEYO (BioCryst Pharmaceuticals)
- 13.4.3.1. Sales Forecast (USD Billion)
- 13.4.4. Ruconest (Pharming)
- 13.4.4.1. Sales Forecast (USD Billion)
- 13.4.5. Soliris (Alexion Pharmaceuticals)
- 13.4.5.1. Sales Forecast (USD Billion)
- 13.4.6. Takhzyro (Takeda)
- 13.4.6.1. Sales Forecast (USD Billion)
- 13.4.7. Ultomiris (Alexion Pharmaceuticals)
- 13.4.7.1. Sales Forecast (USD Billion)
- 13.4.1. Berinert (CSL Behring)
- 13.5. Global Next Generation Complement Therapeutics Market for Phase III Drugs, Till 2035
- 13.5.1. Next Generation Complement Therapeutics Market for Phase III Drugs, Till 2035: Distribution by Target Disease Indication
- 13.5.1.1. Next Generation Complement Therapeutics Market for Atypical Hemolytic Uremic Syndrome, Till 2035
- 13.5.1.2. Next Generation Complement Therapeutics Market for Cardiac Transplantation Rejection, Till 2035
- 13.5.1.3. Next Generation Complement Therapeutics Market for Cold Agglutinin Disease, Till 2035
- 13.5.1.4. Next Generation Complement Therapeutics Market for COVID-19, Till 2035
- 13.5.1.5. Next Generation Complement Therapeutics Market for Guillain-Barre Syndrome, Till 2035
- 13.5.1.6. Next Generation Complement Therapeutics Market for Generalized Myasthenia Gravis, Till 2035
- 13.5.1.7. Next Generation Complement Therapeutics Market for Neuromyelitis Optica, Till 2035
- 13.5.1.8. Next Generation Complement Therapeutics Market for Paroxysmal Nocturnal Hemoglobinuria, Till 2035
- 13.5.2. Next Generation Complement Therapeutics Market for Phase III Drugs, Till 2035: Distribution by Therapeutic Area
- 13.5.2.1. Next Generation Complement Therapeutics Market for Cardiovascular Disorders, Till 2035
- 13.5.2.2. Next Generation Complement Therapeutics Market for Hematological and Vascular Disorders, Till 2035
- 13.5.2.3. Next Generation Complement Therapeutics Market for Infectious Diseases, Till 2035
- 13.5.2.4. Next Generation Complement Therapeutics Market for Neurological Disorders, Till 2035
- 13.5.2.5. Next Generation Complement Therapeutics Market for Neuromuscular Disorders, Till 2035
- 13.5.2.6. Next Generation Complement Therapeutics Market for Genetic Disorders, Till 2035
- 13.5.3. Next Generation Complement Therapeutics Market for Phase III Drugs, Till 2035: Distribution by Target Pathway
- 13.5.3.1. Next Generation Complement Therapeutics Market for Terminal Pathway, Till 2035
- 13.5.3.2. Next Generation Complement Therapeutics Market for Lectin Pathway, Till 2035
- 13.5.3.3. Next Generation Complement Therapeutics Market for Classical Pathway, Till 2035
- 13.5.4. Next Generation Complement Therapeutics Market for Phase III Drugs, Till 2035: Distribution by Type of Therapy
- 13.5.4.1. Next Generation Complement Therapeutics Market for Monotherapy, Till 2035
- 13.5.4.2. Next Generation Complement Therapeutics Market for Combination Therapy, Till 2035
- 13.5.5. Next Generation Complement Therapeutics Market for Phase III Drugs, Till 2035: Distribution by Route of Administration
- 13.5.5.1. Next Generation Complement Therapeutics Market for Intravenous Drugs, Till 2035
- 13.5.5.2. Next Generation Complement Therapeutics Market for Subcutaneous Drugs, Till 2035
- 13.5.6. Next Generation Complement Therapeutics Market for Phase III Drugs, Till 2035: Distribution by Geography
- 13.5.6.1. Next Generation Complement Therapeutics Market in North America, Till 2035
- 13.5.6.1.1. Next Generation Complement Therapeutics Market in US, Till 2035
- 13.5.6.1.2. Next Generation Complement Therapeutics Market in Canada, Till 2035
- 13.5.6.2. Next Generation Complement Therapeutics Market in Europe, Till 2035
- 13.5.6.2.1. Next Generation Complement Therapeutics Market in UK, Till 2035
- 13.5.6.2.2. Next Generation Complement Therapeutics Market in Germany, Till 2035
- 13.5.6.2.3. Next Generation Complement Therapeutics Market in France, Till 2035
- 13.5.6.2.4. Next Generation Complement Therapeutics Market in Italy, Till 2035
- 13.5.6.2.5. Next Generation Complement Therapeutics Market in Spain, Till 2035
- 13.5.6.3. Next Generation Complement Therapeutics Market in Asia Pacific, Till 2035
- 13.5.6.3.1. Next Generation Complement Therapeutics Market in Australia, Till 2035
- 13.5.6.3.2. Next Generation Complement Therapeutics Market in Japan, Till 2035
- 13.5.6.3.3. Next Generation Complement Therapeutics Market in China, Till 2035
- 13.5.6.3.4. Next Generation Complement Therapeutics Market in India, Till 2035
- 13.5.6.1. Next Generation Complement Therapeutics Market in North America, Till 2035
- 13.5.1. Next Generation Complement Therapeutics Market for Phase III Drugs, Till 2035: Distribution by Target Disease Indication
- 13.6. Product-wise Sales Forecast for Phase III Drugs
- 13.6.1. Narsoplimab (Omeros)
- 13.6.1.1. Target Patient Population
- 13.6.1.2. Sales Forecast (USD Billion)
- 13.6.1.3. Net Present Value (USD Billion)
- 13.6.1.4. Value Creation Analysis
- 13.6.2. REGN3918 (Regeneron)
- 13.6.2.1. Target Patient Population
- 13.6.2.2. Sales Forecast (USD Billion)
- 13.6.2.3. Net Present Value (USD Billion)
- 13.6.2.4. Value Creation Analysis
- 13.6.3. RG6107 (Ruconest)
- 13.6.3.1. Target Patient Population
- 13.6.3.2. Sales Forecast (USD Billion)
- 13.6.3.3. Net Present Value (USD Billion)
- 13.6.3.4. Value Creation Analysis
- 13.6.4. rVA576 (Akari Therapeutics)
- 13.6.4.1. Target Patient Population
- 13.6.4.2. Sales Forecast (USD Billion)
- 13.6.4.3. Net Present Value (USD Billion)
- 13.6.4.4. Value Creation Analysis
- 13.6.5. SAR445088 (Sanofi)
- 13.6.5.1. Target Patient Population
- 13.6.5.2. Sales Forecast (USD Billion)
- 13.6.5.3. Net Present Value (USD Billion)
- 13.6.5.4. Value Creation Analysis
- 13.6.6. Soliris (Alexion Pharmaceuticals)
- 13.6.6.1. Target Patient Population
- 13.6.6.2. Sales Forecast (USD Billion)
- 13.6.6.3. Net Present Value (USD Billion)
- 13.6.6.4. Value Creation Analysis
- 13.6.7. Sutimlimab (Bioverativ)
- 13.6.7.1. Target Patient Population
- 13.6.7.2. Sales Forecast (USD Billion)
- 13.6.7.3. Net Present Value (USD Billion)
- 13.6.7.4. Value Creation Analysis
- 13.6.8. Vilobelimab (InflaRx)
- 13.6.8.1. Target Patient Population
- 13.6.8.2. Sales Forecast (USD Billion)
- 13.6.8.3. Net Present Value (USD Billion)
- 13.6.8.4. Value Creation Analysis
- 13.6.9. Zilucoplan (UCB)
- 13.6.9.1. Target Patient Population
- 13.6.9.2. Sales Forecast (USD Billion)
- 13.6.9.3. Net Present Value (USD Billion)
- 13.6.9.4. Value Creation Analysis
- 13.6.1. Narsoplimab (Omeros)
- 13.7. Summary: Phase III Drugs
14. EXPERT OPINION
- 14.1. Company A
- 14.1.1. Overview of Organization
- 14.1.2. Expert Opinion: Physician
- 14.2. Company B
- 14.2.1. Overview of Organization
- 14.2.2. Expert Opinion: Hematologist Oncologist
- 14.3. Company C
- 14.3.1. Overview of Organization
- 14.3.2. Expert Opinion: Senior Scientific Consultant
- 14.4. Company D
- 14.4.1. Overview of Organization
- 14.4.2. Expert Opinion: Nephrology Clinician-Scientist
- 14.5. Company E
- 14.5.1. Overview of Organization
- 14.5.2. Expert Opinion: Professor of Nephrology
15. APPENDIX 1: LIST OF FIGURES AND TABLES
16. APPNEDIX 2: LIST OF COMPANIES AND ORGANIZATIONS
List of Tables
- Table 3.1 Sources of Key Complement Proteins
- Table 3.2 Functions of Complement Proteins of Classical Pathway
- Table 3.3 Diseases Related to Defects in Complement Proteins
- Table 4.1 Next Generation Complement Therapeutics: Development Pipeline
- Table 4.2 List of Drugs with Special Designations
- Table 4.3 Next Generation Complement Therapeutics: List of Developers
- Table 5.1 Amgen: Product Portfolio
- Table 5.2 Recent Developments and Future Outlook
- Table 5.3 CSL Behring: Product Portfolio
- Table 5.4 Recent Developments and Future Outlook
- Table 5.5 Innovent Biologics: Product Portfolio
- Table 5.6 Recent Developments and Future Outlook
- Table 5.7 Novartis: Product Portfolio
- Table 5.8 Recent Developments and Future Outlook
- Table 5.9 Regeneron: Product Portfolio
- Table 5.10 Recent Developments and Future Outlook
- Table 5.11 Roche: Product Portfolio
- Table 5.12 Recent Developments and Future Outlook
- Table 5.13 Sanofi: Product Portfolio
- Table 5.14 Recent Developments and Future Outlook
- Table 5.15 Takeda: Product Portfolio
- Table 5.16 Recent Developments and Future Outlook
- Table 5.17 UCB: Product Portfolio
- Table 5.18 Recent Developments and Future Outlook
- Table 6.1 Next Generation Complement Therapeutics: List of Clinical Trials
- Table 7.1 Next Generation Complement Therapeutics: List of Publications
- Table 9.1 Next Generation Complement Therapeutics: List of Patents
- Table 10.1 Next Generation Complement Therapeutics: List of Partnerships and Collaborations, Since 2014
- Table 11.1 Next Generation Complement Therapeutics: List of Funding and Investments
- Table 12.1 Big Pharma Players: Information on Revenues Generated
- Table 13.1 Next Generation Complement Therapeutics: List of Forecasted Marketed Drugs
- Table 13.2 Next Generation Complement Therapeutics: List of Forecasted Phase III Drugs
- Table 13.3 Summary: Phase III Drugs
- Table 15.1 Global Next Generation Complement Therapeutics Market, Till 2035 (USD Billion)
- Table 15.2 Global Next Generation Complement Therapeutics Market for Marketed Drugs, Till 2035 (USD Billion)
- Table 15.3 Next Generation Complement Therapeutics Market for Marketed Drugs, Till 2035 (USD Billion): Distribution by Target Disease Indication
- Table 15.4 Next Generation Complement Therapeutics Market for Paroxysmal Nocturnal Hemoglobinuria, Till 2035 (USD Billion)
- Table 15.5 Next Generation Complement Therapeutics Market for Hereditary Angioedema, Till 2035 (USD Billion)
- Table 15.6 Next Generation Complement Therapeutics Market for Marketed Drugs, Till 2035 (USD Billion): Distribution by Type of Molecule
- Table 15.7 Next Generation Complement Therapeutics Market for Biologics, Till 2035 (USD Billion)
- Table 15.8 Next Generation Complement Therapeutics Market for Small Molecules, Till 2035 (USD Billion)
- Table 15.9 Next Generation Complement Therapeutics Market for Marketed Drugs, Till 2035 (USD Billion): Distribution by Target Pathway
- Table 15.10 Next Generation Complement Therapeutics Market for Terminal Pathway, Till 2035 (USD Billion)
- Table 15.11 Next Generation Complement Therapeutics Market for Classical Pathway, Till 2035 (USD Billion)
- Table 15.12 Next Generation Complement Therapeutics Market for Alternate Pathway, Till 2035 (USD Billion)
- Table 15.15 Next Generation Complement Therapeutics Market for Lectin Pathway, Till 2035 (USD Billion)
- Table 15.14 Next Generation Complement Therapeutics Market for Marketed Drugs, Till 2035 (USD Billion): Distribution by Type of Therapy
- Table 15.15 Next Generation Complement Therapeutics Market for Monotherapy, Till 2035 (USD Billion)
- Table 15.16 Next Generation Complement Therapeutics Market for Combination Therapy, Till 2035 (USD Billion)
- Table 15.17 Next Generation Complement Therapeutics Market for Marketed Drugs, Till 2035 (USD Billion): Distribution by Route of Administration
- Table 15.18 Next Generation Complement Therapeutics Market for Intravenous Drugs, Till 2035 (USD Billion)
- Table 15.19 Next Generation Complement Therapeutics Market for Subcutaneous Drugs, Till 2035 (USD Billion)
- Table 15.20 Next Generation Complement Therapeutics Market for Oral Drugs, Till 2035 (USD Billion)
- Table 15.21 Berinert Sales Forecast, Till 2035 (USD Billion)
- Table 15.22 EMPAVELI Sales Forecast, Till 2035 (USD Billion)
- Table 15.23 ORLADEYO Sales Forecast, Till 2035 (USD Billion)
- Table 15.24 Ruconest Sales Forecast, Till 2035 (USD Billion)
- Table 15.25 Soliris Sales Forecast, Till 2035 (USD Billion)
- Table 15.26 Takhzyro Sales Forecast, Till 2035 (USD Billion)
- Table 15.27 Ultomiris Sales Forecast, Till 2035 (USD Billion)
- Table 15.28 Global Next Generation Complement Therapeutics Market for Phase III Drugs, Till 2035 (USD Billion)
- Table 15.29 Next Generation Complement Therapeutics Market for Phase III Drugs, Till 2035 (USD Billion): Distribution by Target Disease Indication
- Table 15.30 Next Generation Complement Therapeutics Market for Atypical Hemolytic Uremic Syndrome, Till 2035 (USD Billion)
- Table 15.31 Next Generation Complement Therapeutics Market for Cardiac Transplantation Rejection, Till 2035 (USD Billion)
- Table 15.32 Next Generation Complement Therapeutics Market for Cold Agglutinin Disease, Till 2035 (USD Billion)
- Table 15.33 Next Generation Complement Therapeutics Market for COVID-19, Till 2035 (USD Billion)
- Table 15.34 Next Generation Complement Therapeutics Market for Guillain-Barre Syndrome, Till 2035 (USD Billion)
- Table 15.35 Next Generation Complement Therapeutics Market for Generalized Myasthenia Gravis, Till 2035 (USD Billion)
- Table 15.36 Next Generation Complement Therapeutics Market for Neuromyelitis Optica, Till 2035 (USD Billion)
- Table 15.37 Next Generation Complement Therapeutics Market for Paroxysmal Nocturnal Hemoglobinuria, Till 2035 (USD Billion)
- Table 15.38 Next Generation Complement Therapeutics Market for Phase III Drugs, Till 2035 (USD Billion): Distribution by Therapeutic Area
- Table 15.39 Next Generation Complement Therapeutics Market for Cardiovascular Disorders, Till 2035 (USD Billion)
- Table 15.40 Next Generation Complement Therapeutics Market for Hematological and Vascular Disorders, Till 2035 (USD Billion)
- Table 15.41 Next Generation Complement Therapeutics Market for Infectious Diseases, Till 2035 (USD Billion)
- Table 15.42 Next Generation Complement Therapeutics Market for Neurological Disorders, Till 2035 (USD Billion)
- Table 15.43 Next Generation Complement Therapeutics Market for Neuromuscular Disorders, Till 2035 (USD Billion)
- Table 15.44 Next Generation Complement Therapeutics Market for Genetic Disorders, Till 2035 (USD Billion)
- Table 15.45 Next Generation Complement Therapeutics Market for Phase III Drugs, Till 2035 (USD Billion): Distribution by Target Pathway
- Table 15.46 Next Generation Complement Therapeutics Market for Terminal Pathway, Till 2035 (USD Billion)
- Table 15.47 Next Generation Complement Therapeutics Market for Lectin Pathway, Till 2035 (USD Billion)
- Table 15.48 Next Generation Complement Therapeutics Market for Classical Pathway, Till 2035 (USD Billion)
- Table 15.49 Next Generation Complement Therapeutics Market for Phase III Drugs, Till 2035 (USD Billion): Distribution by Type of Therapy
- Table 15.50 Next Generation Complement Therapeutics Market for Monotherapy, Till 2035 (USD Billion)
- Table 15.51 Next Generation Complement Therapeutics Market for Combination Therapy, Till 2035 (USD Billion)
- Table 15.52 Next Generation Complement Therapeutics Market for Phase III Drugs, Till 2035 (USD Billion): Distribution by Route of Administration
- Table 15.53 Next Generation Complement Therapeutics Market for Intravenous Drugs, Till 2035 (USD Billion)
- Table 15.54 Next Generation Complement Therapeutics Market for Subcutaneous Drugs, Till 2035 (USD Billion)
- Table 15.55 Next Generation Complement Therapeutics Market for Phase III Drugs, Till 2035 (USD Billion): Distribution by Geography
- Table 15.56 Next Generation Complement Therapeutics Market in North America, Till 2035 (USD Billion)
- Table 15.57 Next Generation Complement Therapeutics Market in US, Till 2035 (USD Billion)
- Table 15.58 Next Generation Complement Therapeutics Market in Canada, Till 2035 (USD Billion)
- Table 15.59 Next Generation Complement Therapeutics Market in Europe, Till 2035 (USD Billion)
- Table 15.60 Next Generation Complement Therapeutics Market in UK, Till 2035 (USD Billion)
- Table 15.61 Next Generation Complement Therapeutics Market in Germany, Till 2035 (USD Billion)
- Table 15.62 Next Generation Complement Therapeutics Market in France, Till 2035 (USD Billion)
- Table 15.63 Next Generation Complement Therapeutics Market in Italy, Till 2035 (USD Billion)
- Table 15.64 Next Generation Complement Therapeutics Market in Spain, Till 2035 (USD Billion)
- Table 15.65 Next Generation Complement Therapeutics Market in Asia Pacific, Till 2035 (USD Billion)
- Table 15.66 Next Generation Complement Therapeutics Market in Australia, Till 2035 (USD Billion)
- Table 15.67 Next Generation Complement Therapeutics Market in Japan, Till 2035 (USD Billion)
- Table 15.68 Next Generation Complement Therapeutics Market in China, Till 2035 (USD Billion)
- Table 15.69 Next Generation Complement Therapeutics Market in India, Till 2035 (USD Billion)
- Table 15.70 Narsoplimab: Target Patient Population
- Table 15.71 Narsoplimab Sales Forecast, Till 2035 (USD Billion)
- Table 15.72 REGN3918: Target Patient Population
- Table 15.73 REGN3918 Sales Forecast, Till 2035 (USD Billion)
- Table 15.74 RG6107: Target Patient Population
- Table 15.75 RG6107 Sales Forecast, Till 2035 (USD Billion)
- Table 15.76 rVA576: Target Patient Population
- Table 15.77 rVA576 Sales Forecast, Till 2035 (USD Billion)
- Table 15.78 SAR445088: Target Patient Population
- Table 15.79 SAR445088 Sales Forecast, Till 2035 (USD Billion)
- Table 15.80 Soliris: Target Patient Population
- Table 15.81 Soliris Sales Forecast, Till 2035 (USD Billion)
- Table 15.82 Sutimlimab: Target Patient Population
- Table 15.83 Sutimlimab Sales Forecast, Till 2035 (USD Billion)
- Table 15.84 Vilobelimab: Target Patient Population
- Table 15.85 Vilobelimab Sales Forecast, Till 2035 (USD Billion)
- Table 15.86 Zilucoplan: Target Patient Population
- Table 15.87 Zilucoplan Sales Forecast, Till 2035 (USD Billion)
List of Figures
- Figure 3.1 Immune Cells Involved in Complement System
- Figure 3.2 Role of Complement in Homeostasis and Stress Conditions
- Figure 3.3 Activation of Complement System
- Figure 3.4 Steps in Complement Activation
- Figure 3.5 Pathways of Complement System
- Figure 3.6 Consequences of a Dysregulated Complement System
- Figure 3.7 Types of Complement Therapeutics
- Figure 3.8 Limitations of Complement Therapeutics
- Figure 3.9 Future of Next Generation Complement Therapeutics
- Figure 4.1 Next Generation Complement Therapeutics: Distribution by Status of Development
- Figure 4.2 Next Generation Complement Therapeutics: Distribution by Type of Molecule
- Figure 4.3 Next Generation Complement Therapeutics: Distribution by Status of Development and Type of Molecule
- Figure 4.4 Next Generation Complement Therapeutics: Distribution by Type of Drug
- Figure 4.5 Next Generation Complement Therapeutics: Distribution by Biological Target
- Figure 4.6 Next Generation Complement Therapeutics: Distribution by Target Pathway
- Figure 4.7 Next Generation Complement Therapeutics: Distribution by Mechanism of Action
- Figure 4.8 Next Generation Complement Therapeutics: Distribution by Mechanism of Action and Target Pathway
- Figure 4.9 Next Generation Complement Therapeutics: Distribution by Target Disease Indication(s)
- Figure 4.10 Next Generation Complement Therapeutics: Distribution by Status of Development and Target Disease Indication(s)
- Figure 4.11 Next Generation Complement Therapeutics: Distribution by Therapeutic Area
- Figure 4.12 Next Generation Complement Therapeutics: Distribution by Therapeutic Area and Type of Molecule
- Figure 4.13 Next Generation Complement Therapeutics: Distribution by Route of Administration
- Figure 4.14 Next Generation Complement Therapeutics: Distribution by Type of Therapy
- Figure 4.15 Next Generation Complement Therapeutics: Distribution by Dosing Frequency
- Figure 4.16 Grid Analysis: Distribution by Type of Therapy, Type of Molecule, Route of Administration and Mechanism of Action
- Figure 4.17 Next Generation Complement Therapeutics: Distribution by Special Designation
- Figure 4.18 Next Generation Complement Therapeutics Developers: Distribution by Year of Establishment
- Figure 4.19 Next Generation Complement Therapeutics Developers: Distribution by Company Size
- Figure 4.20 Next Generation Complement Therapeutics Developers: Distribution by Region of Headquarters
- Figure 4.21 Next Generation Complement Therapeutics Developers: Distribution by Company Size and Region of Headquarters
- Figure 4.22 Leading Players: Distribution by Number of Therapeutics
- Figure 5.1 Amgen: Financial Information
- Figure 5.2 CSL Behring: Financial Information
- Figure 5.3 Innovent Biologics: Financial Information
- Figure 5.4 Novartis: Financial Information
- Figure 5.5 Regeneron: Financial Information
- Figure 5.6 Roche: Financial Information
- Figure 5.7 Sanofi: Financial Information
- Figure 5.8 Takeda: Financial Information
- Figure 5.9 UCB: Financial Information
- Figure 6.1 Clinical Trial Analysis: Distribution by Trial Status
- Figure 6.2 Clinical Trial Analysis: Cumulative Distribution by Trial Registration Year, Since Pre-2016
- Figure 6.3 Clinical Trial Analysis: Distribution by Trial Registration Year and Status, Since Pre-2001
- Figure 6.4 Clinical Trial Analysis: Distribution by Trial Phase
- Figure 6.5 Clinical Trial Analysis: Distribution by Trial Phase and Patients Enrolled
- Figure 6.6 Clinical Trial Analysis: Distribution by Trial Registration Year and Patients Enrolled
- Figure 6.7 Clinical Trial Analysis: Distribution by Type of Sponsor / Collaborator
- Figure 6.8 Clinical Trial Analysis: Distribution by Type of Study
- Figure 6.9 Clinical Trial Analysis: Distribution by Study Design
- Figure 6.10 Most Active Industry Players: Distribution by Number of Trials
- Figure 6.11 Most Active Non-Industry Players: Distribution by Number of Trials
- Figure 6.12 Clinical Trial Analysis: Distribution by Disease Indication
- Figure 6.13 Most Popular Therapeutic Areas: Distribution by Number of Trials
- Figure 6.14 Clinical Trial Analysis: Distribution by Type of Treatment
- Figure 6.15 Clinical Trial Analysis: Distribution by Type of Drug
- Figure 6.16 Word Cloud Analysis: Emerging Focus Areas
- Figure 6.17 Clinical Trial Analysis: Distribution by Top Indications and Phase of the Trial
- Figure 6.18 Clinical Trial Analysis: Distribution by Top Indications and Leading Industry Players
- Figure 6.19 Clinical Trial Analysis: Distribution by Trial Location
- Figure 6.20 Clinical Trial Analysis: Distribution by Geography and Trial Status
- Figure 7.1 Publication Analysis: Distribution by Year of Publication
- Figure 7.2 Word Cloud Analysis: Emerging Focus Areas
- Figure 7.3 Top Authors: Distribution by Number of Publications
- Figure 7.4 Key Journals: Distribution by Number of Publications
- Figure 7.5 Key Journals: Distribution by Impact Factor
- Figure 7.6 Popular Indications: Distribution by Number of Publications
- Figure 7.7 Popular Therapeutic Areas: Distribution by Number of Publications
- Figure 8.1 Grant Analysis: Distribution by Year of Grants Awarded
- Figure 8.2 Grant Analysis: Distribution by Amount Awarded
- Figure 8.3 Grant Analysis: Distribution by Funding Institute Center
- Figure 8.4 Grant Analysis: Distribution by Support Period
- Figure 8.5 Grant Analysis: Distribution by Funding Institute Center and Support Period
- Figure 8.6 Grant Analysis: Distribution by Type of Grant
- Figure 8.7 Grant Analysis: Distribution by Activity Code
- Figure 8.8 Popular Recipient Organizations: Distribution by Number of Grants
- Figure 8.9 Popular Recipient Organizations: Distribution by Amount Awarded
- Figure 8.10 Popular NIH Departments: Distribution by Number of Grants
- Figure 8.11 Grant Analysis: Distribution by Study Section
- Figure 8.12 Grant Analysis: Distribution by Type of Recipient Organization
- Figure 8.13 Word Cloud Analysis: Emerging Focus Areas
- Figure 8.14 Grants Analysis: Distribution by Purpose of Grant
- Figure 8.15 Prominent Program Officers: Distribution by Number of Grants
- Figure 8.16 Grant Analysis: Distribution by Location of Recipient Organizations
- Figure 9.1 Patent Analysis: Distribution by Patent Publication Year
- Figure 9.2 Patent Analysis: Year-wise Distribution of Granted Patents
- Figure 9.3 Patent Analysis: Distribution by Type of Patent
- Figure 9.4 Patent Analysis: Distribution by Granted Patents and Patent Applications
- Figure 9.5 Patent Analysis: Distribution by Geography
- Figure 9.6 Patent Analysis: Distribution by CPC Symbols
- Figure 9.7 Patent Analysis: Distribution by Type of Applicant
- Figure 9.8 Patent Analysis: Distribution of Patents by Age
- Figure 9.9 Word Cloud Analysis: Emerging Focus Areas
- Figure 9.10 Leading Industry Players: Distribution by Number of Patents
- Figure 9.11 Leading Non-Industry Players: Distribution by Number of Patents
- Figure 9.12 Leading Individual Assignees: Distribution by Number of Patents
- Figure 9.13 Leading Players: Benchmarking by Patent Characteristics (CPC Symbols)
- Figure 9.14 Patent Valuation: Distribution by Relative Valuation
- Figure 10.1 Partnerships and Collaborations: Distribution by Year-wise Trend of Partnership
- Figure 10.2 Partnerships and Collaborations: Distribution by Type of Partnership
- Figure 10.3 Partnerships and Collaborations: Distribution by Year and Type of Partnership
- Figure 10.4 Most Popular Drug: Distribution by Number of Partnerships
- Figure 10.5 Partnerships and Collaborations: Distribution by Biological Target
- Figure 10.6 Partnerships and Collaborations: Distribution by Target Pathway
- Figure 10.7 Word Cloud Analysis: Emerging Focus Areas
- Figure 10.8 Partnerships and Collaborations: Distribution by Drug and Type of Partnership
- Figure 10.9 Partnerships and Collaborations: Distribution by Type of Partner
- Figure 10.10 Partnerships and Collaborations: Distribution by Popular Disease Indication
- Figure 10.11 Partnerships and Collaborations: Distribution by Popular Disease Indication and Type of Partnership
- Figure 10.12 Partnerships and Collaborations: Distribution by Therapeutic Area
- Figure 10.13 Partnerships and Collaborations: Distribution by Therapeutic Area and Type of Partnership
- Figure 10.14 Regional Distribution of Partnerships
- Figure 10.15 Intercontinental and Intracontinental Agreements
- Figure 11.1 Funding and Investments: Cumulative Year-wise Trend
- Figure 11.2 Funding and Investments: Distribution by Amount Invested per Year
- Figure 11.3 Funding and Investments: Distribution by Type of Funding and Year of Establishment
- Figure 11.4 Funding and Investments: Distribution of Instances by Type of Funding
- Figure 11.5 Funding and Investments: Distribution of Amount Invested by Type of Funding
- Figure 11.6 Funding and Investments: Distribution by Year, Type of Funding and Amount Invested
- Figure 11.7 Most Active Investors: Distribution by Number of Instances
- Figure 11.8 Most Active Players: Distribution by Number of Funding Instances
- Figure 11.9 Most Active Players: Distribution by Amount Raised
- Figure 11.10 Funding and Investments: Distribution of Amount by Drug
- Figure 11.11 Funding and Investments: Distribution of Number of Instances by Drug
- Figure 11.12 Funding and Investments: Summary of Investments
- Figure 12.1 Distribution by Supplier Strength
- Figure 12.2 Distribution by Portfolio Strength
- Figure 12.3 Distribution by Portfolio Diversity
- Figure 12.4 Benchmarking: Spider Web Analysis
- Figure 12.5 Benchmarking: Harvey Ball Analysis
- Figure 12.6 Benchmarking: Wind Rose Chart
- Figure 13.1 Global Next Generation Complement Therapeutics Market, Till 2035 (USD Billion)
- Figure 13.2 Global Next Generation Complement Therapeutics Market for Marketed Drugs, Till 2035 (USD Billion)
- Figure 13.3 Next Generation Complement Therapeutics Market for Marketed Drugs, Till 2035 (USD Billion): Distribution by Target Disease Indication
- Figure 13.4 Next Generation Complement Therapeutics Market for Paroxysmal Nocturnal Hemoglobinuria, Till 2035 (USD Billion)
- Figure 13.5 Next Generation Complement Therapeutics Market for Hereditary Angioedema, Till 2035 (USD Billion)
- Figure 13.6 Next Generation Complement Therapeutics Market for Marketed Drugs, Till 2035 (USD Billion): Distribution by Type of Molecule
- Figure 13.7 Next Generation Complement Therapeutics Market for Biologics, Till 2035 (USD Billion)
- Figure 13.8 Next Generation Complement Therapeutics Market for Small Molecules, Till 2035 (USD Billion)
- Figure 13.9 Next Generation Complement Therapeutics Market for Marketed Drugs, Till 2035 (USD Billion): Distribution by Target Pathway
- Figure 13.10 Next Generation Complement Therapeutics Market for Terminal Pathway, Till 2035 (USD Billion)
- Figure 13.11 Next Generation Complement Therapeutics Market for Classical Pathway, Till 2035 (USD Billion)
- Figure 13.12 Next Generation Complement Therapeutics Market for Alternate Pathway, Till 2035 (USD Billion)
- Figure 13.13 Next Generation Complement Therapeutics Market for Lectin Pathway, Till 2035 (USD Billion)
- Figure 13.14 Next Generation Complement Therapeutics Market for Marketed Drugs, Till 2035 (USD Billion): Distribution by Type of Therapy
- Figure 13.15 Next Generation Complement Therapeutics Market for Monotherapy, Till 2035 (USD Billion)
- Figure 13.16 Next Generation Complement Therapeutics Market for Combination Therapy, Till 2035 (USD Billion)
- Figure 13.17 Next Generation Complement Therapeutics Market for Marketed Drugs, Till 2035 (USD Billion): Distribution by Route of Administration
- Figure 13.18 Next Generation Complement Therapeutics Market for Intravenous Drugs, Till 2035 (USD Billion)
- Figure 13.19 Next Generation Complement Therapeutics Market for Subcutaneous Drugs, Till 2035 (USD Billion)
- Figure 13.20 Next Generation Complement Therapeutics Market for Oral Drugs, Till 2035 (USD Billion)
- Figure 13.21 Berinert Sales Forecast, Till 2035 (USD Billion)
- Figure 13.22 EMPAVELI Sales Forecast, Till 2035 (USD Billion)
- Figure 13.23 ORLADEYO Sales Forecast, Till 2035 (USD Billion)
- Figure 13.24 Ruconest Sales Forecast, Till 2035 (USD Billion)
- Figure 13.25 Soliris Sales Forecast, Till 2035 (USD Billion)
- Figure 13.26 Takhzyro Sales Forecast, Till 2035 (USD Billion)
- Figure 13.27 Ultomiris Sales Forecast, Till 2035 (USD Billion)
- Figure 13.28 Global Next Generation Complement Therapeutics Market for Phase III Drugs, Till 2035 (USD Billion)
- Figure 13.29 Next Generation Complement Therapeutics Market for Phase III Drugs, Till 2035 (USD Billion): Distribution by Target Disease Indication
- Figure 13.30 Next Generation Complement Therapeutics Market for Atypical Hemolytic Uremic Syndrome, Till 2035 (USD Billion)
- Figure 13.31 Next Generation Complement Therapeutics Market for Cardiac Transplantation Rejection, Till 2035 (USD Billion)
- Figure 13.32 Next Generation Complement Therapeutics Market for Cold Agglutinin Disease, Till 2035 (USD Billion)
- Figure 13.33 Next Generation Complement Therapeutics Market for COVID-19, Till 2035 (USD Billion)
- Figure 13.34 Next Generation Complement Therapeutics Market for Guillain-Barre Syndrome, Till 2035 (USD Billion)
- Figure 13.35 Next Generation Complement Therapeutics Market for Generalized Myasthenia Gravis, Till 2035 (USD Billion)
- Figure 13.36 Next Generation Complement Therapeutics Market for Neuromyelitis Optica, Till 2035 (USD Billion)
- Figure 13.37 Next Generation Complement Therapeutics Market for Paroxysmal Nocturnal Hemoglobinuria, Till 2035 (USD Billion)
- Figure 13.38 Next Generation Complement Therapeutics Market for Phase III Drugs, Till 2035 (USD Billion): Distribution by Therapeutic Area
- Figure 13.39 Next Generation Complement Therapeutics Market for Cardiovascular Disorders, Till 2035 (USD Billion)
- Figure 13.40 Next Generation Complement Therapeutics Market for Hematological and Vascular Disorders, Till 2035 (USD Billion)
- Figure 13.41 Next Generation Complement Therapeutics Market for Infectious Diseases, Till 2035 (USD Billion)
- Figure 13.42 Next Generation Complement Therapeutics Market for Neurological Disorders, Till 2035 (USD Billion)
- Figure 13.43 Next Generation Complement Therapeutics Market for Neuromuscular Disorders, Till 2035 (USD Billion)
- Figure 13.44 Next Generation Complement Therapeutics Market for Genetic Disorders, Till 2035 (USD Billion)
- Figure 13.45 Next Generation Complement Therapeutics Market for Phase III Drugs, Till 2035 (USD Billion): Distribution by Target Pathway
- Figure 13.46 Next Generation Complement Therapeutics Market for Terminal Pathway, Till 2035 (USD Billion)
- Figure 13.47 Next Generation Complement Therapeutics Market for Lectin Pathway, Till 2035 (USD Billion)
- Figure 13.48 Next Generation Complement Therapeutics Market for Classical Pathway, Till 2035 (USD Billion)
- Figure 13.49 Next Generation Complement Therapeutics Market for Phase III Drugs, Till 2035 (USD Billion): Distribution by Type of Therapy
- Figure 13.50 Next Generation Complement Therapeutics Market for Monotherapy, Till 2035 (USD Billion)
- Figure 13.51 Next Generation Complement Therapeutics Market for Combination Therapy, Till 2035 (USD Billion)
- Figure 13.52 Next Generation Complement Therapeutics Market for Phase III Drugs, Till 2035 (USD Billion): Distribution by Route of Administration
- Figure 13.53 Next Generation Complement Therapeutics Market for Intravenous Drugs, Till 2035 (USD Billion)
- Figure 13.54 Next Generation Complement Therapeutics Market for Subcutaneous Drugs, Till 2035 (USD Billion)
- Figure 13.55 Next Generation Complement Therapeutics Market for Phase III Drugs, Till 2035 (USD Billion): Distribution by Geography
- Figure 13.56 Next Generation Complement Therapeutics Market in North America, Till 2035 (USD Billion)
- Figure 13.57 Next Generation Complement Therapeutics Market in US, Till 2035 (USD Billion)
- Figure 13.58 Next Generation Complement Therapeutics Market in Canada, Till 2035 (USD Billion)
- Figure 13.59 Next Generation Complement Therapeutics Market in Europe, Till 2035 (USD Billion)
- Figure 13.60 Next Generation Complement Therapeutics Market in UK, Till 2035 (USD Billion)
- Figure 13.61 Next Generation Complement Therapeutics Market in Germany, Till 2035 (USD Billion)
- Figure 13.62 Next Generation Complement Therapeutics Market in France, Till 2035 (USD Billion)
- Figure 13.63 Next Generation Complement Therapeutics Market in Italy, Till 2035 (USD Billion)
- Figure 13.64 Next Generation Complement Therapeutics Market in Spain, Till 2035 (USD Billion)
- Figure 13.65 Next Generation Complement Therapeutics Market in Asia Pacific, Till 2035 (USD Billion)
- Figure 13.66 Next Generation Complement Therapeutics Market in Australia, Till 2035 (USD Billion)
- Figure 13.67 Next Generation Complement Therapeutics Market in Japan, Till 2035 (USD Billion)
- Figure 13.68 Next Generation Complement Therapeutics Market in China, Till 2035 (USD Billion)
- Figure 13.69 Next Generation Complement Therapeutics Market in India, Till 2035 (USD Billion)
- Figure 13.70 Narsoplimab: Target Patient Population
- Figure 13.71 Narsoplimab Sales Forecast, Till 2035 (USD Billion)
- Figure 13.72 REGN3918: Target Patient Population
- Figure 13.73 REGN3918 Sales Forecast, Till 2035 (USD Billion)
- Figure 13.74 RG6107: Target Patient Population
- Figure 13.75 RG6107 Sales Forecast, Till 2035 (USD Billion)
- Figure 13.76 rVA576: Target Patient Population
- Figure 13.77 rVA576 Sales Forecast, Till 2035 (USD Billion)
- Figure 13.78 SAR445088: Target Patient Population
- Figure 13.79 SAR445088 Sales Forecast, Till 2035 (USD Billion)
- Figure 13.80 Soliris: Target Patient Population
- Figure 13.81 Soliris Sales Forecast, Till 2035 (USD Billion)
- Figure 13.82 Sutimlimab: Target Patient Population
- Figure 13.83 Sutimlimab Sales Forecast, Till 2035 (USD Billion)
- Figure 13.84 Vilobelimab: Target Patient Population
- Figure 13.85 Vilobelimab Sales Forecast, Till 2035 (USD Billion)
- Figure 13.86 Zilucoplan: Target Patient Population
- Figure 13.87 Zilucoplan Sales Forecast, Till 2035 (USD Billion)

