
PUBLISHER: Roots Analysis | PRODUCT CODE: 1771309

PUBLISHER: Roots Analysis | PRODUCT CODE: 1771309
Biosensors Market: Industry Trends and Global Forecasts - Distribution by Type of Biosensors, Type of End User and Key Geographical Regions
GLOBAL BIOSENSORS MARKET: OVERVIEW
As per Roots Analysis, the biosensors market is estimated to grow from USD 5.9 billion in the current year to USD 14 billion by 2035, at a CAGR of 9.0% during the forecast period, till 2035.
The market sizing and opportunity analysis has been segmented across the following parameters:
Type of Biosensor
- Optical Biosensors
- Electrochemical Biosensors
- Thermal Biosensors
- Others
Type of End User
- Academic and Research Institutes
- Industry Players
Key Geographical Regions
- North America
- Europe
- Asia-Pacific
- Middle East and North Africa
- Latin America
- Rest of the World
GLOBAL BIOSENSORS MARKET: GROWTH AND TRENDS
Over the years, the growing prevalence of high throughput screening methodologies and advanced analytical tools to identify pharmacological molecules during drug development and disease diagnosis has led to a surge in demand for biosensors. Biosensors are analytical devices that consist of biological elements like antibodies, cells, enzymes, lipids, or oligonucleotides, combined with a physical transducer. With advances in biosensor technology, such as electrochemical biosensors, optical biosensors and thermal biosensors, identifying and validating biological targets has become easier. Moreover, the real-time analysis ability of biosensors helps researchers in rapid identification of potential biological targets for drug development, ensuring high precision while eliminating the chances of errors. Owing to its significance in drug discovery, several industrial stakeholders are currently exploring the use of biosensors in screening the leading drug candidates from thousands of hits and lead optimization.
Further, it is interesting to note that implementing biosensing technologies in the drug development and discovery process is anticipated to enhance the overall R&D activities by enabling accurate screening. Over 80 biosensors are available or are being developed by several industrial stakeholders for drug development purposes. Additionally, more than USD 1.2 billion has been invested in this field by key industrial and non-industrial players within the past five years. Given the active approach undertaken by the biosensors market players in this domain, the market is anticipated to grow during the forecast period.
GLOBAL BIOSENSORS MARKET: KEY INSIGHTS
The report delves into the current state of global biosensors market and identifies potential growth opportunities within industry. Some key findings from the report include:
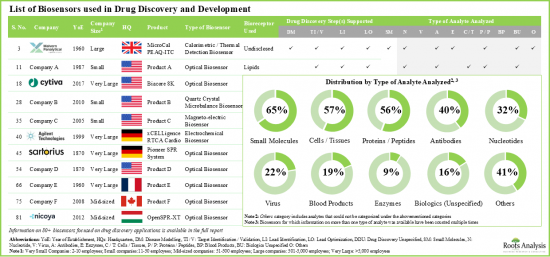
- Presently, more than 80 biosensors, focused on drug discovery applications, are being developed by various companies across the world; 65% of such biosensors are capable of analyzing small molecules.
- Nearly 65% of the available devices in this market are optical biosensors; over 90% of these biosensor technologies support the identification of new drug leads.
- More than 15% of the biosensors claim to support all the steps in drug discovery; examples of such biosensor developers include Malvern Panalytical, Invitrometrix and Nicoya Lifesciences.
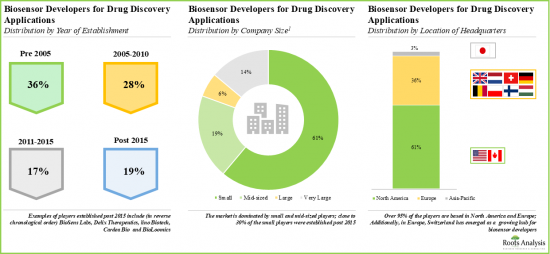
- More than 50% of the key players are based in North America; of these, around 70% of the companies are using optical and electrochemical biosensing technologies for drug discovery.
- The market landscape is dominated by small players, which were established post 2005; the US has emerged as a key hub for drug discovery focused on biosensors, featuring the presence of maximum developers.
- In pursuit of gaining a competitive edge, biosensor developers are presently undertaking initiatives to expand their existing capabilities and augment respective product portfolios.
- Over the years, players engaged in this domain have carried out a variety of initiatives to further advance the development / enable improvement of their existing biosensor technologies.
- Several investors, having realized the opportunity within this upcoming segment, have invested over USD 1.2 billion across various funding rounds in the past four years.
- There has been a steady increase in the funding activity; specifically, in 2024, industry players collectively raised close to USD 0.6 billion.
- Around USD 185 million was raised through venture rounds; of this, 83% funding was raised from venture series A.
- In North America, majority (82%) of the funding rounds were led by organizations based in the US, having invested amount worth USD 1.1 billion.
- Published scientific literature signifies the active initiatives of researchers to discover new biosensor technologies in order to cater to the evolving drug discovery and development needs.
- Over 55% of articles related to use of biosensor in drug discovery have been published in the last two years; majority (60%) of the publications were research papers.
- Various industry and non-industry players have participated in multiple global events to discuss research outcomes, affiliated challenges and opportunities associated with the use of biosensors in drug discovery.
- More than 350 patents have been granted / filed for various biosensor technologies focused on drug discovery applications, primarily by players based in North America.
- Nearly 85% of the total patents have been filed in developed regions, such as the US and Europe; Additionally, 16% of the patents have been filed in World Intellectual Property Organization (WIPO).
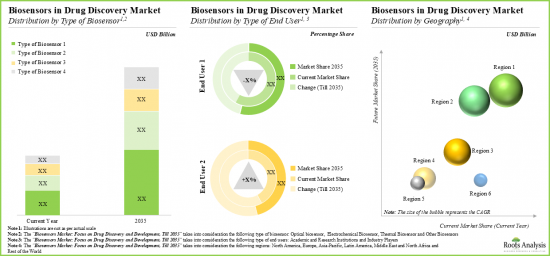
- The market for biosensors in drug discovery is expected to grow at a CAGR of 9%, till 2035; the opportunity is likely to be well-distributed across different types of biosensors, end users and geographies.
GLOBAL BIOSENSORS MARKET: KEY SEGMENTS
Optical Biosensors Segment Occupies the Largest Share of the Biosensors Market
Based on the type of biosensor, the market is segmented into optical biosensors, electrochemical biosensors, thermal biosensors and others. At present, optical biosensors segment holds the maximum (~70%) share of the global biosensors market. This trend is likely to remain same in the coming future.
By Type of End User, Industry Players is the Fastest Growing Segment of Biosensors Market
Based on the type of end user, the market is segmented into academic and research institutes and industry players. Currently, academic and research institutes segment captures the highest proportion (~60%) of the biosensors market. Further, industry players' segment is expected to grow at a higher compounded annual growth rate of 10.1% during the forecast period.
North America Accounts for the Largest Share of the Market
Based on key geographical regions, the market is segmented into North America, Europe, Asia-Pacific, Latin America, Middle East and North Africa, and the Rest of the World. Currently, North America (~40%) dominates the biosensors market and accounts for the largest revenue share. Further, the market in Europe is expected to grow at a higher CAGR in the coming years.
Example Players in the Biosensors Market
- Agilent Technologies
- Axion Biosystems
- BioNavigations
- Creoptix
- Cytiva
- Dynamic Biosensors
- Malvern Panalytical
- Microvacuum
- Sartorius
- Tempo Bioscience
PRIMARY RESEARCH OVERVIEW
The opinions and insights presented in this study were influenced by discussions conducted with multiple stakeholders. The research report features detailed transcripts of interviews conducted with the following industry stakeholders:
- Chief Executive Officer, Company A
- Chief Executive Officer, Company B
- Associate Director R&D, Head of Biology, Company C
GLOBAL BIOSENSORS MARKET: RESEARCH COVERAGE
- Market Sizing and Opportunity Analysis: The report features an in-depth analysis of the global biosensors market, focusing on key market segments, including [A] type of biosensor, [B] type of end user and [C] key geographical regions.
- Market Landscape: A comprehensive evaluation of biosensors in drug discovery, considering various parameters, such as [A] type of biosensor, [B] bioreceptor used, [C] drug discovery step(s) supported, [D] other applications, [E] type of analyte analyzed, [F] type of carrier plate format, [G] sample capacity, [H] sample volume, [I] type of detection and [J] type of system. Additionally, a comprehensive evaluation of biosensor developers based on various parameters, such as [A] year of establishment, [B] company size, [C] location of headquarters, and [D] leading players (in terms of number of biosensors developed).
- Product Competitiveness Analysis: A comprehensive competitive analysis of biosensors used for drug discovery purposes, examining factors, such as [A] supplier power and [B] product competitiveness.
- Company Profiles: In-depth profiles companies developing biosensors for drug discovery applications, focusing on [A] company overview, [B] product portfolio and [C] recent developments and an informed future outlook.
- Brand Positioning Analysis: In-depth brand positioning analysis of leading industry firms, highlighting the current perceptions regarding their proprietary brands across biosensors in drug discovery.
- Funding And Investment Analysis: A detailed analysis of investments that have been made into companies developing biosensors for drug discovery applications, based on various relevant parameters, such as [A] year of investment, [B] the amount invested, [C] type of funding, [D] most active players (in terms of the number of funding instances), and [E] type of investor.
- Publication Analysis: An insightful analysis of around 333 peer-reviewed scientific articles related to research on biosensors in drug discovery, based on various relevant parameters, such as [A] year of publication, [B] type of publication, [C] emerging focus areas, [D] most active publishers, [E] most active affiliated institutes and [F] geography.
- Global Event Analysis: An in-depth analysis of the global events attended by participants, based on various relevant parameters, such as [A] year of event, [B] type of event platform, [C] location of event, [D] emerging focus areas, [E] active organizers (in terms of number of events), [F] active industry and non-industry participants, [G] designation of participants, and [H] affiliated organizations of participant.
- Patent Analysis: An insightful analysis of various patents that have been filed / granted related to biosensors in drug discovery, based on several parameters, such as [A] publication year, [B] geographical region, [C] CPC symbols, [D] patent focus areas, [E] type of applicant, [F] detailed valuation analysis and [G] leading players (in terms of size of intellectual property portfolio).
KEY QUESTIONS ANSWERED IN THIS REPORT
- How many companies are currently engaged in this market?
- Which are the leading companies in this market?
- What factors are likely to influence the evolution of this market?
- What is the current and future market size?
- What is the CAGR of this market?
- How is the current and future market opportunity likely to be distributed across key market segments?
REASONS TO BUY THIS REPORT
- The report provides a comprehensive market analysis, offering detailed revenue projections of the overall market and its specific sub-segments. This information is valuable to both established market leaders and emerging entrants.
- Stakeholders can leverage the report to gain a deeper understanding of the competitive dynamics within the market. By analyzing the competitive landscape, businesses can make informed decisions to optimize their market positioning and develop effective go-to-market strategies.
- The report offers stakeholders a comprehensive overview of the market, including key drivers, barriers, opportunities, and challenges. This information empowers stakeholders to stay abreast of market trends and make data-driven decisions to capitalize on growth prospects.
ADDITIONAL BENEFITS
- Complimentary PPT Insights Packs
- Complimentary Excel Data Packs for all Analytical Modules in the Report
- 15% Free Content Customization
- Detailed Report Walkthrough Session with Research Team
- Free Updated report if the report is 6-12 months old or older
TABLE OF CONTENTS
1. PREFACE
- 1.1. Scope of the Report
- 1.2. Research Methodology
- 1.2.1. Research Assumptions
- 1.2.2. Project Methodology
- 1.2.3. Forecast Methodology
- 1.2.4. Robust Quality Control
- 1.2.5. Key Considerations
- 1.2.5.1. Demographics
- 1.2.5.2. Economic Factors
- 1.2.5.3. Government Regulations
- 1.2.5.4. Supply Chain
- 1.2.5.5. COVID Impact / Related Factors
- 1.2.5.6. Market Access
- 1.2.5.7. Healthcare Policies
- 1.2.5.8. Industry Consolidation
- 1.3 Key Questions Answered
- 1.4. Chapter Outlines
2. EXECUTIVE SUMMARY
3. INTRODUCTION
- 3.1. Chapter Overview
- 3.2. An Overview of Biosensors
- 3.3. Components of Biosensors
- 3.4. Types of Biosensors
- 3.5. Applications of Biosensors in Drug Discovery
- 3.6. Challenges Associated with Use of Biosensors in Drug Discovery
- 3.7. Concluding Remarks
4. MARKET LANDSCAPE
- 4.1. Chapter Overview
- 4.2. Biosensors in Drug Discovery: Overall Market Landscape
- 4.2.1. Analysis by Year of Establishment
- 4.2.2. Analysis by Company Size
- 4.2.3. Analysis by Location of Headquarters
- 4.2.4. Most Active Players: Analysis by Number of Biosensors Developed
- 4.2.5. Analysis by Type of Biosensor
- 4.2.6. Analysis by Type of Bioreceptor Used
- 4.2.7. Analysis by Type of Biosensor and Type of Bioreceptor Used
- 4.2.8. Analysis by Drug Discovery Step(s) Supported
- 4.2.9. Analysis by Other Applications Supported
- 4.2.10. Analysis by Type of Analyte
- 4.2.11. Analysis by Carrier Plate Format
- 4.2.12. Analysis by Type of Biosensor and Carrier Plate Format
- 4.2.13. Analysis by Sample Capacity
- 4.2.14. Analysis by Sample Volume
- 4.2.15. Analysis by Type of Detection Method Employed
- 4.2.16. Analysis by Type of System
5. PRODUCT COMPETITIVENESS ANALYSIS
- 5.1. Chapter Overview
- 5.2. Assumptions and Key Parameters
- 5.3. Methodology
- 5.4. Product Competitiveness Analysis: Biosensors in Drug Discovery
6. COMPANY PROFILES: BIOSENSORS DEVELOPERS FOR DRUG DISCOVERY APPLICATIONS
- 6.1. Chapter Overview
- 6.2. Agilent Technologies
- 6.2.1. Company Overview
- 6.2.2. Product Portfolio
- 6.2.3. Recent Developments and Future Outlook
- 6.3. Axion Biosystems
- 6.3.1. Company Overview
- 6.3.2. Product Portfolio
- 6.3.3. Recent Developments and Future Outlook
- 6.4. BioNavigations
- 6.4.1. Company Overview
- 6.4.2. Product Portfolio
- 6.4.3. Recent Developments and Future Outlook
- 6.5. Creoptix
- 6.5.1. Company Overview
- 6.5.2. Product Portfolio
- 6.5.3. Recent Developments and Future Outlook
- 6.6. Cytiva
- 6.6.1. Company Overview
- 6.6.2. Product Portfolio
- 6.6.3. Recent Developments and Future Outlook
- 6.7. Dynamic Biosensors
- 6.7.1. Company Overview
- 6.7.2. Product Portfolio
- 6.7.3. Recent Developments and Future Outlook
- 6.8. Malvern Panalytical
- 6.8.1. Company Overview
- 6.8.2. Product Portfolio
- 6.8.3. Recent Developments and Future Outlook
- 6.9. Microvacuum
- 6.9.1. Company Overview
- 6.9.2. Product Portfolio
- 6.9.3. Recent Developments and Future Outlook
- 6.10. Sartorius
- 6.10.1. Company Overview
- 6.10.2. Product Portfolio
- 6.10.3. Recent Developments and Future Outlook
- 6.11. Tempo Bioscience
- 6.11.1. Company Overview
- 6.11.2. Product Portfolio
- 6.11.3. Recent Developments and Future Outlook
7. BRAND POSITIONING ANALYSIS
- 7.1. Chapter Overview
- 7.2. Key Parameters
- 7.3. Methodology
- 7.4. Biosensor Developers for Drug Discovery Applications
- 7.4.1. Brand Positioning Matrix: Agilent Technologies
- 7.4.2. Brand Positioning Matrix: Cytiva
- 7.4.3. Brand Positioning Matrix: Sartorius
- 7.4.4. Brand Positioning Matrix: Malvern Panalytical
8. FUNDING AND INVESTMENT ANALYSIS
- 8.1. Chapter Overview
- 8.2. Types of Funding
- 8.3. Biosensors in Drug Discovery: Funding and Investments
- 8.3.1. Analysis of Funding Instances by Year
- 8.3.2. Analysis of Amount Invested by Year
- 8.3.3. Analysis of Funding Instances by Type of Funding
- 8.3.4. Analysis of Amount Invested by Type of Funding
- 8.3.5. Analysis of Funding Instances by Type of Biosensor
- 8.3.6. Most Active Players: Analysis by Number of Funding Instances
- 8.3.7. Most Active Players: Analysis by Amount Invested
- 8.3.8. Most Active Investors: Analysis by Number of Funding Instances
- 8.3.9. Analysis of Amount Invested by Geography
- 8.3.9.1. Analysis by Region
- 8.3.9.2. Analysis by Country
9. PUBLICATION ANALYSIS
- 9.1. Chapter Overview
- 9.2. Scope and Methodology
- 9.3. Biosensors in Drug Discovery: Publication Analysis
- 9.3.1. Analysis by Year of Publication
- 9.3.2. Analysis by Type of Publication
- 9.3.3. Most Popular Journals: Analysis by Number of Publications
- 9.3.4. Most Popular Journals: Analysis by Impact Factor
- 9.3.5. Analysis by Most Popular Keywords
- 9.3.6. Most Active Publisher: Analysis by Number of Publications
- 9.3.7. Most Active Affiliated Institutes: Analysis by Number of Publications
- 9.3.8. Analysis by Geography
10. GLOBAL EVENT ANALYSIS
- 10.1. Chapter Overview
- 10.2. Scope and Methodology
- 10.3. List of Global Events Related to Biosensors in Drug Discovery
- 10.3.1. Analysis by Year of Event
- 10.3.2. Analysis by Event Platform
- 10.3.3. Analysis by Type of Event
- 10.3.4. Analysis by Location of Event
- 10.3.5. Analysis by Evolutionary Trends in Event Agendas / Key Focus Areas
- 10.3.6. Most Active Organizers: Analysis by Number of Events
- 10.3.7. Analysis by Designation of Participants
- 10.3.8. Analysis by Affiliated Department of Participants
- 10.3.9. Analysis by Geography of Upcoming Events
11. PATENT ANALYSIS
- 11.1. Chapter Overview
- 11.2. Scope and Methodology
- 11.3. Biosensors in Drug Discovery: Patent Analysis
- 11.3.1. Analysis by Publication Year
- 11.3.2. Analysis by Geography
- 11.3.3. Analysis by CPC Symbols
- 11.3.4. Analysis by Emerging Focus Areas
- 11.3.5. Analysis by Patent Age
- 11.3.6. Analysis by Type of Applicant
- 11.3.7. Leading Industry Players: Analysis by Number of Patents
- 11.3.8. Leading Non-Industry Players: Analysis by Number of Patents
- 11.3.9. Leading Individual Assignees: Analysis by Number of Patents
- 11.4. Biosensors in Drug Discovery: Patent Valuation
- 11.5. Leading Patents: Analysis by Number of Citations
12. MARKET FORECAST AND OPPORTUNITY ANALYSIS
- 12.1. Chapter Overview
- 12.2. Forecast Methodology and Key Assumptions
- 12.3. Global Biosensors in Drug Discovery Market, Till 2035
- 12.3.1. Biosensors in Drug Discovery Market: Distribution by Type of Biosensor
- 12.3.1.1. Optical Biosensors in Drug Discovery Market, Till 2035
- 12.3.1.2. Electrochemical Biosensors in Drug Discovery Market, Till 2035
- 12.3.1.3. Thermal Biosensors in Drug Discovery Market, Till 2035
- 12.3.1.4. Other Biosensors in Drug Discovery Market, Till 2035
- 12.3.2. Biosensor in Drug Discovery Market: Distribution by Type of End User
- 12.3.2.1. Biosensor in Drug Discovery Market for Academic and Research Institutes, Till 2035
- 12.3.2.2. Biosensor in Drug Discovery Market for Industry Players, Till 2035
- 12.3.3. Biosensor in Drug Discovery Market: Distribution by Region
- 12.3.3.1. Biosensor in Drug Discovery Market in North America, Till 2035
- 12.3.3.2. Biosensor in Drug Discovery Market in Europe, Till 2035
- 12.3.3.3. Biosensor in Drug Discovery Market in Asia Pacific, Till 2035
- 12.3.3.4. Biosensor in Drug Discovery Market in Latin America, Till 2035
- 12.3.3.5. Biosensor in Drug Discovery Market in Middle East and North Africa, Till 2035
- 12.3.3.6. Biosensor in Drug Discovery Market in Rest of the World, Till 2035
- 12.3.1. Biosensors in Drug Discovery Market: Distribution by Type of Biosensor
13. CONCLUDING REMARKS
14. EXECUTIVE INSIGHTS
- 14.1. Chapter Overview
- 14.2. Company A
- 14.2.1. Company Snapshot
- 14.2.2. Interview Transcript: Chief Executive Officer
- 14.3. Company B
- 14.3.1. Company Snapshot
- 14.3.2. Interview Transcript: Chief Executive Officer
- 14.4. Company C
- 14.4.1. Company Snapshot
- 14.4.2. Interview Transcript: Associate Director R&D, Head of Biology
15. APPENDIX 1: TABULATED DATA
16. APPENDIX 2: LIST OF COMPANIES AND ORGANIZATIONS
List of Tables
- Table 4.1 Biosensors in Drug Discovery: List of Companies
- Table 4.2 Biosensors in Drug Discovery: Information on Type of Biosensor, Bioreceptor used, Drug Discovery Step(s) and Other Applications Supported
- Table 4.3 Biosensors in Drug Discovery: Information on Type of Analyte
- Table 4.4 Biosensors in Drug Discovery: Information on Carrier Plate Format, Sample Capacity, Sample Volume, Type of Detection Method Employed and Type of System
- Table 6.1 Leading Biosensor Developers
- Table 6.2 Agilent Technologies: Company Overview
- Table 6.3 Agilent Technologies: Product Portfolio
- Table 6.4 Agilent Technologies: Recent Developments and Future Outlook
- Table 6.5 Axion Biosystems: Company Overview
- Table 6.6 Axion Biosystems: Product Portfolio
- Table 6.7 BioNavigations: Company Overview
- Table 6.8 BioNavigations: Product Portfolio
- Table 6.9 Creoptix: Company Overview
- Table 6.10 Creoptix: Product Portfolio
- Table 6.11 Creoptix: Recent Developments and Future Outlook
- Table 6.12 Cytiva: Company Overview
- Table 6.13 Cytiva: Product Portfolio
- Table 6.14 Cytiva: Recent Developments and Future Outlook
- Table 6.15 Dynamic Biosensors: Company Overview
- Table 6.16 Dynamic Biosensors: Product Portfolio
- Table 6.17 Dynamic Biosensors: Recent Developments and Future Outlook
- Table 6.18 Malvern Panalytical: Company Overview
- Table 6.19 Malvern Panalytical: Product Portfolio
- Table 6.20 Malvern Panalytical: Recent Developments and Future Outlook
- Table 6.21 Microvacuum: Company Overview
- Table 6.22 Microvacuum: Product Portfolio
- Table 6.23 Sartorius: Company Overview
- Table 6.24 Sartorius: Product Portfolio
- Table 6.25 Sartorius: Recent Developments and Future Outlook
- Table 6.26 Tempo Bioscience: Company Overview
- Table 6.27 Tempo Bioscience: Product Portfolio
- Table 8.1 Biosensors in Drug Discovery: List of Funding and Investments, Since 2018
- Table 9.1 Biosensors in Drug Discovery: List of Recent Publications, Since 2018
- Table 10.1 Biosensors in Drug Discovery: List of Global Events, Since 2021
- Table 11.1 Patent Analysis: Prominent CPC Symbols
- Table 11.2 Patent Analysis: Most Popular CPC Symbols
- Table 11.3 Patent Analysis: List of Top CPC Symbols
- Table 11.4 Patent Analysis: Categorization based on Weighted Valuation Scores
- Table 11.5 Patent Portfolio: List of Leading Patents (in terms of Highest Relative Valuation)
- Table 11.6 Patent Portfolio: List of Leading Patents (in terms of Number of Citations)
- Table 14.1 Efferent Labs: Company Snapshot
- Table 14.2 Montana Molecular: Company Snapshot
- Table 14.2 Domain Therapeutics: Company Snapshot
- Table 15.1 Biosensor Developers for Drug Discovery Applications: Distribution by Year of Establishment
- Table 15.2 Biosensor Developers for Drug Discovery Applications: Distribution by Company Size
- Table 15.3 Biosensor Developers for Drug Discovery Applications: Distribution by Location of Headquarters (Region-wise)
- Table 15.4 Biosensor Developers for Drug Discovery Applications: Distribution by Location of Headquarters (Country-wise)
- Table 15.5 Biosensor Developers for Drug Discovery Applications: Distribution by Location of Headquarters and Company Size
- Table 15.6 Most Active Players: Distribution by Number of Biosensors Developed
- Table 15.7 Biosensors in Drug Discovery: Distribution by Type of Biosensor
- Table 15.8 Biosensors in Drug Discovery: Distribution by Type of Bioreceptor Used
- Table 15.9 Biosensors in Drug Discovery: Distribution by Type of Biosensor and Type of Bioreceptor Used
- Table 15.10 Biosensors in Drug Discovery: Distribution by Drug Discovery Step(s) Supported
- Table 15.11 Biosensors in Drug Discovery: Distribution by Other Applications Supported
- Table 15.12 Biosensors in Drug Discovery: Distribution by Type of Analyte
- Table 15.13 Biosensors in Drug Discovery: Distribution by Carrier Plate Format
- Table 15.14 Biosensors in Drug Discovery: Distribution by Type of Biosensor and Carrier Plate Format
- Table 15.15 Biosensors in Drug Discovery: Distribution by Sample Capacity
- Table 15.16 Biosensors in Drug Discovery: Distribution by Sample Volume
- Table 15.17 Biosensors in Drug Discovery: Distribution by Type of Detection Method Employed
- Table 15.18 Biosensors in Drug Discovery: Distribution by Type of System
- Table 15.19 Funding and Investment Analysis: Cumulative Year-wise Distribution of Funding Instances, Since 2018
- Table 15.20 Funding and Investment Analysis: Cumulative Year-wise Distribution of Amount Invested, Since 2018 (USD Million)
- Table 15.21 Funding and Investment Analysis: Distribution of Funding Instances by Type of Funding
- Table 15.22 Funding and Investment Analysis: Distribution of Amount Invested by Type of Funding (USD Million)
- Table 15.23 Funding and Investment Analysis: Distribution of Funding Instances by Type of Biosensor
- Table 15.24 Most Active Players: Distribution by Number of Funding Instances
- Table 15.25 Most Active Players: Distribution by Amount Invested (USD Million)
- Table 15.26 Most Active Investors: Distribution by Number of Funding Instances
- Table 15.27 Funding and Investment Analysis: Distribution of Amount Invested by Region (USD Million)
- Table 15.28 Funding and Investment Analysis: Distribution of Amount Invested by Country (USD Million)
- Table 15.29 Publication Analysis: Distribution by Year of Publication
- Table 15.30 Publication Analysis: Distribution by Type of Publication
- Table 15.31 Most Popular Journals: Distribution by Number of Publications
- Table 15.32 Most Popular Journals: Distribution by Impact Factor
- Table 15.33 Publication Analysis: Most Popular Keywords
- Table 15.34 Most Active Publisher: Distribution by Number of Publications
- Table 15.35 Most Active Affiliated Institutes: Distribution by Number of Publications
- Table 15.36 Publication Analysis: Distribution by Geography
- Table 15.37 Global Event Analysis: Cumulative Quarterly Trend
- Table 15.38 Global Event Analysis: Distribution by Event Platform
- Table 15.39 Global Event Analysis: Distribution by Type of Event
- Table 15.40 Global Event Analysis: Distribution by Location of Event
- Table 15.41 Most Active Organizers: Distribution by Number of Events
- Table 15.42 Global Event Analysis: Distribution by Designation of Participants
- Table 15.43 Global Event Analysis: Distribution by Affiliated Department of Participants
- Table 15.44 Global Event Analysis: Geographical Mapping of Upcoming Events
- Table 15.45 Patent Analysis: Distribution by Type of Patent
- Table 15.46 Patent Analysis: Distribution by Patent Publication Year
- Table 15.47 Patent Analysis: Distribution by Geography
- Table 15.48 Patent Analysis: Distribution by CPC Symbols
- Table 15.49 Patent Analysis: Distribution by Patents Age
- Table 15.50 Patent Analysis: Distribution by Type of Applicant
- Table 15.51 Leading Industry Players: Distribution by Number of Patents
- Table 15.52 Leading Non-Industry Players: Distribution by Number of Patents
- Table 15.53 Leading Individual Assignees: Distribution by Number of Patents
- Table 15.54 Biosensors in Drug Discovery: Patent Valuation Analysis
- Table 15.55 Global Biosensors in Drug Discovery Market, Conservative, Base and Optimistic Scenarios, Till 2035 (USD Billion)
- Table 15.56 Biosensors in Drug Discovery Market: Distribution by Type of Biosensor
- Table 15.57 Optical Biosensors in Drug Discovery Market, Conservative, Base and Optimistic Scenarios, Till 2035 (USD Billion)
- Table 15.58 Electrochemical Biosensors in Drug Discovery Market, Conservative, Base and Optimistic Scenarios, Till 2035 (USD Billion)
- Table 15.59 Thermal Biosensors in Drug Discovery Market, Conservative, Base and Optimistic Scenarios, Till 2035 (USD Billion)
- Table 15.60 Other Biosensors in Drug Discovery Market, Conservative, Base and Optimistic Scenarios, Till 2035 (USD Billion)
- Table 15.61 Biosensors in Drug Discovery Market: Distribution by Type of End User
- Table 15.62 Biosensors in Drug Discovery Market for Academic and Research Institutions, Conservative, Base and Optimistic Scenarios, Till 2035 (USD Billion)
- Table 15.63 Biosensors in Drug Discovery Market for Industry Players, Conservative, Base and Optimistic Scenarios, Till 2035 (USD Billion)
- Table 15.64 Biosensors in Drug Discovery Market: Distribution by Region
- Table 15.65 Biosensors in Drug Discovery Market in North America, Conservative, Base and Optimistic Scenarios, Till 2035 (USD Billion)
- Table 15.66 Biosensors in Drug Discovery Market in Europe, Conservative, Base and Optimistic Scenarios, Till 2035 (USD Billion)
- Table 15.67 Biosensors in Drug Discovery Market in Asia Pacific, Conservative, Base and Optimistic Scenarios, Till 2035 (USD Billion)
- Table 15.68 Biosensors in Drug Discovery Market in Latin America, Conservative, Base and Optimistic Scenarios, Till 2035 (USD Billion)
- Table 15.69 Biosensors in Drug Discovery Market in Middle East and North Africa, Conservative, Base and Optimistic Scenarios, Till 2035 (USD Billion)
- Table 15.70 Biosensors in Drug Discovery Market in Rest of the World, Conservative, Base and Optimistic Scenarios, Till 2035 (USD Billion)
List of Figures
- Figure 2.1 Executive Summary: Overall Market Landscape
- Figure 2.2 Executive Summary: Funding and Investments
- Figure 2.3 Executive Summary: Publication Analysis
- Figure 2.4 Executive Summary: Global Event Analysis
- Figure 2.5 Executive Summary: Patent Analysis
- Figure 2.6 Executive Summary: Market Forecast and Opportunity Analysis
- Figure 3.1 Components of Biosensors
- Figure 3.2 Electrochemical Biosensor
- Figure 3.3 Thermal Biosensor
- Figure 3.4 Optical Biosensor
- Figure 3.5 Piezo-electric Biosensor
- Figure 3.4 Resonant Biosensor
- Figure 4.1 Biosensor Developers for Drug Discovery Applications: Distribution by Year of Establishment
- Figure 4.2 Biosensor Developers for Drug Discovery Applications: Distribution by Company Size
- Figure 4.3 Biosensor Developers for Drug Discovery Applications: Distribution by Location of Headquarters (Region-wise)
- Figure 4.4 Biosensor Developers for Drug Discovery Applications: Distribution by Location of Headquarters (Country-wise)
- Figure 4.5 Biosensor Developers for Drug Discovery Applications: Distribution by Location of Headquarters and Company Size
- Figure 4.6 Most Active Players: Distribution by Number of Biosensors Developed
- Figure 4.7 Biosensors in Drug Discovery: Distribution by Type of Biosensor
- Figure 4.8 Biosensors in Drug Discovery: Distribution by Type of Bioreceptor Used
- Figure 4.9 Biosensors in Drug Discovery: Distribution by Type of Biosensor and Type of Bioreceptor Used
- Figure 4.10 Biosensors in Drug Discovery: Distribution by Drug Discovery Step(s) Supported
- Figure 4.11 Biosensors in Drug Discovery: Distribution by Other Applications Supported
- Figure 4.12 Biosensors in Drug Discovery: Distribution by Type of Analyte
- Figure 4.13 Biosensors in Drug Discovery: Distribution by Carrier Plate Format
- Figure 4.14 Biosensors in Drug Discovery: Distribution by Type of Biosensor and Carrier Plate Format
- Figure 4.15 Biosensors in Drug Discovery: Distribution by Sample Capacity
- Figure 4.16 Biosensors in Drug Discovery: Distribution by Sample Volume
- Figure 4.17 Biosensors in Drug Discovery: Distribution by Type of Detection Method Employed
- Figure 4.18 Biosensors in Drug Discovery: Distribution by Type of System
- Figure 5.1 Product Competitiveness Analysis: Dot Plot Analysis
- Figure 5.2 Product Competitiveness Analysis: Biosensors in Drug Discovery
- Figure 7.1 Biosensor Developers for Drug Discovery Applications: Brand Positioning Matrix
- Figure 7.2 Brand Positioning Matrix: Agilent Technologies
- Figure 7.3 Brand Positioning Matrix: Cytiva
- Figure 7.4 Brand Positioning Matrix: Sartorius
- Figure 7.5 Brand Positioning Matrix: Malvern Panalytical
- Figure 8.1 Funding and Investment Analysis: Cumulative Year-wise Distribution of Funding Instances, Since 2018
- Figure 8.2 Funding and Investment Analysis: Cumulative Year-wise Distribution of Amount Invested, Since 2018 (USD Million)
- Figure 8.3 Funding and Investment Analysis: Distribution of Funding Instances by Type of Funding
- Figure 8.4 Funding and Investment Analysis: Distribution of Amount Invested by Type of Funding (USD Million)
- Figure 8.5 Funding and Investment Analysis: Distribution of Funding Instances by Type of Biosensor
- Figure 8.6 Most Active Players: Distribution by Number of Funding Instances
- Figure 8.7 Most Active Players: Distribution by Amount Invested (USD Million)
- Figure 8.8 Most Active Investors: Distribution by Number of Funding Instances
- Figure 8.9 Funding and Investment Analysis: Distribution of Amount Invested by Region (USD Million)
- Figure 8.10 Funding and Investment Analysis: Distribution of Amount Invested by Country (USD Million)
- Figure 9.1 Publication Analysis: Distribution by Year of Publication
- Figure 9.2 Publication Analysis: Distribution by Type of Publication
- Figure 9.3 Most Popular Journals: Distribution by Number of Publications
- Figure 9.4 Most Popular Journals: Distribution by Impact Factor
- Figure 9.5 Publication Analysis: Most Popular Keywords
- Figure 9.6 Most Active Publisher: Distribution by Number of Publications
- Figure 9.7 Most Active Affiliated Institutes: Distribution by Number of Publications
- Figure 9.8 Publication Analysis: Distribution by Geography
- Figure 10.1 Global Event Analysis: Cumulative Quarterly Trend
- Figure 10.2 Global Event Analysis: Distribution by Event Platform
- Figure 10.3 Global Event Analysis: Distribution by Type of Event
- Figure 10.4 Global Event Analysis: Distribution by Location of Event
- Figure 10.5 Global Event Analysis: Distribution by Evolutionary Trends in Event Agenda / Key Focus Area
- Figure 10.6 Most Active Organizers: Distribution by Number of Events
- Figure 10.7 Global Event Analysis: Distribution by Designation of Participants
- Figure 10.8 Global Event Analysis: Distribution by Affiliated Department of Participants
- Figure 10.9 Global Event Analysis: Geography of Upcoming Events
- Figure 11.1 Patent Analysis: Distribution by Type of Patent
- Figure 11.2 Patent Analysis: Distribution by Patent Publication Year
- Figure 11.3 Patent Analysis: Distribution by Geography
- Figure 11.4 Patent Analysis: Distribution by CPC Symbols
- Figure 11.5 Patent Analysis: Emerging Focus Areas
- Figure 11.6 Patent Analysis: Distribution by Patents Age
- Figure 11.7 Patent Analysis: Distribution by Type of Applicant
- Figure 11.8 Leading Industry Players: Distribution by Number of Patents
- Figure 11.9 Leading Non-Industry Players: Distribution by Number of Patents
- Figure 11.10 Leading Individual Assignees: Distribution by Number of Patents
- Figure 11.11 Biosensors in Drug Discovery: Patent Valuation Analysis
- Figure 12.1 Global Biosensors in Drug Discovery Market, Till 2035 (USD Billion)
- Figure 12.2 Biosensors in Drug Discovery Market: Likely Growth Scenarios
- Figure 12.3 Biosensors in Drug Discovery Market: Distribution by Type of Biosensor (USD Billion)
- Figure 12.4 Optical Biosensors in Drug Discovery Market, Till 2035 (USD Billion)
- Figure 12.5 Electrochemical Biosensors in Drug Discovery Market, Till 2035 (USD Billion)
- Figure 12.6 Thermal Biosensors in Drug Discovery Market, Till 2035 (USD Billion)
- Figure 12.7 Other Biosensors in Drug Discovery Market, Till 2035 (USD Billion)
- Figure 12.8 Biosensors in Drug Discovery Market: Distribution by Type of End User
- Figure 12.9 Biosensors in Drug Discovery Market for Academic and Research Institutes, Till 2035 (USD Billion)
- Figure 12.10 Biosensors in Drug Discovery Market for Industry Players, Till 2035 (USD Billion)
- Figure 12.11 Biosensors in Drug Discovery Market: Distribution by Region
- Figure 12.12 Biosensors in Drug Discovery Market in North America, Till 2035 (USD Billion)
- Figure 12.13 Biosensors in Drug Discovery Market in Europe, Till 2035 (USD Billion)
- Figure 12.14 Biosensors in Drug Discovery Market in Asia Pacific, Till 2035 (USD Billion)
- Figure 12.15 Biosensors in Drug Discovery Market in Latin America, Till 2035 (USD Billion)
- Figure 12.16 Biosensors in Drug Discovery Market in Middle East and North Africa, Till 2035 (USD Billion)
- Figure 12.17 Biosensors in Drug Discovery Market in Rest of the World, Till 2035 (USD Billion)
- Figure 13.1 Concluding Remarks: Market Landscape
- Figure 13.2 Concluding Remarks: Funding and Investments Analysis
- Figure 13.3 Concluding Remarks: Publication Analysis
- Figure 13.4 Concluding Remarks: Global Event Analysis
- Figure 13.5 Concluding Remarks: Patent Analysis
- Figure 13.6 Concluding Remarks: Market Forecast and Opportunity Analysis

