
PUBLISHER: Roots Analysis | PRODUCT CODE: 1817404

PUBLISHER: Roots Analysis | PRODUCT CODE: 1817404
Adeno-Associated Viral (AAV) Vector Market: Industry Trends and Global Forecasts - Distribution by Type of Therapy, Therapeutic Area, Route of Administration, Scale of Operation and Geographical Regions
GLOBAL AAV VECTOR MARKET: OVERVIEW
The global AAV vector market estimated to be 3.6 billion in the current year and USD 6.0 billion by 2035, representing a CAGR of 5.3% during the forecast period.
The market sizing and opportunity analysis has been segmented across the following parameters:
Type of Therapy
- Gene Augmentation Therapies
- Gene Regulation Therapies
Therapeutic Area
- Oncological Disorders
- Rare Disorders
- Neurological Disorders
- Metabolic Disorders
- Musculoskeletal Disorders
- Dermatological Disorders
- Infectious Diseases
- Cardiovascular Disorders
- Genetic Disorders
- Ophthalmic Disorders
- Other Disorders
Route of Administration
- Intravenous Route
- Subretinal Route
- Intravitreal Route
- Other Routes
Scale of Operation
- Preclinical
- Clinical
- Commercial
Key Geographical Regions
- North America
- Europe
- Asia-Pacific
- Middle East and North Africa
- Latin America and Rest of the World
Global AAV Market: Growth and Trends
In the last few years, the demand for gene therapies has surged owing to their potential in targeting the underlying cause of a disease at cellular level. Presently, over 2,000 gene therapies are being evaluated in different phases of clinical development. This increasing interest in such therapies has resulted in an increase in the demand for novel delivery vectors. AAV vectors have emerged the most efficient viral vectors, among the various gene delivery vectors available. In the present year, six AAV based gene therapies have been approved for various indications. The current market dynamics suggest that close to 290 players across the globe are developing AAV vector-based therapies in order to cater to their increasing demand.
The AAV technology has a history spanning over 50 years and is consistently advancing, becoming one of the most widely utilized gene delivery systems for gene therapy purposes. Additionally, due to its uncomplicated structure, and absence of disease association, AAV vector is the most favored vector for numerous medical applications. Lately, the AAV vector market has encountered competition from various viral and non-viral systems that enable the delivery of larger genetic material. Additional complexity arises from the difficulties associated with scaling up GMP AAV production processes.
Given the current trends and anticipated opportunities in the AAV viral vector sector, we anticipate that this field will experience notable growth in the near future.
Global AAV Market: Key Insights
The report delves into the current state of global AAV viral vector market and identifies potential growth opportunities within industry. Some key findings from the report include:
- Close to 635 adeno-associated viral vector-based therapies are being evaluated by stakeholders in this domain for various disease indications.
- Most (42%) therapies are in preclinical stage of development, followed by those in clinical stage (30%); majority of the therapies presently use gene augmentation approach in order to treat several diseases.
- Presently, close to 95 players across the globe claim to offer their services across various scale of operations in order to support the development of AAV therapies; notably, majority of these firms are based in North America.
- Several stakeholders have made significant efforts in order to develop adeno-associated viral vector-based therapies, across the globe; majority of these players have been established post-2010.
- 55 adeno-associated viral vector technologies / platforms are currently available in the market; these can be used by various manufacturers in order to cater the increasing demand for AAV therapies.
- All the technologies / platforms developed by companies engaged in this domain are focused on adeno-associated viral vectors manufacturing; of these, majority are being developed against neurological disorders.
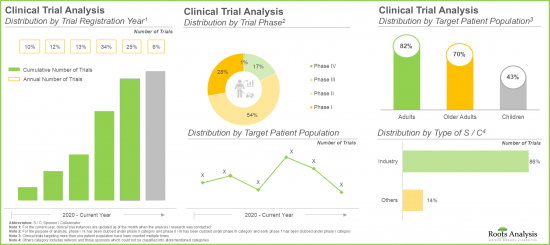
- Majority (65%) of the trials were registered in the last three years; a significant proportion of these trials are currently under early stages of research (phase I and phase II).
- Mergers and acquisitions (22%) emerged as the preferred type of partnership model adopted by industry stakeholders, as it enables companies to enter new markets and expand their product portfolios.
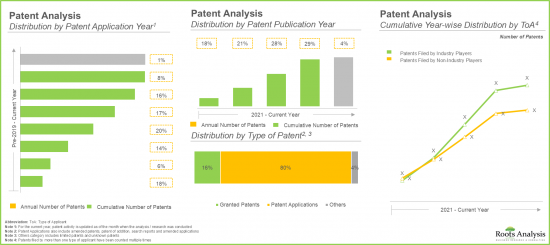
- Over 1,600 patents have been published in the adeno-associated viral vector domain since 2021; of these, over 60% of the patents have been filed in the last five years.
- The future opportunity, in terms of revenues generated from marketed and late-stage therapies, is anticipated to be well distributed across different therapeutic disorders, type of therapy and route of administration.
- The market is likely to witness an annualized growth of 7.7% during the forecast period owing to various benefits offered by AAV manufacturing techniques, including high target specificity and broad tissue tropism.
Global AAV Market: Key Segments
Muscle-related Disorders Segment is Likely to Hold the Largest Market Share
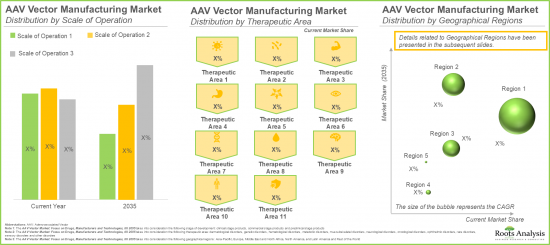
In terms of therapeutic area, the market is segmented across muscle-related disorders, genetic disorders, hematological disorders, ophthalmic disorders, dermatological disorders and metabolic disorders. In the current year, the muscle-related disorders segment occupies the higher AAV vector market share (53%), owing to the increasing adoption of AAV vector-based therapies in the treatment of severe muscle disorders, specifically Duchenne muscular dystrophy (DMD) and spinal muscular atrophy.
Gene Augmentation Therapies Segment Holds the Largest Market Share
In terms of type of therapy, the global AAV vector-based therapies market is segmented across gene augmentation therapies and gene regulation therapies. In the current year, the revenues generated by the sales of gene augmentation therapies completely drive the AAV vector-based therapies industry. Further, the market is likely to witness a considerable increase in the share of gene regulation therapies, growing at a CAGR of 61% during the forecast period.
Intravenous Route Segment Holds the Largest Market Share
In terms of route of administration, the AAV vector based therapies industry is segmented across intravenous route, subretinal route, intravitreal route and other routes. In the current year, intravenous route segment occupies the highest market share due to the ability of intravenous route to deliver therapy quickly and evenly across the entire body. In addition, the market is anticipated to witness a considerable increase in the share of therapies administered via intravitreal route, growing at a CAGR of 64% during the forecast period. This is an outcome of the increasing number of AAV based therapy approvals for ophthalmic disorders, for which intravitreal route has emerged as the primary route.
Europe is likely to Propel in the AAV vector based Therapies Market in the Coming Years
This segment highlights the distribution of AAV vector based therapies market across various geographical regions, namely North America, Europe, Asia-Pacific and Latin America, and rest of the world. Our estimates suggest that North America is likely to capture the majority (~75%) of the AAV vector based therapies market share in the current year. This can be attributed to the availability of advanced healthcare infrastructure within this region to conduct a large number of clinical trials.
Example Players in the AAV Market
- Astellas Pharma
- Charles River Laboratories
- Lonza
- Patheon pharma services
- Sanofi
- WuXi AppTec
- Sarepta Therapeutics
- Uniqure
- Spark Therapeutics
- PTC Therapeutics
- Biomarin Pharmaceutical
- Novartis
Global AAV Market: Research Coverage
- Market Sizing and Opportunity Analysis: The report features an in-depth analysis of the global AAV vector market, focusing on key market segments, including [A] type of therapy, [B] therapeutic area, [C] route of administration, [D] scale of operation and [E] geographical regions.
- Adeno-associated Viral Vector Manufacturing Market Landscape: The report features an in-depth analysis of the global AAV vector market, focusing on key market segments, including [A] status of development, [B] therapeutic area, [C] type of gene / molecule targeted, [D] type of therapy, [E] gene delivery method used, [F] route of administration, [G] special designation awarded, [H] year of establishment, [I] company size, and [J] location of headquarters.
- Adeno-associated Viral Vector Manufacturing Market Technologies / Platforms Landscape: A comprehensive evaluation of adeno-associated viral vector manufacturing technologies / platforms, considering various parameters, such as [A] type of vector manufactured, [B] type of viral vector manufactured, [C] scale of operation [D] application area [E] therapeutic area, [F] year of establishment, [G] company size, and [H] location of headquarters .
- Company Competitiveness Analysis: A comprehensive competitive analysis of AAV viral vector manufacturers, examining factors, such as [A] manufacturer strength and [B] product portfolio strength.
- Technology Competitiveness Analysis: A comprehensive competitive analysis of AAV viral vector manufacturing technologies, examining factors, such as [A] supplier power and [B] key technology specifications.
- Company Profiles: In-depth company and drug profiles of the players, focusing on [A] company overview, [B] financial information (if available), [C] drug portfolio and [D] recent developments and an informed future outlook.
- Clinical Trial Analysis: An insightful analysis of clinical studies, based on several parameters, such as [A] trial registration year, [B] current status, [C] phase of development, [D], enrolled patient population [E] type of sponsor / collaborator and [F] regional distribution of trials.
- Partnerships and Collaborations: An in-depth analysis of the deals inked by stakeholders in the AAV vector manufacturing market, based on several parameters, such as [A] year of partnership, [B] type of partnership, [C] therapeutic area, [D] application area, [E] geographical distribution [F] most active players (in terms of number of partnerships).
- Likely Partners Analysis: A detailed review of the companies with the likelihood of establishing partnerships with adeno-associated viral vector and gene therapy product manufacturers, based on several parameters, such as [A] developer strength, [B] product strength, [C] therapeutic capability and [D] pipeline strength.
- Patent Analysis: An in-depth analysis of patents filed / granted till date in the AAV vector manufacturing domain, based on various relevant parameters, such as [A] type of patent, [B] publication year, [C] regional applicability, [D] CPC symbols, [E] emerging focus areas, [F] leading industry / non-industry players and [G] patent valuation.
- Start-up Health Indexing: A comprehensive analysis of the various start-ups engaged in the development of adeno-associated viral vectors-based therapies, based on relevant parameters, such as [A] number of candidates in discovery, preclinical and clinical phases of development, [B] number of patents and [C] number of partnerships established.
- Outsourcing: Go / No-Go Framework: An exhaustive study of the various factors that need to be taken into consideration by adeno-associated viral vector manufacturers to facilitate decision making to manufacture their respective products in-house or engage the services of a CMO.
Key Questions Answered in this Report
- How many companies are currently engaged in this market?
- Which are the leading companies in this market?
- What factors are likely to influence the evolution of this market?
- What is the current and future market size?
- What is the CAGR of this market?
- How is the current and future market opportunity likely to be distributed across key market segments?
Reasons to Buy this Report
- The report provides a comprehensive market analysis, offering detailed revenue projections of the overall market and its specific sub-segments. This information is valuable to both established market leaders and emerging entrants.
- Stakeholders can leverage the report to gain a deeper understanding of the competitive dynamics within the market. By analyzing the competitive landscape, businesses can make informed decisions to optimize their market positioning and develop effective go-to-market strategies.
- The report offers stakeholders a comprehensive overview of the market, including key drivers, barriers, opportunities, and challenges. This information empowers stakeholders to stay abreast of market trends and make data-driven decisions to capitalize on growth prospects.
Additional Benefits
- Complimentary PPT Insights Packs
- Complimentary Excel Data Packs for all Analytical Modules in the Report
- 15% Free Content Customization
- Detailed Report Walkthrough Session with Research Team
- Free Updated report if the report is 6-12 months old or older
TABLE OF CONTENTS
SECTION I: REPORT OVERVIEW
1. PREFACE
- 1.1. Introduction
- 1.2. Market Share Insights
- 1.3. Key Market Insights
- 1.4. Report Coverage
- 1.5. Key Questions Answered
- 1.6. Chapter Outlines
2. RESEARCH METHODOLOGY
- 2.1. Chapter Overview
- 2.2. Research Assumptions
- 2.2.1. Market Landscape and Market Trends
- 2.2.2. Market Forecast and Opportunity Analysis
- 2.2.3. Comparative Analysis
- 2.3. Database Building
- 2.3.1. Data Collection
- 2.3.2. Data Validation
- 2.3.3. Data Analysis
- 2.4. Project Methodology
- 2.4.1. Secondary Research
- 2.4.1.1. Annual Reports
- 2.4.1.2. Academic Research Papers
- 2.4.1.3. Company Websites
- 2.4.1.4. Investor Presentations
- 2.4.1.5. Regulatory Filings
- 2.4.1.6. White Papers
- 2.4.1.7. Industry Publications
- 2.4.1.8. Conferences and Seminars
- 2.4.1.9. Government Portals
- 2.4.1.10. Media and Press Releases
- 2.4.1.11. Newsletters
- 2.4.1.12. Industry Databases
- 2.4.1.13. Roots Proprietary Databases
- 2.4.1.14. Paid Databases and Sources
- 2.4.1.15. Social Media Portals
- 2.4.1.16. Other Secondary Sources
- 2.4.2. Primary Research
- 2.4.2.1. Types of Primary Research
- 2.4.2.1.1. Qualitative Research
- 2.4.2.1.2. Quantitative Research
- 2.4.2.1.3. Hybrid Approach
- 2.4.2.2. Advantages of Primary Research
- 2.4.2.3. Techniques for Primary Research
- 2.4.2.3.1. Interviews
- 2.4.2.3.2. Surveys
- 2.4.2.3.3. Focus Groups
- 2.4.2.3.4. Observational Research
- 2.4.2.3.5. Social Media Interactions
- 2.4.2.4. Key Opinion Leaders Considered in Primary Research
- 2.4.2.4.1. Company Executives (CXOs)
- 2.4.2.4.2. Board of Directors
- 2.4.2.4.3. Company Presidents and Vice Presidents
- 2.4.2.4.4. Research and Development Heads
- 2.4.2.4.5. Technical Experts
- 2.4.2.4.6. Subject Matter Experts
- 2.4.2.4.7. Scientists
- 2.4.2.4.8. Doctors and Other Healthcare Providers
- 2.4.2.5. Ethics and Integrity
- 2.4.2.5.1. Research Ethics
- 2.4.2.5.2. Data Integrity
- 2.4.2.1. Types of Primary Research
- 2.4.3. Analytical Tools and Databases
- 2.4.1. Secondary Research
- 2.5. Robust Quality Control
3. MARKET DYNAMICS
- 3.1. Chapter Overview
- 3.2. Forecast Methodology
- 3.2.1. Top-down Approach
- 3.2.2. Bottom-up Approach
- 3.2.3. Hybrid Approach
- 3.3. Market Assessment Framework
- 3.3.1. Total Addressable Market (TAM)
- 3.3.2. Serviceable Addressable Market (SAM)
- 3.3.3. Serviceable Obtainable Market (SOM)
- 3.3.4. Currently Acquired Market (CAM)
- 3.4. Forecasting Tools and Techniques
- 3.4.1. Qualitative Forecasting
- 3.4.2. Correlation
- 3.4.3. Regression
- 3.4.4. Extrapolation
- 3.4.5. Convergence
- 3.4.6. Sensitivity Analysis
- 3.4.7. Scenario Planning
- 3.4.8. Data Visualization
- 3.4.9. Time Series Analysis
- 3.4.10. Forecast Error Analysis
- 3.5. Key Considerations
- 3.5.1. Demographics
- 3.5.2. Government Regulations
- 3.5.3. Reimbursement Scenarios
- 3.5.4. Market Access
- 3.5.5. Supply Chain
- 3.5.6. Industry Consolidation
- 3.5.7. Pandemic / Unforeseen Disruptions Impact
- 3.6. Limitations
4. MACRO-ECONOMIC INDICATORS
- 4.1. Chapter Overview
- 4.2. Market Dynamics
- 4.2.1. Time Period
- 4.2.1.1. Historical Trends
- 4.2.1.2. Current and Forecasted Estimates
- 4.2.2. Currency Coverage
- 4.2.2.1. Major Currencies Affecting the Market
- 4.2.2.2. Factors Affecting Currency Fluctuations
- 4.2.2.3. Impact of Currency Fluctuations on the Industry
- 4.2.3. Foreign Currency Exchange Rate
- 4.2.3.1. Impact of Foreign Exchange Rate Volatility on the Market
- 4.2.3.2. Strategies for Mitigating Foreign Exchange Risk
- 4.2.4. Recession
- 4.2.4.1. Assessment of Current Economic Conditions and Potential Impact on the Market
- 4.2.4.2. Historical Analysis of Past Recessions and Lessons Learnt
- 4.2.5. Inflation
- 4.2.5.1. Measurement and Analysis of Inflationary Pressures in the Economy
- 4.2.5.2. Potential Impact of Inflation on the Market Evolution
- 4.2.6. Interest Rates
- 4.2.6.1. Interest Rates and Their Impact on the Market
- 4.2.6.2. Strategies for Managing Interest Rate Risk
- 4.2.7. Commodity Flow Analysis
- 4.2.7.1. Type of Commodity
- 4.2.7.2. Origins and Destinations
- 4.2.7.3. Values and Weights
- 4.2.7.4. Modes of Transportation
- 4.2.8. Global Trade Dynamics
- 4.2.8.1. Import Scenario
- 4.2.8.2. Export Scenario
- 4.2.8.3. Trade Policies
- 4.2.8.4. Strategies for Mitigating the Risks Associated with Trade Barriers
- 4.2.8.5. Impact of Trade Barriers on the Market
- 4.2.9. War Impact Analysis
- 4.2.9.1. Russian-Ukraine War
- 4.2.9.2. Israel-Hamas War
- 4.2.10. COVID Impact / Related Factors
- 4.2.10.1. Global Economic Impact
- 4.2.10.2. Industry-specific Impact
- 4.2.10.3 .Government Response and Stimulus Measures
- 4.2.10.4. Future Outlook and Adaptation Strategies
- 4.2.11. Other Indicators
- 4.2.11.1. Fiscal Policy
- 4.2.11.2. Consumer Spending
- 4.2.11.3. Gross Domestic Product
- 4.2.11.4. Employment
- 4.2.11.5. Taxes
- 4.2.11.6. Stock Market Performance
- 4.2.11.7. Cross Border Dynamics
- 4.2.1. Time Period
- 4.3. Conclusion
SECTION II: QUALITATIVE INSIGHTS
5. EXECUTIVE SUMMARY
- 5.1. Executive Summary: Market Landscape
- 5.2. Executive Summary: Market Trends
- 5.3. Executive Summary: Market Forecast and Opportunity Analysis
6. INTRODUCTION
- 6.1. Chapter Overview
- 6.2. Classification of Vectors
- 6.2.1. Viral Vectors
- 6.2.1.1. Retrovirus Vectors
- 6.2.1.2. Lentivirus Vectors
- 6.2.1.3. Adeno-associated Viral Vectors
- 6.2.1.4. Adenovirus Vectors
- 6.2.1.5. Other Viral Vectors
- 6.2.1.5.1. Alphavirus
- 6.2.1.5.2. Foamy Virus
- 6.2.1.5.3. Simian Virus
- 6.2.1.5.4. Vaccinia Virus
- 6.2.1.5.5. Chimeric Viral Vectors
- 6.2.1.5.6. Herpes Simplex Virus
- 6.2.1.5.7. Sendai Virus
- 6.2.2. Non-Viral Vectors
- 6.2.1. Viral Vectors
- 6.3. Adeno-associated Viral Vectors
- 6.3.1. Structure and Design
- 6.3.2. Adeno-associated Viral Vector Life Cycle
- 6.3.3. Application of Adeno-associated Viral Vectors
- 6.3.3.1. Gene Therapy
- 6.3.3.2. Vaccination
- 6.3.4. Advantages of Adeno-associated Viral Vectors
- 6.3.5. Challenges Related to Adeno-associated Viral Vectors
- 6.4. Concluding Remarks
SECTION III: COMPETITIVE LANDSCAPE
7. ADENO-ASSOCIATED VIRAL VECTOR BASED THERAPIES: MARKET LANDSCAPE
- 7.1. Chapter Overview
- 7.2. Adeno-associated Viral Vector Based Therapies: Overall Market Landscape
- 7.2.1. Analysis by Status of Development
- 7.2.2. Analysis by Therapeutic Area
- 7.2.3. Analysis by Status of Development and Therapeutic Area
- 7.2.4. Analysis by Type of Gene / Molecule Targeted
- 7.2.5. Analysis by Type of Therapy
- 7.2.6. Analysis by Type of Gene Delivery Method Used
- 7.2.7. Analysis by Route of Administration
- 7.2.8. Analysis by Special Designation Awarded
- 7.3. Adeno-associated Viral Vector Based Therapy Developers: Overall Landscape
- 7.3.1. Analysis by Year of Establishment
- 7.3.2. Analysis by Company Size
- 7.3.3. Analysis by Location of Headquarters (Region)
- 7.3.4. Analysis by Company Size and Location of Headquarters (Region)
- 7.3.5. Most Active Developers: Analysis by Number of Therapies Developed
8. ADENO-ASSOCIATED VIRAL VECTOR MANUFACTURERS: MARKET LANDSCAPE
- 8.1. Chapter Overview
- 8.2. Adeno-associated Viral Vector Manufacturers: Overall Market Landscape
- 8.2.1. Analysis by Year of Establishment
- 8.2.2. Analysis by Company Size
- 8.2.3. Analysis by Location of Headquarters
- 8.2.4. Analysis by Type of Product Manufactured
- 8.2.5. Analysis by Type of Vector Manufactured
- 8.2.6. Analysis by Scale of Operation
- 8.2.7. Analysis by Type of Manufacturer
- 8.2.8. Analysis by Location of Vector Manufacturing Facility
- 8.2.9. Analysis by Application Area
9. ADENO-ASSOCIATED VIRAL VECTOR MANUFACTURING: TECHNOLOGIES / PLATFORMS LANDSCAPE
- 9.1. Chapter Overview
- 9.2. Adeno-associated Viral Vector Manufacturing: Technologies / Platforms Landscape
- 9.2.1. Analysis by Type of Vector Manufactured
- 9.2.2. Analysis by Type of Viral Vector Manufactured
- 9.2.3. Analysis by Scale of Operation
- 9.2.4. Analysis by Application Area
- 9.2.5. Analysis by Therapeutic Area
- 9.3. Adeno-associated Viral Vector Manufacturing: Technology / Platform Providers Landscape
- 9.3.1. Analysis by Year of Establishment
- 9.3.2. Analysis by Company Size
- 9.3.3. Analysis by Location of Headquarters
- 9.3.4. Analysis by Company Size and Location of Headquarters
- 9.3.5. Most Active Players: Analysis by Number of Technologies / Platforms
10. COMPANY COMPETITIVENESS ANALYSIS: ADENO-ASSOCIATED VIRAL VECTOR MANUFACTURERS
- 10.1. Chapter Overview
- 10.2. Assumptions and Key Parameters
- 10.3. Methodology
- 10.4. Overview of Peer Groups
- 10.5. Company Competitiveness Analysis
- 10.5.1. Adeno-associated viral vector manufacturers headquartered in North America
- 10.5.2. Adeno-associated viral vector manufacturers headquartered in Europe
- 10.5.3. Adeno-associated viral vector manufacturers headquartered in Asia-Pacific
11. TECHNOLOGY COMPETITIVENESS ANALYSIS
- 11.1. Chapter Overview
- 11.2. Assumptions and Key Parameters
- 11.3. Methodology
- 11.4. Overview of Peer Groups
- 11.5. Adeno-associated Viral Vector Technologies / Platforms: Competitiveness Analysis
- 11.5.1. Adeno-associated Viral Vector Technologies / Platforms Provided by Companies Headquartered in North America
- 11.5.2. Adeno-associated Viral Vector Technologies / Platforms Provided by Companies Headquartered in Europe and Asia-Pacific
SECTION IV: COMPANY PROFILES
12. MARKETED DRUG PROFILES
- 12.1. Chapter Overview
- 12.2. Elevidys (Developed by Sarepta Therapeutics)
- 12.2.1. Company Overview
- 12.2.2. Development Timeline
- 12.2.3. Mechanism of Action and Vector Used
- 12.2.4. Manufacturing, Dosage and Sales
- 12.2.5. Target Indication
- 12.2.6. Current Status of Development
- 12.3. Hemgenix (Developed by Uniqure)
- 12.4. Kebilidi (Developed by PTC Therapeutics)
- 12.5. Luxturna (Developed by Spark Therapeutics)
- 12.6. Roctavian (Developed by Biomarin Pharmaceutical)
- 12.7. Zolgensma (Developed by Novartis)
13. COMPANY PROFILES: LEADING ADENO-ASSOCIATED VIRAL VECTOR MANUFACTURERS
- 13.1. Chapter Overview
- 13.2. Astellas Pharma
- 13.2.1. Company Overview
- 13.2.2. Financial Information
- 13.2.3. Vector Manufacturing Related Capabilities
- 13.2.4. Recent Developments and Future Outlook
- 13.3. Charles River Laboratories
- 13.4. Cytiva
- 13.5. Lonza
- 13.6. Patheon Pharma Services
- 13.7. Sanofi
- 13.8. Wuxi AppTec
SECTION V: MARKET TRENDS
14. CLINICAL TRIAL ANALYSIS
- 14.1. Chapter Overview
- 14.2. Scope and Methodology
- 14.3. Adeno-associated Viral Vector Based Therapies: Clinical Trial Analysis
- 14.3.1. Analysis by Trial Registration Year
- 14.3.2. Analysis of Patients Enrolled by Trial Registration Year
- 14.3.3. Analysis by Trial Phase
- 14.3.4. Analysis of Patients Enrolled by Trial Phase
- 14.3.5. Analysis by Trial Status
- 14.3.6. Analysis of Patients Enrolled by Trial Status
- 14.3.7. Analysis by Target Patient Population
- 14.3.8. Analysis by Patient Gender
- 14.3.9. Analysis by Type of Sponsor / Collaborator
- 14.3.10. Analysis by Study Design
- 14.3.10.1. Analysis by Type of Patient Allocation Model Used
- 14.3.10.2. Analysis by Type of Trial Masking Adopted
- 14.3.10.3. Analysis by Type of Trial Intervention Model
- 14.3.10.4. Analysis by Trial Purpose
- 14.3.11. Most Active Players: Analysis by Number of Clinical Trials Sponsored / Collaborated
- 14.3.12. Analysis by Geography
- 14.3.12.1. Analysis of Clinical Trials by Geography
- 14.3.12.2. Analysis of Clinical Trials by Geography and Trial Status
- 14.3.12.3. Analysis of Patients Enrolled by Geography and Trial Status
- 14.3.12.4. Analysis of Clinical Trials by Geography, Trial Status and Trial Phase
15. PARTNERSHIPS AND COLLABORATIONS
- 15.1. Chapter Overview
- 15.2. Partnership Models
- 15.3. Adeno-associated Viral Vector Based Therapy Developers: Partnerships and Collaborations
- 15.3.1. Analysis by Year of Partnership
- 15.3.2. Analysis by Type of Partnership
- 15.3.3. Analysis by Year and Type of Partnership
- 15.3.4. Analysis by Year of Partnership and Type of Partner
- 15.3.5. Analysis by Type of Partnership and Type of Partner
- 15.3.6. Analysis by Therapeutic Area
- 15.3.7. Most Active Players: Analysis by Number of Partnerships
- 15.3.8. Analysis by Geography
- 15.3.8.1. Analysis by Country
- 15.3.8.2. Analysis by Region
- 15.4. Adeno-associated Viral Vector Manufacturers: Partnerships and Collaborations
- 15.4.1. Analysis by Year of Partnership
- 15.4.2. Analysis by Type of Partnership
- 15.4.3. Analysis by Year and Type of Partnership
- 15.4.4. Analysis by Year of Partnership and Type of Partner
- 15.4.5. Analysis by Type of Partnership and Type of Partner
- 15.4.6. Analysis by Therapeutic Area
- 15.4.7. Analysis by Application Area
- 15.4.8. Most Active Players: Analysis by Number of Partnerships
- 15.4.9. Analysis by Geography
- 15.4.9.1. Analysis by Country
- 15.4.9.2. Analysis by Region
16. LIEKLY PARTNER ANALYSIS
- 16.1. Chapter Overview
- 16.2. Adeno-associated Viral Vector Based Therapy Developers: Likely Partners
- 16.2.1. Methodology and Key Parameters
- 16.2.2. Adeno-associated Viral Vector Based Therapy Developers: Likely Partner Analysis
- 16.2.2.1. Most Likely Partners
- 16.2.2.2. Likely Partners
- 16.2.2.3. Less Likely Partners
- 16.2.2.4. Least Likely Partners
17. PATENT ANALYSIS
- 17.1. Chapter Overview
- 17.2. Scope and Methodology
- 17.3. Adeno-associated Viral Vector Market: Patent Analysis
- 17.3.1. Analysis by Patent Application Year
- 17.3.2. Analysis by Patent Publication Year
- 17.3.3. Analysis by Type of Patent and Publication Year
- 17.3.4. Analysis by Patent Jurisdiction
- 17.3.5. Analysis by CPC Symbols
- 17.3.6. Analysis by Type of Applicant
- 17.3.7. Leading Industry Players: Analysis by Number of Patents
- 17.3.8. Leading Non-Industry Players: Analysis by Number of Patents
- 17.3.9. Leading Patent Assignees: Analysis by Number of Patents
- 17.4. Patent Benchmarking Analysis
- 17.4.1. Analysis by Patent Characteristics
- 17.5. Patent Valuation
- 17.6. Leading Patents by Number of Citations
18. START-UP HEALTH INDEXING
- 18.1. Chapter Overview
- 18.2. Start-ups Developing Adeno-associated Viral Vector Based Therapies
- 18.2.1. Analysis by Location of Headquarters
- 18.3. Benchmarking of Start-ups
- 18.3.1. Analysis by Pipeline Strength
- 18.3.2. Analysis by Pipeline Maturity
- 18.3.3. Analysis by Indication Diversity
- 18.3.4. Analysis by Patent Strength
- 18.3.5. Analysis by Partnership Activity
- 18.3.6. Start-ups Health Indexing: Roots Analysis Perspective
19. OUTSOURCING: GO / NO-GO FRAMEWORK
- 19.1. Chapter Overview
- 19.2. Outsourcing: Go / No-Go Framework
- 19.3. Adeno-associated Viral Vector Developers Outsourcing: Go / No-Go Framework
- 19.3.1. Key Assumptions and Parameters
- 19.3.2. Methodology
- 19.3.3. Results and Interpretations
- 19.3.3.1. Adeno-associated Viral Vector Based Therapy Developers: Benchmarking of Small Companies
- 19.3.3.2. Adeno-associated Viral Vector Based Therapy Developers: Benchmarking of Mid-sized Companies
- 19.3.3.3. Adeno-associated Viral Vector Based Therapy Developers: Benchmarking of Large Companies
- 19.4. Concluding Remarks
SECTION VI: MARKET OPPORTUNITY ANALYSIS
20. GLOBAL ADENO-ASSOCIATED VIRAL VECTOR BASED THERAPEUTICS MARKET
- 20.1. Chapter Overview
- 20.2. Assumptions and Methodology
- 20.3. Global Adeno-associated Viral Vector Based Therapeutics Market: Historical Trends (since 2021) and Forecasted Estimates (till 2035)
- 20.3.1. Scenario Analysis
- 20.3.1.1. Conservative Scenario
- 20.3.1.2. Optimistic Scenario
- 20.3.1. Scenario Analysis
- 20.4. Key Market Segmentations
21. ADENO-ASSOCIATED VIRAL VECTOR BASED THERAPEUTICS MARKET, BY THERAPEUTIC AREA
- 21.1. Chapter Overview
- 21.2. Assumptions and Methodology
- 21.3. Adeno-associated Viral Vector Based Therapeutics Market: Distribution by Therapeutic Area
- 21.3.1. Adeno-associated Viral Vector Based Therapeutics Market for Muscle-related Disorders: Historical Trends (since 2023) and Forecasted Estimates (till 2035)
- 21.3.2. Adeno-associated Viral Vector
Based Therapeutics Market for Genetic Disorders: Historical Trends (since 2021) and Forecasted Estimates (till 2035)
- 21.3.3. Adeno-associated Viral Vector Based Therapeutics Market for Hematological Disorders: Historical Trends (since 2022) and Forecasted Estimates (till 2035)
- 21.3.4. Adeno-associated Viral Vector Based Therapeutics Market for Ophthalmic Disorders: Historical Trends (since 2021) and Forecasted Estimates (till 2035)
- 21.3.5. Adeno-associated Viral Vector Based Therapeutics Market for Dermatological Disorders: Forecasted Estimates (till 2035)
- 21.3.6. Adeno-associated Viral Vector Based Therapeutics Market for Metabolic Disorders: Forecasted Estimates (till 2035)
- 21.4. Data Triangulation and Validation
22. ADENO-ASSOCIATED VIRAL VECTOR BASED THERAPEUTICS MARKET, BY TYPE OF THERAPY
- 22.1. Chapter Overview
- 22.2. Key Assumptions and Methodology
- 22.3. Adeno-associated Viral Vector Based Therapeutics Market: Distribution by Type of Therapy
- 22.3.1. Adeno-associated Viral Vector Based Therapeutics Market for Gene Augmentation Therapies, Historical Trends (since 2021) and Forecasted Estimates (till 2035)
- 22.3.2. Adeno-associated Viral Vector Based Therapeutics Market for Gene Regulation Therapies, Forecasted Estimates (till 2035)
- 22.4. Data Triangulation and Validation
23. ADENO-ASSOCIATED VIRAL VECTOR BASED THERAPEUTICS MARKET, BY ROUTE OF ADMINISTRATION
- 23.1. Chapter Overview
- 23.2. Key Assumptions and Methodology
- 23.3. Adeno-associated Viral Vector Based Therapeutics Market: Distribution by Route of Administration
- 23.3.1. Adeno-associated Viral Vector Based Therapeutics Market for Intravenous Route: Historical Trends (since 2021) and Forecasted Estimates (till 2035)
- 23.3.2. Adeno-associated Viral Vector Based Therapeutics Market for Subretinal Route: Historical Trends (since 2021) and Forecasted Estimates (till 2035)
- 23.3.3. Adeno-associated Viral Vector Based Therapeutics Market for Intravitreal Route: Historical Trends (since 2022) and Forecasted Estimates (till 2035)
- 23.3.4. Adeno-associated Viral Vector Based Therapeutics Market for Other Routes: Historical Trends (since 2022) and Forecasted Estimates (till 2035)
- 23.4. Data Triangulation and Validation
24. ADENO-ASSOCIATED VIRAL VECTOR BASED THERAPEUTICS MARKET, BY GEOGRAPHICAL REGIONS
- 24.1. Chapter Overview
- 24.2. Key Assumptions and Methodology
- 24.3. Adeno-associated Viral Vector Based Therapeutics Market: Distribution by Geographical Regions
- 24.3.1. Adeno-associated Viral Vector Based Therapeutics Market in North America: Historical Trends (since 2021) and Forecasted Estimates (till 2035)
- 24.3.2. Adeno-associated Viral Vector Based Therapeutics Market in Europe: Historical Trends (since 2021) and Forecasted Estimates (till 2035)
- 24.3.3. Adeno-associated Viral Vector
Based Therapeutics Market in Asia-Pacific: Historical Trends (since 2021) and Forecasted Estimates (till 2035)
- 24.3.4. Adeno-associated Viral Vector Based Therapeutics Market in Latin America and Rest of the World: Historical Trends (since 2021) and Forecasted Estimates (till 2035)
- 24.4. Data Triangulation and Validation
25. ADENO-ASSOCIATED VIRAL VECTOR BASED THERAPEUTICS MARKET: SALES FORECAST OF THERAPIES
- 25.1. Chapter Overview
- 25.2. Key Assumptions and Methodology
- 25.3. Commercialized Adeno-associated Vector Based Therapeutics: Sales Forecast
- 25.3.1. Luxturna
- 25.3.1.1. Sales Forecast
- 25.3.1.2. Net Present Value
- 25.3.1.3. Value Creation Analysis
- 25.3.2. Hemgenix
- 25.3.2.1. Sales Forecast
- 25.3.2.2. Net Present Value
- 25.3.2.3. Value Creation Analysis
- 25.3.3. Zolgensma
- 25.3.3.1. Sales Forecast
- 25.3.3.2. Net Present Value
- 25.3.3.3. Value Creation Analysis
- 25.3.4. Roctavian
- 25.3.4.1. Sales Forecast
- 25.3.4.2. Net Present Value
- 25.3.4.3. Value Creation Analysis
- 25.3.5. Elevidys
- 25.3.5.1. Sales Forecast
- 25.3.5.2. Net Present Value
- 25.3.5.3. Value Creation Analysis
- 25.3.6. Upstaza
- 25.3.6.1. Sales Forecast
- 25.3.6.2. Net Present Value
- 25.3.6.3. Value Creation Analysis
- 25.3.7. EB 101
- 25.3.7.1. Sales Forecast
- 25.3.7.2. Net Present Value
- 25.3.7.3. Value Creation Analysis
- 25.3.8. BBM H901
- 25.3.8.1. Sales Forecast
- 25.3.8.2. Net Present Value
- 25.3.8.3. Value Creation Analysis
- 25.3.1. Luxturna
- 25.4. Phase III Adeno-Associated Vector Based Therapeutics: Sales Forecast
- 25.4.1. AGTC 501
- 25.4.1.1. Sales Forecast
- 25.4.2. Lumevoq
- 25.4.2.1. Sales Forecast
- 25.4.3. NFS-01
- 25.4.3.1. Sales Forecast
- 25.4.4. RGX-314
- 25.4.4.1. Sales Forecast
- 25.4.5. SPK-8011
- 25.4.5.1. Sales Forecast
- 25.4.6. Giroctocogene fitelparvovec
- 25.4.6.1. Sales Forecast
- 25.4.7. RGX-121
- 25.4.7.1. Sales Forecast
- 25.4.7.2. Net Present Value
- 25.4.7.3. Value Creation Analysis
- 25.4.8. DTx-401
- 25.4.8.1. Sales Forecast
- 25.4.9. DTx-301
- 25.4.9.1. Sales Forecast
- 25.4.10. ABO-102
- 25.4.10.1. Sales Forecast
- 25.4.11. AAV-RPE65
- 25.4.11.1. Sales Forecast
- 25.4.12. Ixoberogene Soroparvovec
- 25.4.12.1. Sales Forecast
- 25.4.13. OCU400
- 25.4.13.1. Sales Forecast
- 25.4.1. AGTC 501
26. GLOBAL ADENO-ASSOCIATED VIRAL VECTOR MANUFACTURING MARKET
- 26.1. Chapter Overview
- 26.2. Assumptions and Methodology
- 26.3. Global Adeno-associated Viral Vector Manufacturing Market: Historical Trends (since 2021) and Forecasted Estimates (till 2035)
- 26.3.1. Scenario Analysis
- 26.3.1.1. Conservative Scenario
- 26.3.1.2. Optimistic Scenario
- 26.3.1. Scenario Analysis
- 26.4. Key Market Segmentations
27. ADENO-ASSOCIATED VIRAL VECTOR MANUFACTURING MARKET, BY STAGE OF DEVELOPMENT
- 27.1. Chapter Overview
- 27.2. Key Assumptions and Methodology
- 27.3. Adeno-associated Viral Vector Manufacturing Market: Distribution by Stage of Development, 2021, 2025 and 2035
- 27.3.1. Adeno-associated Viral Vector Manufacturing Market for Commercial Stage Products: Historical Trends (since 2021) and Forecasted Estimates (till 2035)
- 27.3.2. Adeno-associated Viral Vector Manufacturing Market for Clinical Stage Products: Historical Trends (since 2021) and Forecasted Estimates (till 2035)
- 27.3.3. Adeno-associated Viral Vector Manufacturing Market for Preclinical Stage Products: Historical Trends (since 2021) and Forecasted Estimates (till 2035)
- 27.4. Data Triangulation and Validation
28. ADENO-ASSOCIATED VIRAL VECTOR MANUFACTURING MARKET, BY THERAPEUTIC AREA
- 28.1. Chapter Overview
- 28.2. Key Assumptions and Methodology
- 28.3. Adeno-associated Viral Vector Manufacturing Market: Distribution by Therapeutic Area, 2021, 2025 and 2035
- 28.3.1. Adeno-associated Viral Vector Manufacturing Market for Oncological Disorders: Historical Trends (since 2021) and Forecasted Estimates (till 2035)
- 28.3.2. Adeno-associated Viral Vector Manufacturing Market for Rare Disorders: Historical Trends (since 2021) and Forecasted Estimates (till 2035)
- 28.3.3. Adeno-associated Viral Vector Manufacturing Market for Musculoskeletal Disorders: Historical Trends (since 2021) and Forecasted Estimates (till 2035)
- 28.3.4. Adeno-associated Viral Vector Manufacturing Market for Genetic Disorders: Historical Trends (since 2021) and Forecasted Estimates (till 2035)
- 28.3.5. Adeno-associated Viral Vector Manufacturing Market for Hematological Disorders: Historical Trends (since 2021) and Forecasted Estimates (till 2035)
- 28.3.6. Adeno-associated Viral Vector Manufacturing Market for Neurological Disorders: Historical Trends (since 2021) and Forecasted Estimates (till 2035)
- 28.3.7. Adeno-associated Viral Vector Manufacturing Market for Metabolic Disorders: Historical Trends (since 2021) and Forecasted Estimates (till 2035)
- 28.3.8. Adeno-associated Viral Vector Manufacturing Market for Sensory Disorders: Historical Trends (since 2021) and Forecasted Estimates (till 2035)
- 28.3.9. Adeno-associated Viral Vector Manufacturing Market for Ophthalmic Disorders: Historical Trends (since 2021) and Forecasted Estimates (till
2035)
- 28.3.10. Adeno-associated Viral Vector Manufacturing Market for Dermatological Disorders: Historical Trends (since 2025) and Forecasted Estimates (till 2035)
- 28.3.11. Adeno-associated Viral Vector Manufacturing Market for Others: Historical Trends (since 2021) and Forecasted Estimates (till 2035)
- 28.4. Data Triangulation and Validation
29. ADENO-ASSOCIATED VIRAL VECTOR MANUFACTURING MARKET, BY GEOGRAPHICAL REGIONS
- 29.1. Chapter Overview
- 29.2. Key Assumptions and Methodology
- 29.3. Adeno-associated Viral Vector Manufacturing Market: Distribution by Geographical Regions, 2021, 2025 and 2035
- 29.3.1. Adeno-associated Viral Vector Manufacturing Market in North America: Historical Trends (since 2021) and Forecasted Estimates (till 2035)
- 29.3.2. Adeno-associated Viral Vector Manufacturing Market in Europe: Historical Trends (since 2021) and Forecasted Estimates (till 2035)
- 29.3.3. Adeno-associated Viral Vector Manufacturing Market in Asia-Pacific: Historical Trends (since 2021) and Forecasted Estimates (till 2035)
- 29.3.4. Adeno-associated Viral Vector Manufacturing Market in Middle East and North Africa: Historical Trends (since 2021) and Forecasted Estimates (till 2035)
- 29.3.5. Adeno-associated Viral Vector Manufacturing Market in Latin America and Rest of the World: Historical Trends (since 2021) and Forecasted Estimates (till 2035)
- 29.4. Market Dynamics Assessment
- 29.4.1. Penetration Growth (P-G) Matrix
- 29.5. Data Triangulation and Validation
30. ADENO-ASSOCIATED VIRAL VECTOR MANUFACTURING MARKET BY COMMERCIAL, CLINICAL AND PRECLINICAL STAGE PRODUCTS
- 30.1. Chapter Overview
- 30.2. Key Assumptions and Methodology
- 30.3. Key Market Segmentations
- 30.4. Adeno-associated Viral Vector Manufacturing Market for Commercial Stage Products: Historical Trends (since 2021) and Forecasted Estimates (till 2035)
- 30.4.1. Adeno-associated Viral Vector Manufacturing Market for Commercial Stage Products: Distribution by Therapeutic Area
- 30.4.2. Adeno-associated Viral Vector Manufacturing Market for Commercial Stage Products: Distribution by Route of Administration
- 30.4.3. Adeno-associated Viral Vector Manufacturing Market for Commercial Stage Products: Distribution by Geographical Regions
- 30.5. Adeno-associated Viral Vector Manufacturing Market for Clinical Stage Products: Historical Trends (since 2021) and Forecasted Estimates (till 2035)
- 30.5.1. Adeno-associated Viral Vector Manufacturing Market for Clinical Stage Products: Distribution by Phase of Development
- 30.5.2. Adeno-associated Viral Vector Manufacturing Market for Clinical Stage Products: Distribution by Therapeutic
Area
- 30.5.3. Adeno-associated Viral Vector Manufacturing Market for Clinical Stage Products: Distribution by Geographical Regions
- 30.6. Adeno-associated Viral Vector Manufacturing Market for Preclinical Stage Products, Historical Trends (since 2021) and Forecasted Estimates (till 2035)
- 30.6.1. Adeno-associated Viral Vector Manufacturing Market for Preclinical Stage Products: Distribution by Therapeutic Area
- 30.6.2. Adeno-associated Viral Vector Manufacturing Market for Preclinical Stage Products: Distribution by Animal Model Used
- 30.6.3. Adeno-associated Viral Vector Manufacturing Market for Preclinical Stage Products: Distribution by Geographical Regions
SECTION VII: OTHER EXCLUSIVE INSIGHTS
31. CONCLUDING INSIGHTS
32. EXECUTIVE INSIGHTS
SECTION VIII: APPENDICES
33. APPENDIX I: TABULATED DATA
34. APPENDIX II: LIST OF COMPANIES AND ORGANIZATIONS
List of Tables
- Table 7.1 Adeno-associated Viral Vector Based Therapy Market: Information on Developer, Status of Development, Target Indication, Therapeutic Area, Type of Gene / Molecule Targeted, Gene Delivery Method, Route of Administration and Type of Therapy
- Table 7.2 Adeno-associated Viral Vector Based Therapy Market: Information on Special Designation Awarded
- Table 7.3 List of Adeno-associated Viral Vector Based Therapy Developers
- Table 8.1 Adeno-associated Viral Vector Manufacturers: Information on Year of Establishment, Company Size, Location of Headquarters and Type of Product Manufactured
- Table 8.2 Adeno-associated Viral Vector Manufacturers: Information on Type of Vector Manufactured, Scale of Operation and Type of Manufacturer
- Table 8.3 Adeno-associated Viral Vector Manufacturers: Information on Location of Manufacturing Facility and Application Area
- Table 9.1 Adeno-associated Viral Vector Manufacturing Technologies / Platforms: Information on Technology Provider, Type of Vector Manufactured and Type of Viral Vector Manufactured
- Table 9.2 Adeno-associated Viral Vector Manufacturing Technologies / Platforms: Information on Scale of Operation, Application Area and Therapeutic Area
- Table 9.3 Adeno-associated Viral Vector Manufacturing Technology / Platform Providers: Information on Year of Establishment, Company Size and Headquarters
- Table 10.1 Company Competitiveness Scores Allotted to Manufacturers Headquartered in North America (Peer Group I)
- Table 10.2 Company Competitiveness Scores Allotted to Manufacturers based in Europe (Peer Group II)
- Table 10.3 Company Competitiveness Scores Allotted to Manufacturers based in Asia-Pacific (Peer Group III)
- Table 12.1 List of Marketed Adeno-associated Vector Based Therapies Profiled
- Table 12.2 Sarepta Therapeutics: Company Overview
- Table 12.3 Elevidys: Current Status of Development
- Table 12.4 uniQure: Company Overview
- Table 12.5 Hemgenix: Current Status of Development
- Table 12.6 PTC Therapeutics: Company Overview
- Table 12.7 KEBILIDI: Current Status of Development
- Table 12.8 Spark Therapeutics: Company Overview
- Table 12.9 Luxturna: Current Status of Development
- Table 12.10 BioMarin Pharmaceutical: Company Overview
- Table 12.11 Roctavian: Current Status of Development
- Table 12.12 Novartis: Company Overview
- Table 12.13 Zolgensma: Current Status of Development
- Table 13.1 AAV Vector Service Providers: List of Companies Profiled
- Table 13.2 Astellas Pharma: Company Overview
- Table 13.3 Astellas Pharma: Vector Manufacturing Related Capabilities
- Table 13.4 Astellas Pharma: Recent Developments and Future Outlook
- Table 13.5 Charles River Laboratories: Company Overview
- Table 13.6 Charles River Laboratories: Vector Manufacturing Related Capabilities
- Table 13.7 Charles River Laboratories: Recent Developments and Future Outlook
- Table 13.8 Cytiva: Company Overview
- Table 13.9 Cytiva: Vector Manufacturing Related Capabilities
- Table 13.10 Cytiva: Recent Developments and Future Outlook
- Table 13.11 Lonza: Company Overview
- Table 13.12 Lonza: Vector Manufacturing Related Capabilities
- Table 13.13 Lonza: Recent Developments and Future Outlook
- Table 13.14 Patheon Pharma Services: Company Overview
- Table 13.15 Patheon Pharma Services: Vector Manufacturing Related Capabilities
- Table 13.16 Thermo Fisher Scientific (Parent Company of Patheon Pharma Services): Recent Developments and Future Outlook
- Table 13.17 Sanofi: Company Overview
- Table 13.18 Sanofi: Vector Manufacturing Related Capabilities
- Table 13.19 Sanofi: Recent Developments and Future Outlook
- Table 13.20 WuXi AppTec: Company Overview
- Table 13.21 WuXi AppTec: Vector Manufacturing Related Capabilities
- Table 13.22 WuXi AppTec: Recent Developments and Future Outlook
- Table 15.1 Adeno-associated Viral Vector Based Therapy Developers: List of Partnerships and Collaborations, since 2022
- Table 15.2 Adeno-associated Viral Vector Based Therapy Developers: Information on Therapeutic Area
- Table 15.3 Adeno-associated Viral Vector Based Therapy Developers: Information on Type of Agreement
- Table 15.4 Adeno-associated Viral Vector Manufacturers: List of Partnerships and Collaborations, since 2022
- Table 15.5 Adeno-associated Viral Vector Manufacturers: Information on Therapeutic Area
- Table 15.6 Adeno-associated Viral Vector Manufacturers: Information on Application Area
- Table 15.7 Adeno-associated Viral Vector Manufacturers: Information on Type of Agreement
- Table 16.1 Adeno-associated Viral Vector Based Therapy Manufacturers: Most Likely Partners
- Table 16.2 Adeno-associated Viral Vector Based Therapy Manufacturers: Likely Partners
- Table 16.3 Adeno-associated Viral Vector Based Therapy Manufacturers: Less Likely Partners
- Table 16.4 Adeno-associated Viral Vector Based Therapy Manufacturers: Least Likely Partners
- Table 17.1 Patent Analysis: Top CPC Sections
- Table 17.2 Patent Analysis: Top CPC Symbols
- Table 17.3 Patent Analysis: Top CPC Codes
- Table 17.4 Patent Analysis: Summary of Benchmarking Analysis
- Table 17.5 Patent Analysis: Categorization based on Weighted Valuation Scores
- Table 17.6 Patent Portfolio: List of Leading Patents (by Highest Relative Valuation)
- Table 17.7 Patent Portfolio: List of Leading Patents (by Number of Citations)
- Table 18.1 List of Start-ups Developing Adeno-associated Viral Vectors
- Table 25.1 Luxturna: Net Present Value (USD Million)
- Table 25.2 Luxturna: Value Creation Analysis (USD Million)
- Table 25.3 Hemgenix: Net Present Value (USD Million)
- Table 25.4 Hemgenix: Value Creation Analysis (USD Million)
- Table 25.5 Zolgensma: Net Present Value (USD Million)
- Table 25.6 Zolgensma: Value Creation Analysis (USD Million)
- Table 25.7 Roctavian: Net Present Value (USD Million)
- Table 25.8 Roctavian: Value Creation Analysis (USD Million)
- Table 25.9 Elevidys: Net Present Value (USD Million)
- Table 25.10 Elevidys: Value Creation Analysis (USD Million)
- Table 25.11 Upstaza: Net Present Value (USD Million)
- Table 25.12 Upstaza: Value Creation Analysis (USD Million)
- Table 25.13 EB 101: Net Present Value (USD Million)
- Table 25.14 EB 101: Value Creation Analysis (USD Million)
- Table 25.15 BBM H901: Net Present Value (USD Million)
- Table 25.16 BBM H901: Value Creation Analysis (USD Million)
- Table 25.17 RGX-121: Net Present Value (USD Million)
- Table 25.18 RGX-121: Value Creation Analysis (USD Million)
- Table 32.1 Andelyn Bioscience: Organization Snapshot
- Table 32.2 University of Florida: Organization Snapshot
- Table 32.3 Boston College: Organization Snapshot
- Table 33.1 Adeno-associated Viral Vector Based Therapies: Distribution by Status of Development
- Table 33.2 Adeno-associated Viral Vector Based Therapies: Distribution by Therapeutic Area
- Table 33.3 Adeno-associated Viral Vector Based Therapies: Distribution by Status of Development and Therapeutic Area
- Table 33.4 Adeno-associated Viral Vector Based Therapies: Distribution by Type of Gene / Molecule Targeted
- Table 33.5 Adeno-associated Viral Vector Based Therapies: Distribution by Type of Therapy
- Table 33.6 Adeno-associated Viral Vector Based Therapies: Distribution by Type of Gene Delivery Method Used
- Table 33.7 Adeno-associated Viral Vector Based Therapies: Distribution by Route of Administration
- Table 33.8 Adeno-associated Viral Vector Based Therapies: Distribution by Special Designation Awarded
- Table 33.9 Adeno-associated Viral Vector Based Therapy Developers: Distribution by Year of Establishment
- Table 33.10 Adeno-associated Viral Vector Based Therapy Developers: Distribution by Company Size
- Table 33.11 Adeno-associated Viral Vector Based Therapy Developers: Distribution by Location of Headquarters (Region)
- Table 33.12 Adeno-associated Viral Vector Based Therapy Developers: Distribution by Company Size and Location of Headquarters (Region)
- Table 33.13 Most Active Developers: Distribution by Number of Therapies Developed
- Table 33.14 Adeno-associated Viral Vector Manufacturers: Distribution by Year of Establishment
- Table 33.15 Adeno-associated Viral Vector Manufacturers: Distribution by Company Size
- Table 33.16 Adeno-associated Viral Vector Manufacturers: Distribution by Location of Headquarters (Region)
- Table 33.17 Adeno-associated Viral Vector Manufacturers: Distribution by Type of Product Manufactured
- Table 33.18 Adeno-associated Viral Vector Manufacturers: Distribution by Type of Vector Manufactured
- Table 33.19 Adeno-associated Viral Vector Manufacturers: Distribution by Scale of Operation
- Table 33.20 Adeno-associated Viral Vector Manufacturers: Distribution by Type of Manufacturer
- Table 33.21 Adeno-associated Viral Vector Manufacturers: Distribution by Location of Manufacturing Facilities (Region)
- Table 33.22 Adeno-associated Viral Vector Manufacturers: Distribution by Location of Manufacturing Facilities (Country)
- Table 33.23 Adeno-associated Viral Vector Manufacturers: Distribution by Application Area
- Table 33.24 Adeno-associated Viral Vector Manufacturing Technologies / Platforms: Distribution by Type of Vector Manufactured
- Table 33.25 Adeno-associated Viral Vector Manufacturing Technologies / Platforms: Distribution by Type of Viral Vector Manufactured
- Table 33.26 Adeno-associated Viral Vector Manufacturing Technologies / Platforms: Distribution by Scale of Operation
- Table 33.27 Adeno-associated Viral Vector Manufacturing Technologies / Platforms: Distribution by Application Area
- Table 33.28 Adeno-associated Viral Vector Manufacturing Technologies / Platforms: Distribution by Therapeutic Area
- Table 33.29 Adeno-associated Viral Vector Technology / Platform Providers: Distribution by Year of Establishment
- Table 33.30 Adeno-associated Viral Vector Technology / Platform Providers: Distribution by Company Size
- Table 33.31 Adeno-associated Viral Vector Technology / Platform Providers: Distribution by Location of Headquarters (Region)
- Table 33.32 Adeno-associated Viral Vector Technology / Platform Providers: Distribution by Location of Headquarters (Country)
- Table 33.33 Adeno-associated Viral Vector Technology / Platform Providers: Distribution by Company Size and Location of Headquarters
- Table 33.34 Most Active Players: Distribution by Number of Technologies / Platforms
- Table 33.35 Astellas Pharma: Annual Revenues, since FY 2021 (YEN Billion)
- Table 33.36 Charles River Laboratories: Annual Revenues, since FY 2021 (USD Billion)
- Table 33.37 Lonza: Annual Revenues, since FY 2021 (CHF Billion)
- Table 33.38 Thermo Fisher Scientific (Parent Company of Patheon Pharma Services): Annual Revenues, since FY 2021 (USD Billion)
- Table 33.39 Sanofi: Annual Revenues, since FY 2021 (EUR Billion)
- Table 33.40 WuXi AppTec: Annual Revenues, since FY 2021 (RMB Billion)
- Table 33.41 Clinical Trial Analysis: Cumulative Year-wise Trend by Trial Registration Year. Since 2020
- Table 33.42 Clinical Trial Analysis: Distribution of Patients Enrolled by Trial Registration Year, since 2020
- Table 33.43 Clinical Trial Analysis: Distribution by Trial Phase
- Table 33.44 Clinical Trial Analysis: Distribution by Trial Phase and Number of Patients Enrolled
- Table 33.45 Clinical Trial Analysis: Distribution by Trial Status
- Table 33.46 Clinical Trial Analysis: Cumulative Year-wise Trend by Trial Status
- Table 33.47 Clinical Trial Analysis: Distribution by Enrolled Patient Population and Trial Status
- Table 33.48 Clinical Trial Analysis: Distribution by Target Patient Population
- Table 33.49 Clinical Trial Analysis: Distribution by Patient Gender
- Table 33.50 Clinical Trial Analysis: Distribution by Type of Sponsor / Collaborator
- Table 33.51 Clinical Trial Analysis: Distribution by Type of Patient Allocation Model Used
- Table 33.52 Clinical Trial Analysis: Distribution by Type of Trial Masking Adopted
- Table 33.53 Clinical Trial Analysis: Distribution by Type of Intervention Model
- Table 33.54 Clinical Trial Analysis: Distribution by Trial Purpose
- Table 33.55 Most Active Industry Players: Distribution by Number of Clinical Trials Sponsored / Collaborated
- Table 33.56 Most Active Non-Industry Players: Distribution by Number of Clinical Trials Sponsored / Collaborated
- Table 33.57 Clinical Trial Analysis: Distribution of Clinical Trials by Geography
- Table 33.58 Clinical Trial Analysis: Distribution of Clinical Trials by Geography and Trial Status
- Table 33.59 Clinical Trial Analysis: Distribution of Patients Enrolled by Geography and Trial Status
- Table 33.60 Clinical Trial Analysis: Distribution of Clinical Trials by Geography, Trial Status and Trial Phase
- Table 33.61 Adeno-associated Viral Vector Based Therapy Developers: Cumulative Year-wise Trend, since 2017
- Table 33.62 Adeno-associated Viral Vector Based Therapy Developers: Distribution by Type of Partnership
- Table 33.63 Adeno-associated Viral Vector Based Therapy Developers: Distribution by Year of Partnership and Type of Partnership, since 2022
- Table 33.64 Adeno-associated Viral Vector Based Therapy Developers: Distribution by Year of Partnership and Type of Partner, since 2022
- Table 33.65 Adeno-associated Viral Vector Based Therapy Developers: Distribution by Type of Partnership and Type of Partner
- Table 33.66 Adeno-associated Viral Vector Based Therapy Developers: Distribution by Therapeutic Area
- Table 33.67 Most Active Players: Distribution by Number of Partnerships
- Table 33.68 Adeno-associated Viral Vector Based Therapy Developers: Distribution by Country
- Table 33.69 Adeno-associated Viral Vector Based Therapy Developers: Distribution by Region
- Table 33.70 Adeno-associated Viral Vector Manufacturers: Cumulative Year-wise Trend, since 2017
- Table 33.71 Adeno-associated Viral Vector Manufacturers: Distribution by Type of Partnership
- Table 33.72 Adeno-associated Viral Vector Manufacturers: Distribution by Year and Type of Partnership, since 2022
- Table 33.73 Adeno-associated Viral Vector Manufacturers: Distribution by Year of Partnership and Type of Partner
- Table 33.74 Adeno-associated Viral Vector Manufacturers: Distribution by Type of Partnership and Type of Partner
- Table 33.75 Adeno-associated Viral Vector Manufacturers: Distribution by Therapeutic Area
- Table 33.76 Adeno-associated Viral Vector Manufacturers: Distribution by Application Area
- Table 33.77 Most Active Players: Distribution by Number of Partnerships
- Table 33.78 Adeno-associated Viral Vector Manufacturers: Distribution by Country
- Table 33.79 Adeno-associated Viral Vector Manufacturers: Distribution by Region
- Table 33.80 Patent Analysis: Distribution by Type of Patent
- Table 33.81 Patent Analysis: Distribution by Patent Application Year, since pre-2019
- Table 33.82 Patent Analysis: Distribution by Publication Year, since 2021
- Table 33.83 Patent Analysis: Type of Patent and Publication Year
- Table 33.84 Patent Analysis: Distribution by Patent Jurisdiction
- Table 33.85 Patent Analysis: Cumulative Year-wise Distribution by Type of Applicant, since 2021
- Table 33.86 Leading Industry Players: Distribution by Number of Patents
- Table 33.87 Leading Non-Industry Players: Distribution by Number of Patents
- Table 33.88 Leading Patent Assignees: Distribution by Number of Patents
- Table 33.89 Patent Valuation: Distribution of Patents by Age
- Table 33.90 Adeno-associated Viral Vectors: Patent Valuation
- Table 33.91 Start-up Health Indexing: Distribution by Location of Headquarters
- Table 33.92 Start-up Health Indexing: Distribution by Pipeline Strength
- Table 33.93 Start-up Health Indexing: Distribution by Pipeline Maturity
- Table 33.94 Start-up Health Indexing: Distribution by Indication Diversity
- Table 33.95 Analysis of Start-ups: Distribution by Patent Strength
- Table 33.96 Start-up Health Indexing: Distribution by Partnership Activity
- Table 33.97 Global Adeno-associated Viral Vector Based Therapeutics Market, Historical Trends (since 2021) and Forecasted Estimates (till 2035) (USD Million)
- Table 33.98 Global Adeno-associated Viral Vector Based Therapeutics Market, Forecasted Estimates (till 2035), Conservative Scenario (USD Million)
- Table 33.99 Global Adeno-associated Viral Vector Based Therapeutics Market Forecasted Estimates (till 2035) Optimistic Scenario (USD Million)
- Table 33.100 Adeno-associated Viral Vector Based Therapeutics Market: Distribution by Therapeutic Area
- Table 33.101 Adeno-associated Viral Vector Based Therapeutics Market for Muscle-related Disorders, Historical Trends (since 2023) and Forecasted Estimates (till 2035), Conservative, Base and Optimistic Scenarios (USD Million)
- Table 33.102 Adeno-associated Viral Vector Based Therapeutics Market for Genetic Disorders, Historical Trends (since 2021) and Forecasted Estimates (till 2035), Conservative, Base and Optimistic Scenarios (USD Million)
- Table 33.103 Adeno-associated Viral Vector Based Therapeutics Market for Hematological Disorders, Historical Trends (since 2023) and Forecasted Estimates (till 2035), Conservative, Base and Optimistic Scenarios (USD Million)
- Table 33.104 Adeno-associated Viral Vector Based Therapeutics Market for Ophthalmic Disorders, Historical Trends (since 2021) and Forecasted Estimates (till 2035), Conservative, Base and Optimistic Scenarios (USD Million)
- Table 33.105 Adeno-associated Viral Vector Based Therapeutics Market for Dermatological Disorders, Forecasted Estimates (till 2035), Conservative, Base and Optimistic Scenarios (USD Million)
- Table 33.106 Adeno-associated Viral Vector Based Therapeutics Market for Metabolic Disorders, Forecasted Estimates (till 2035), Conservative, Base and Optimistic Scenarios (USD Million)
- Table 33.107 Adeno-associated Viral Vector Based Therapeutics Market: Distribution by Type of Therapy
- Table 33.108 Adeno-associated Viral Vector Based Therapeutics Market for Gene Augmentation Therapy, Historical Trends (since 2021) and Forecasted Estimates (till 2035), Conservative, Base and Optimistic Scenarios (USD Million)
- Table 33.109 Adeno-associated Viral Vector Based Therapeutics Market for Gene Regulation Therapy, Forecasted Estimates (till 2035), Conservative, Base and Optimistic Scenarios (USD Million)
- Table 33.110 Adeno-associated Viral Vector Based Therapeutics Market: Distribution by Route of Administration
- Table 33.111 Adeno-associated Viral Vector Based Therapeutics Market for Intravenous Route, Historical Trends (since 2021) and Forecasted Estimates (till 2035), Conservative, Base and Optimistic Scenarios (USD Million)
- Table 33.112 Adeno-associated Viral Vector Based Therapeutics Market for Subretinal Route, Historical Trends (since 2021) and Forecasted Estimates (till 2035), Conservative, Base and Optimistic Scenarios (USD Million)
- Table 33.113 Adeno-associated Viral Vector Based Therapeutics Market for Intravitreal Route, Historical Trends (since 2022) and Forecasted Estimates (till 2035), Conservative, Base and Optimistic Scenarios (USD Million)
- Table 33.114 Adeno-associated Viral Vector Based Therapeutics Market for Other Routes, Historical Trends (since 2022) and Forecasted Estimates (till 2035), Conservative, Base and Optimistic Scenarios (USD Million)
- Table 33.115 Adeno-associated Viral Vector Based Therapeutics Market: Distribution by Geographical Regions
- Table 33.116 Adeno-associated Viral Vector Based Therapeutics Market in North America, Historical Trends (since 2021) and Forecasted Estimates (till 2035), Conservative, Base and Optimistic Scenarios (USD Million)
- Table 33.117 Adeno-associated Viral Vector Based Therapeutics Market in Europe, Forecasted Historical Trends (since 2021) and Forecasted Estimates (till 2035), Conservative, Base and Optimistic Scenarios (USD
- Table 33.118 Adeno-associated Viral Vector Based Therapeutics Market in Asia-Pacific, Historical Trends (since 2021) and Forecasted Estimates (till 2035), Conservative, Base and Optimistic Scenarios (USD Million)
- Table 33.119 Adeno-associated Viral Vector Based Therapeutics Market for Latin America and Rest of the World, Historical Trends (since 2021) and Forecasted Estimates (till 2035), Conservative, Base and Optimistic Scenarios (USD Million)
- Table 33.120 Adeno-associated Vector Based Therapeutics Market: Luxturna Sales Forecast, till 2035 (USD Million)
- Table 33.121 Adeno-associated Vector Based Therapeutics Market: Hemgenix Sales Forecast, till 2035 (USD Million)
- Table 33.122 Adeno-associated Vector Based Therapeutics Market: Zolgensma Sales Forecast, till 2035 (USD Million)
- Table 33.123 Adeno-associated Vector Based Therapeutics Market: Roctavian Sales Forecast, till 2035 (USD Million)
- Table 33.124 Adeno-associated Vector Based Therapeutics Market: Elevidys Sales Forecast, till 2035 (USD Million)
- Table 33.125 Adeno-associated Vector Based Therapeutics Market: Upstaza Sales Forecast, till 2035 (USD Million)
- Table 33.126 Adeno-associated Vector Based Therapeutics Market: EB 101 Sales Forecast, till 2035 (USD Million)
- Table 33.127 Adeno-associated Vector Based Therapeutics Market: BBM H901 Sales Forecast, till 2035 (USD Million)
- Table 33.128 Adeno-associated Vector Based Therapeutics Market: AGTC 501 Sales Forecast, till 2035 (USD Million)
- Table 33.129 Adeno-associated Vector Based Therapeutics Market: Lumevoq Sales Forecast, till 2025 (USD Million)
- Table 33.130 Adeno-associated Vector Based Therapeutics Market: NFS-01 Sales Forecast, till 2035 (USD Million)
- Table 33.131 Adeno-associated Vector Based Therapeutics Market: RGX-314 Sales Forecast, till 2035 (USD Million)
- Table 33.132 Adeno-associated Vector Based Therapeutics Market: SPK-8011 Sales Forecast, till 2035 (USD Million)
- Table 33.133 Adeno-associated Vector Based Therapeutics Market: Giroctocogene fitelparvovec Sales Forecast, till 2035 (USD Million)
- Table 33.134 Adeno-associated Vector Based Therapeutics Market: RGX-121 Sales Forecast, till 2035 (USD Million)
- Table 33.135 Adeno-associated Vector Based Therapeutics Market: DTx-401 Sales Forecast, till 2035 (USD Million)
- Table 33.136 Adeno-associated Vector Based Therapeutics Market: DTx-301 Sales Forecast, till 2035 (USD Million)
- Table 33.137 Adeno-associated Vector Based Therapeutics Market: ABO-102 Sales Forecast, till 2035 (USD Million)
- Table 33.138 Adeno-associated Vector Based Therapeutics Market: AAV-RPE65 Sales Forecast, till 2035 (USD Million)
- Table 33.139 Adeno-associated Vector Based Therapeutics Market: Ixoberogene Soroparvovec Sales Forecast, till 2035 (USD Million)
- Table 33.140 Adeno-associated Vector Based Therapeutics Market: OCU400 Sales Forecast, till 2035 (USD Million)
- Table 33.141 Global Adeno-associated Viral Vector Based Manufacturing Market, Historical Trends (since 2021) and Forecasted Estimates (till 2035) (USD Million)
- Table 33.142 Global Adeno-associated Viral Vector Based Manufacturing Market, Forecasted Estimates (till 2035), Conservative Scenario (USD Million)
- Table 33.143 Global Adeno-associated Viral Vector Based Manufacturing Market Forecasted Estimates (till 2035) Optimistic Scenario (USD Million)
- Table 33.144 Adeno-associated Viral Vector Based Manufacturing Market: Distribution by Stage of Development
- Table 33.145 Adeno-associated Viral Vector Based Manufacturing Market for Commercial Stage Products, Historical Trends (since 2021) and Forecasted Estimates (till 2035), Conservative, Base and Optimistic Scenarios (USD Million)
- Table 33.146 Adeno-associated Viral Vector Based Manufacturing Market for Clinical Stage Products, Historical Trends (since 2021) and Forecasted Estimates (till 2035), Conservative, Base and Optimistic Scenarios (USD Million)
- Table 33.147 Adeno-associated Viral Vector Based Manufacturing Market for Preclinical Stage Products, Historical Trends (since 2021) and Forecasted Estimates (till 2035), Conservative, Base and Optimistic Scenarios (USD Million)
- Table 33.148 Adeno-associated Viral Vector Based Manufacturing Market: Distribution by Therapeutic Area
- Table 33.149 Adeno-associated Viral Vector Based Manufacturing Market for Oncological Disorders, Historical Trends (since 2021) and Forecasted Estimates (till 2035), Conservative, Base and Optimistic Scenarios (USD Million)
- Table 33.150 Adeno-associated Viral Vector Based Manufacturing Market for Rare Disorders, Historical Trends (since 2021) and Forecasted Estimates (till 2035), Conservative, Base and Optimistic Scenarios (USD Million)
- Table 33.151 Adeno-associated Viral Vector Based Manufacturing Market for Musculoskeletal Disorders, Historical Trends (since 2021) and Forecasted Estimates (till 2035), Conservative, Base and Optimistic Scenarios (USD Million)
- Table 33.152 Adeno-associated Viral Vector Based Manufacturing Market for Genetic Disorders, Historical Trends (since 2021) and Forecasted Estimates (till 2035), Conservative, Base and Optimistic Scenarios (USD Million)
- Table 33.153 Adeno-associated Viral Vector Based Manufacturing Market for Hematological Disorders, Historical Trends (since 2021) and Forecasted Estimates (till 2035), Conservative, Base and Optimistic Scenarios (USD Million)
- Table 33.154 Adeno-associated Viral Vector Based Manufacturing Market for Neurological Disorders, Historical Trends (since 2021) and Forecasted Estimates (till 2035), Conservative, Base and Optimistic Scenarios (USD Million)
- Table 33.155 Adeno-associated Viral Vector Based Manufacturing Market for Metabolic Disorders, Historical Trends (since 2021) and Forecasted Estimates (till 2035), Conservative, Base and Optimistic Scenarios (USD Million)
- Table 33.156 Adeno-associated Viral Vector Based Manufacturing Market for Sensory Disorders, Historical Trends (since 2021) and Forecasted Estimates (till 2035), Conservative, Base and Optimistic Scenarios (USD Million)
- Table 33.157 Adeno-associated Viral Vector Based Manufacturing Market for Ophthalmic Disorders, Historical Trends (since 2021) and Forecasted Estimates (till 2035), Conservative, Base and Optimistic Scenarios (USD Million)
- Table 33.158 Adeno-associated Viral Vector Based Manufacturing Market for Dermatological Disorders, Forecasted Estimates (till 2035), Conservative, Base and Optimistic Scenarios (USD Million)
- Table 33.159 Adeno-associated Viral Vector Based Manufacturing Market for Others, Historical Trends (since 2021) and Forecasted Estimates (till 2035), Conservative, Base and Optimistic Scenarios (USD Million)
- Table 33.160 Adeno-associated Viral Vector Based Manufacturing Market: Distribution by Geographical Regions
- Table 33.161 Adeno-associated Viral Vector Based Manufacturing Market in North America, Historical Trends (since 2021) and Forecasted Estimates (till 2035), Conservative, Base and Optimistic Scenarios (USD Million)
- Table 33.162 Adeno-associated Viral Vector Based Manufacturing Market in Europe, Historical Trends (since 2021) and Forecasted Estimates (till 2035), Conservative, Base and Optimistic Scenarios (USD Million)
- Table 33.163 Adeno-associated Viral Vector Based Manufacturing Market in Asia-Pacific, Historical Trends (since 2021) and Forecasted Estimates (till 2035), Conservative, Base and Optimistic Scenarios (USD Million)
- Table 33.164 Adeno-associated Viral Vector Based Manufacturing Market in Middle east and North Africa, Historical Trends (since 2021) and Forecasted Estimates (till 2035), Conservative, Base and Optimistic Scenarios (USD Million)
- Table 33.165 Adeno-associated Viral Vector Based Manufacturing Market in Latin America and Rest of the World, Historical Trends (since 2021) and Forecasted Estimates (till 2035), Conservative, Base and Optimistic Scenarios (USD Million)
- Table 33.166 Adeno-associated Viral Vector Based Manufacturing Market: Distribution by Commercial, Clinical and Preclinical Stage Products
- Table 33.167 Adeno-associated Viral Vector Based Manufacturing Market for Commercial Stage Products, Historical Trends (since 2021) and Forecasted Estimates (till 2035), Conservative, Base and Optimistic Scenarios (USD Million)
- Table 33.168 Adeno-associated Viral Vector Based Manufacturing Market for Commercial Stage Products: Distribution by Therapeutic Area
- Table 33.169 Adeno-associated Viral Vector Based Manufacturing Market for Commercial Stage Products: Distribution by Route of Administration
- Table 33.170 Adeno-associated Viral Vector Based Manufacturing Market for Commercial Stage Products: Distribution by Geographical Regions
- Table 33.171 Adeno-associated Viral Vector Based Manufacturing Market for Clinical Stage Products, Historical Trends (since 2021) and Forecasted Estimates (till 2035), Conservative, Base and Optimistic Scenarios (USD Million)
- Table 33.172 Adeno-associated Viral Vector Based Manufacturing Market for Clinical Stage Products: Distribution by Phase of Development
- Table 33.173 Adeno-associated Viral Vector Based Manufacturing Market for Clinical Stage Products: Distribution by Therapeutic Area
- Table 33.174 Adeno-associated Viral Vector Based Manufacturing Market for Clinical Stage Products: Distribution by Geographical Regions
- Table 33.175 Adeno-associated Viral Vector Based Manufacturing Market for Preclinical Stage Products, Historical Trends (since 2021) and Forecasted Estimates (till 2035), Conservative, Base and Optimistic Scenarios (USD Million)
- Table 33.176 Adeno-associated Viral Vector Based Manufacturing Market for Preclinical Stage Products: Distribution by Therapeutic Area
- Table 33.177 Adeno-associated Viral Vector Based Manufacturing Market for Preclinical Stage Products: Distribution by Animal Model Used
- Table 33.178 Adeno-associated Viral Vector Based Manufacturing Market for Preclinical Stage Products: Distribution by Geographical Region
List of Figures
- Figure 2.1 Research Methodology: Project Methodology
- Figure 2.2 Research Methodology: Data Sources for Secondary Research
- Figure 2.3 Research Methodology: Robust Quality Control
- Figure 3.1 Market Dynamics: Forecast Methodology
- Figure 3.2 Market Dynamics: Market Assessment Framework
- Figure 4.1 Lessons Learnt from Past Recessions
- Figure 5.1 Executive Summary: Market Landscape
- Figure 5.2 Executive Summary: Market Trends
- Figure 5.3 Executive Summary: Market Forecast and Opportunity Analysis
- Figure 6.1 Classification of Vectors
- Figure 6.2 Structure of Adeno-associated Viral Vector
- Figure 6.3 Lytic Cycle of Adeno-associated Viral Vector
- Figure 6.4 Lysogenic Cycle of Adeno-associated Viral Vector
- Figure 7.1 Adeno-associated Viral Vector Based Therapies: Distribution by Status of Development
- Figure 7.2 Adeno-associated Viral Vector Based Therapies: Distribution by Therapeutic Area
- Figure 7.3 Adeno-associated Viral Vector Based Therapies: Distribution by Status of Development and Therapeutic Area
- Figure 7.4 Adeno-associated Viral Vector Based Therapies: Distribution by Type of Gene / Molecule Targeted
- Figure 7.5 Adeno-associated Viral Vector Based Therapies: Distribution by Type of Therapy
- Figure 7.6 Adeno-associated Viral Vector Based Therapies: Distribution by Type of Gene Delivery Method Used
- Figure 7.7 Adeno-associated Viral Vector Based Therapies: Distribution by Route of Administration
- Figure 7.8 Adeno-associated Viral Vector Based Therapies: Distribution by Special Designation Awarded
- Figure 7.9 Adeno-associated Viral Vector Based Therapy Developers: Distribution by Year of Establishment
- Figure 7.10 Adeno-associated Viral Vector Based Therapy Developers: Distribution by Company Size
- Figure 7.11 Adeno-associated Viral Vector Based Therapy Developers: Distribution by Location of Headquarters (Region)
- Figure 7.12 Adeno-associated Viral Vector Based Therapy Developers: Distribution by Company Size and Location of Headquarters (Region)
- Figure 7.13 Most Active Developers: Distribution by Number of Therapies Developed
- Figure 8.1 Adeno-associated Viral Vector Manufacturers: Distribution by Year of Establishment
- Figure 8.2 Adeno-associated Viral Vector Manufacturers: Distribution by Company Size
- Figure 8.3 Adeno-associated Viral Vector Manufacturers: Distribution by Location of Headquarters
- Figure 8.4 Adeno-associated Viral Vector Manufacturers: Distribution by Type of Product Manufactured
- Figure 8.5 Adeno-associated Viral Vector Manufacturers: Distribution by Type of Vector Manufactured
- Figure 8.6 Adeno-associated Viral Vector Manufacturers: Distribution by Scale of Operation
- Figure 8.7 Adeno-associated Viral Vector Manufacturers: Distribution by Type of Manufacturer
- Figure 8.8 Adeno-associated Viral Vector Manufacturers: Distribution by Type of Manufacturer and Company Size
- Figure 8.9 Adeno-associated Viral Vector Manufacturers: Distribution by Location of Manufacturing Facilities (Region)
- Figure 8.10 Adeno-associated Viral Vector Manufacturers: Distribution by Location of Manufacturing Facilities (Country)
- Figure 8.11 Adeno-associated Viral Vector Manufacturers: Distribution by Application Area
- Figure 9.1 Adeno-associated Viral Vector Manufacturing Technologies / Platforms: Distribution by Type of Vector Manufactured
- Figure 9.2 Adeno-associated Viral Vector Manufacturing Technologies / Platforms: Distribution by Type of Viral Vector Manufactured
- Figure 9.3 Adeno-associated Viral Vector Manufacturing Technologies / Platforms: Distribution by Scale of Operation
- Figure 9.4 Adeno-associated Viral Vector Manufacturing Technologies / Platforms: Distribution by Application Area
- Figure 9.5 Adeno-associated Viral Vector Manufacturing Technologies / Platforms: Distribution by Therapeutic Area
- Figure 9.6 Adeno-associated Viral Vector Technology / Platform Providers: Distribution by Year of Establishment
- Figure 9.7 Adeno-associated Viral Vector Technology Platform Providers: Distribution by Company Size
- Figure 9.8 Adeno-associated Viral Vector Technology / Platform Providers: Distribution by Location of Headquarters (Region)
- Figure 9.9 Adeno-associated Viral Vector Technology / Platform Providers: Distribution by Location of Headquarters (Country)
- Figure 9.10 Adeno-associated Viral Vector Technology / Platform Providers: Distribution by Company Size and Location of Headquarters
- Figure 9.11 Most Active Players: Distribution by Number of Technologies / Platforms
- Figure 10.1 Company Competitiveness Analysis: Overview of Peer Group I
- Figure 10.2 Company Competitiveness Analysis: Overview of Peer Group II
- Figure 10.3 Company Competitiveness Analysis: Overview of Peer Group III
- Figure 10.4 Company Competitiveness Analysis: Adeno-associated Viral Vector Manufacturers Headquartered in North America (Peer Group I)
- Figure 10.5 Company Competitiveness Analysis: Adeno-associated Viral Vector Manufacturers Headquartered in Europe (Peer Group II)
- Figure 10.6 Company Competitiveness Analysis: Adeno-associated Viral Vector Manufacturers Headquartered in Asia-Pacific (Peer Group III)
- Figure 11.1 Technology Competitiveness Analysis: Overview of Peer Group I
- Figure 11.2 Technology Competitiveness Analysis: Overview of Peer Group II
- Figure 11.3 Technology Competitiveness Analysis: Adeno-associated Viral Vector Technologies / Platforms Provided by Companies Headquartered in North America (Peer Group I)
- Figure 11.4 Technology Competitiveness Analysis: Adeno-associated Viral Vector Technologies / Platforms Provided by Companies Headquartered in Europe and Asia-Pacific (Peer Group II)
- Figure 12.1 Elevidys: Development Timeline
- Figure 12.2 Hemgenix: Development Timeline
- Figure 12.3 KEBILIDI: Development Timeline
- Figure 12.4 Luxturna: Development Timeline
- Figure 12.5 Roctavian: Development Timeline
- Figure 12.6 Zolgensma: Development Timeline
- Figure 13.1 Astellas Pharma: Annual Revenues, since FY 2021 (YEN Billion)
- Figure 13.2 Charles River Laboratories: Annual Revenues, since FY 2021 (USD Billion)
- Figure 13.3 Lonza: Annual Revenues, since FY 2021 (CHF Billion)
- Figure 13.4 Thermo Fisher Scientific (Parent Company of Patheon Pharma Services): Annual Revenues, since FY 2021 (USD Billion)
- Figure 13.5 Sanofi: Annual Revenues, since FY 2021 (EUR Billion)
- Figure 13.6 WuXi AppTec: Annual Revenues, since FY 2021 (RMB Billion)
- Figure 14.1 Clinical Trial Analysis: Cumulative Distribution by Trial Registration Year, since 2020
- Figure 14.2 Clinical Trial Analysis: Distribution of Patients Enrolled by Trial Registration Year, since 2020
- Figure 14.3 Clinical Trial Analysis: Distribution by Trial Phase
- Figure 14.4 Clinical Trial Analysis: Distribution of Patients Enrolled by Trial Phase
- Figure 14.5 Clinical Trial Analysis: Distribution by Trial Status
- Figure 14.6 Clinical Trial Analysis: Cumulative Year-wise Trend by Trial Status
- Figure 14.7 Clinical Trial Analysis: Distribution of Patient Enrolled by Trial Status
- Figure 14.8 Clinical Trial Analysis: Distribution by Target Patient Population
- Figure 14.9 Clinical Trial Analysis: Distribution by Patient Gender
- Figure 14.10 Clinical Trial Analysis: Distribution by Type of Sponsor / Collaborator
- Figure 14.11 Clinical Trial Analysis: Distribution by Type of Patient Allocation Model Used
- Figure 14.12 Clinical Trial Analysis: Distribution by Type of Trial Masking Adopted
- Figure 14.13 Clinical Trial Analysis: Distribution by Type of Intervention Model
- Figure 14.14 Clinical Trial Analysis: Distribution by Trial Purpose
- Figure 14.15 Most Active Industry Players: Distribution by Number of Clinical Trials Sponsored / Collaborated
- Figure 14.16 Most Active Non-Industry Players: Distribution by Number of Clinical Trials Sponsored / Collaborated
- Figure 14.17 Clinical Trial Analysis: Distribution of Clinical Trials by Geography
- Figure 14.18 Clinical Trial Analysis: Distribution of Clinical Trials by Geography and Trial Status
- Figure 14.19 Clinical Trial Analysis: Distribution of Patients Enrolled by Geography and Trial Status
- Figure 14.20 Clinical Trial Analysis: Distribution of Clinical Trials by Geography, Trial Status and Trial Phase
- Figure 15.1 Adeno-associated Viral Vector Based Therapy Developers: Cumulative Year-wise Trend, since 2017
- Figure 15.2 Adeno-associated Viral Vector Based Therapy Developers: Distribution by Type of Partnership
- Figure 15.3 Adeno-associated Viral Vector Based Therapy Developers: Distribution by Year and Type of Partnership, since 2022
- Figure 15.4 Adeno-associated Viral Vector Based Therapy Developers: Distribution by Year of Partnership and Type of Partner, since 2022
- Figure 15.5 Adeno-associated Viral Vector Based Therapy Developers: Distribution by Type of Partnership and Type of Partner
- Figure 15.6 Adeno-associated Viral Vector Based Therapy Developers: Distribution by Therapeutic Area
- Figure 15.7 Most Active Players: Distribution by Number of Partnerships
- Figure 15.8 Adeno-associated Viral Vector Based Therapy Developers: Distribution by Country
- Figure 15.9 Adeno-associated Viral Vector Based Therapy Developers: Distribution by Region
- Figure 15.10 Adeno-associated Viral Vector Manufacturers: Cumulative Year-wise Trend, since 2017
- Figure 15.11 Adeno-associated Viral Vector Manufacturers: Distribution by Type of Partnership
- Figure 15.12 Adeno-associated Viral Vector Manufacturers: Distribution by Year and Type of Partnership, since 2022
- Figure 15.13 Adeno-associated Viral Vector Manufacturers: Distribution by Year of Partnership and Type of Partner, since 2022
- Figure 15.14 Adeno-associated Viral Vector Manufacturers: Distribution by Type of Partnership and Type of Partner
- Figure 15.15 Adeno-associated Viral Vector Manufacturers: Distribution by Therapeutic Area
- Figure 15.16 Adeno-associated Viral Vector Manufacturers: Distribution by Application Area
- Figure 15.17 Most Active Players: Distribution by Number of Partnerships
- Figure 15.18 Adeno-associated Viral Vector Manufacturers: Distribution by Country
- Figure 15.19 Adeno-associated Viral Vector Manufacturers: Distribution by Region
- Figure 17.1 Patent Analysis: Distribution by Type of Patent
- Figure 17.2 Patent Analysis: Distribution by Patent Application Year, since pre-2019
- Figure 17.3 Patent Analysis: Distribution by Publication Year, since 2021
- Figure 17.4 Patent Analysis: Type of Patent and Publication Year, since 2021
- Figure 17.5 Patent Analysis: Distribution by Patent Jurisdiction
- Figure 17.6 Patent Analysis: Distribution by CPC Symbols
- Figure 17.7 Patent Analysis: Cumulative Year-wise Distribution by Type of Applicant, since 2021
- Figure 17.8 Leading Industry Players: Distribution by Number of Patents
- Figure 17.9 Leading Non-Industry Players: Distribution by Number of Patents
- Figure 17.10 Leading Patent Assignees: Distribution by Number of Patents
- Figure 17.11 Patent Benchmarking Analysis: Distribution by Patent Characteristics (CPC Codes) by Leading Industry Players
- Figure 17.12 Patent Benchmarking Analysis: Distribution of Leading Industry Players by Patent Characteristics (CPC Codes)
- Figure 17.13 Patent Valuation: Distribution of Patents by Age
- Figure 17.14 AAV Vector Market: Patent Valuation
- Figure 18.1 Start-up Health Indexing: Distribution by Location of Headquarters
- Figure 18.2 Start-up Health Indexing: Distribution by Pipeline Strength
- Figure 18.3 Start-up Health Indexing: Distribution by Pipeline Maturity
- Figure 18.4 Start-up Health Indexing: Distribution by Indication Diversity
- Figure 18.5 Start-up Health Indexing: Distribution by Patent Strength
- Figure 18.6 Start-up Health Indexing: Distribution by Partnership Activity
- Figure 18.7 Start-up Health Indexing: Roots Analysis Perspective
- Figure 18.8 Leading Start-ups: Spider Web Analysis
- Figure 19.1 Outsourcing: Go / No Go Framework
- Figure 19.2 Outsourcing: Go / No Go Framework for Adeno-associated Viral Vector Based Therapy Developers
- Figure 19.3 Adeno-associated Viral Vector Based Therapy Developers: Benchmarking of Small Companies
- Figure 19.4 Adeno-associated Viral Vector Based Therapy Developers: Benchmarking of Mid-sized Companies
- Figure 19.5 Adeno-associated Viral Vector Based Therapy Developers: Benchmarking of Large Companies
- Figure 20.1 Global Adeno-associated Viral Vector Based Therapeutics Market, Historical Trends (since 2021) and Forecasted Estimates (till 2035) (USD Million)
- Figure 20.2 Global Adeno-associated Viral Vector Based Therapeutics Market, Forecasted Estimates (till 2035): Conservative Scenario (USD Million)
- Figure 20.3 Adeno-associated Viral Vector Based Therapeutics Market, Forecasted Estimates (till 2035): Optimistic Scenario (USD Million)
- Figure 21.1 Adeno-associated Viral Vector Based Therapeutics Market: Distribution by Therapeutic Area
- Figure 21.2 Adeno-associated Viral Vector Based Therapeutics Market for Muscle-related Disorders: Historical Trends (since 2023) and Forecasted Estimates (till 2035) (USD Million)
- Figure 21.3 Adeno-associated Viral Vector Based Therapeutics Market for Genetic Disorders: Historical Trends (since 2021) and Forecasted Estimates (till 2035) (USD Million)
- Figure 21.4 Adeno-associated Viral Vector Based Therapeutics Market for Hematological Disorders: Historical Trends (since 2022) and Forecasted Estimates (till 2035) (USD Million)
- Figure 21.5 Adeno-associated Viral Vector Based Therapeutics Market for Ophthalmic Disorders: Historical Trends (since 2021) and Forecasted Estimates (till 2035) (USD Million)
- Figure 21.6 Adeno-associated Viral Vector Based Therapeutics Market for Dermatological Disorders: Forecasted Estimates (till 2035) (USD Million)
- Figure 21.7 Adeno-associated Viral Vector Based Therapeutics Market for Metabolic Disorders: Historical Trends (since 2022) and Forecasted Estimates (till 2035) (USD Million)
- Figure 22.1 Adeno-associated Viral Vector Based Therapeutics Market: Distribution by Type of Therapy
- Figure 22.2 Adeno-associated Viral Vector Based Therapeutics Market for Gene Augmentation Therapies: Historical Trends (since 2021) and Forecasted Estimates (till 2035) (USD Million)
- Figure 22.3 Adeno-associated Viral Vector Based Therapeutics Market for Gene Regulation Therapy: Forecasted Estimates (till 2035) (USD Million)
- Figure 23.1 Adeno-associated Viral Vector Based Therapeutics Market: Distribution by Route of Administration
- Figure 23.2 Adeno-associated Viral Vector Based Therapeutics Market for Intravenous Route: Historical Trends (since 2021) and Forecasted Estimates (till 2035) (USD Million)
- Figure 23.3 Adeno-associated Viral Vector Based Therapeutics Market for Subretinal Route: Historical Trends (since 2021) and Forecasted Estimates (till 2035) (USD Million)
- Figure 23.4 Adeno-associated Viral Vector Based Therapeutics Market for Intravitreal Route: Historical Trends (since 2022) and Forecasted Estimates (till 2035) (USD Million)
- Figure 23.5 Adeno-associated Viral Vector Based Therapeutics Market for Other Routes: Historical Trends (since 2022) and Forecasted Estimates (till 2035) (USD Million)
- Figure 24.1 Adeno-associated Viral Vector Based Therapeutics Market: Distribution by Geographical Regions
- Figure 24.2 Adeno-associated Viral Vector Based Manufacturing Market in North America, Historical Trends (since 2021) and Forecasted Estimates (till 2035) (USD Million)
- Figure 24.3 Adeno-associated Viral Vector Based Manufacturing Market in Europe, Historical Trends (since 2021) and Forecasted Estimates (till 2035) (USD Million)
- Figure 24.4 Adeno-associated Viral Vector Based Manufacturing Market in Asia-Pacific, Historical Trends (since 2021) and Forecasted Estimates (till 2035) (USD Million)
- Figure 24.5 Adeno-associated Viral Vector Based Manufacturing Market in Latin America and Rest of the World, Historical Trends (since 2021) and Forecasted Estimates (till 2035) (USD Million)
- Figure 25.1 Adeno-associated Vector Based Therapeutics Market: Luxturna Sales Forecast, till 2035 (USD Million)
- Figure 25.2 Adeno-associated Vector Based Therapeutics Market: Hemgenix Sales Forecast, till 2035 (USD Million)
- Figure 25.3 Adeno-associated Vector Based Therapeutics Market: Zolgensma Sales Forecast, till 2035 (USD Million)
- Figure 25.4 Adeno-associated Vector Based Therapeutics Market: Roctavian Sales Forecast, till 2035 (USD Million)
- Figure 25.5 Adeno-associated Vector Based Therapeutics Market: Elevidys Sales Forecast, till 2035 (USD Million)
- Figure 25.6 Adeno-associated Vector Based Therapeutics Market: Upstaza Sales Forecast, till 2035 (USD Million)
- Figure 25.7 Adeno-associated Vector Based Therapeutics Market: EB 101 Sales Forecast, till 2035 (USD Million)
- Figure 25.8 Adeno-associated Vector Based Therapeutics Market: BBM H901 Sales Forecast, till 2035 (USD Million)
- Figure 25.9 Adeno-associated Vector Based Therapeutics Market: AGTC 501 Sales Forecast, till 2035 (USD Million)
- Figure 25.10 Adeno-associated Vector Based Therapeutics Market: Lumevoq Sales Forecast, till 2025 (USD Million)
- Figure 25.11 Adeno-associated Vector Based Therapeutics Market: NFS-01 Sales Forecast, till 2035 (USD Million)
- Figure 25.12 Adeno-associated Vector Based Therapeutics Market: RGX-314 Sales Forecast, till 2035 (USD Million)
- Figure 25.13 Adeno-associated Vector Based Therapeutics Market: SPK-8011 Sales Forecast, till 2035 (USD Million)
- Figure 25.14 Adeno-associated Vector Based Therapeutics Market: Giroctocogene fitelparvovec Sales Forecast, till 2035 (USD Million)
- Figure 25.15 Adeno-associated Vector Based Therapeutics Market: RGX-121 Sales Forecast, till 2035 (USD Million)
- Figure 25.16 Adeno-associated Vector Based Therapeutics Market: DTx-401 Sales Forecast, till 2035 (USD Million)
- Figure 25.17 Adeno-associated Vector Based Therapeutics Market: DTx-301 Sales Forecast, till 2035 (USD Million)
- Figure 25.18 Adeno-associated Vector Based Therapeutics Market: ABO-102 Sales Forecast, till 2035 (USD Million)
- Figure 25.19 Adeno-associated Vector Based Therapeutics Market: AAV-RPE65 Sales Forecast, till 2035 (USD Million)
- Figure 25.20 Adeno-associated Vector Based Therapeutics Market: Ixoberogene Soroparvovec Sales Forecast, till 2035 (USD Million)
- Figure 25.21 Adeno-associated Vector Based Therapeutics Market: OCU400 Sales Forecast, till 2035 (USD Million)
- Figure 26.1 Global Adeno-associated Viral Vector Based Manufacturing Market, Historical Trends (since 2021) and Forecasted Estimates (till 2035) (USD Million)
- Figure 26.2 Global Adeno-associated Viral Vector Based Manufacturing Market, Forecasted Estimates (till 2035): Conservative Scenario (USD Million)
- Figure 26.3 Global Adeno-associated Viral Vector Based Manufacturing Market Forecasted Estimates (till 2035): Optimistic Scenario (USD Million)
- Figure 27.1 Adeno-associated Viral Vector Based Manufacturing Market: Distribution by Stage of Development
- Figure 27.2 Adeno-associated Viral Vector Based Manufacturing Market for Commercial Stage Products, Historical Trends (since 2021) and Forecasted Estimates (till 2035) (USD Million)
- Figure 27.3 Adeno-associated Viral Vector Based Manufacturing Market for Clinical Stage Products, Historical Trends (since 2021) and Forecasted Estimates (till 2035) (USD Million)
- Figure 27.4 Adeno-associated Viral Vector Based Manufacturing Market for Preclinical Stage Products, Historical Trends (since 2021) and Forecasted Estimates (till 2035) (USD Million)
- Figure 28.1 Adeno-associated Viral Vector Based Manufacturing Market: Distribution by Therapeutic Area, 2021, 2025 and 2035
- Figure 28.2 Adeno-associated Viral Vector Based Manufacturing Market for Oncological Disorders, Historical Trends (since 2021) and Forecasted Estimates (till 2035) (USD Million)
- Figure 28.3 Adeno-associated Viral Vector Based Manufacturing Market for Rare Disorders, Historical Trends (since 2021) and Forecasted Estimates (till 2035) (USD Million)
- Figure 28.4 Adeno-associated Viral Vector Based Manufacturing Market for Musculoskeletal Disorders, Historical Trends (since 2021) and Forecasted Estimates (till 2035) (USD Million)
- Figure 28.5 Adeno-associated Viral Vector Based Manufacturing Market for Genetic Disorders, Historical Trends (since 2021) and Forecasted Estimates (till 2035) (USD Million)
- Figure 28.6 Adeno-associated Viral Vector Based Manufacturing Market for Hematological Disorders, Historical Trends (since 2021) and Forecasted Estimates (till 2035) (USD Million)
- Figure 28.7 Adeno-associated Viral Vector Based Manufacturing Market for Neurological Disorders, Historical Trends (since 2021) and Forecasted Estimates (till 2035) (USD Million)
- Figure 28.8 Adeno-associated Viral Vector Based Manufacturing Market for Metabolic Disorders, Historical Trends (since 2021) and Forecasted Estimates (till 2035) (USD Million)
- Figure 28.9 Adeno-associated Viral Vector Based Manufacturing Market for Sensory Disorders, Historical Trends (since 2021) and Forecasted Estimates (till 2035) (USD Million)
- Figure 28.10 Adeno-associated Viral Vector Based Manufacturing Market for Ophthalmic Disorders, Historical Trends (since 2021) and Forecasted Estimates (till 2035) (USD Million)
- Figure 28.11 Adeno-associated Viral Vector Based Manufacturing Market for Dermatological Disorders, Forecasted Estimates (till 2035) (USD Million)
- Figure 28.12 Adeno-associated Viral Vector Based Manufacturing Market for Others, Historical Trends (since 2021) and Forecasted Estimates (till 2035) (USD Million)
- Figure 29.1 Adeno-associated Viral Vector Based Manufacturing Market: Distribution by Geographical Regions
- Figure 29.2 Adeno-associated Viral Vector Based Manufacturing Market in North America, Historical Trends (since 2021) and Forecasted Estimates (till 2035) (USD Million)
- Figure 29.3 Adeno-associated Viral Vector Based Manufacturing Market in Europe, Historical Trends (since 2021) and Forecasted Estimates (till 2035) (USD Million)
- Figure 29.4 Adeno-associated Viral Vector Based Manufacturing Market in Asia-Pacific, Historical Trends (since 2021) and Forecasted Estimates (till 2035) (USD Million)
- Figure 29.5 Adeno-associated Viral Vector Based Manufacturing Market in Middle East and North Africa, Historical Trends (since 2021) and Forecasted Estimates (till 2035) (USD Million)
- Figure 29.6 Adeno-associated Viral Vector Based Manufacturing Market in Latin America and Rest of the World, Historical Trends (since 2021) and Forecasted Estimates (till 2035) (USD Million)
- Figure 29.7 Penetration Growth (P-G) Matrix: Geographical Regions
- Figure 30.1 Adeno-associated Viral Vector Based Manufacturing Market for Commercial Stage Products, Historical Trends (since 2021) and Forecasted Estimates (till 2035) (USD Million)
- Figure 30.2 Adeno-associated Viral Vector Based Manufacturing Market for Commercial Stage Products: Distribution by Therapeutic Area
- Figure 30.3 Adeno-associated Viral Vector Based Manufacturing Market for Commercial Stage Products: Distribution by Route of Administration
- Figure 30.4 Adeno-associated Viral Vector Based Manufacturing Market for Commercial Stage Products: Distribution by Geographical Regions
- Figure 30.5 Adeno-associated Viral Vector Based Manufacturing Market for Clinical Stage Products, Historical Trends (since 2021) and Forecasted Estimates (till 2035) (USD Million)
- Figure 30.6 Adeno-associated Viral Vector Based Manufacturing Market for Clinical Stage Products: Distribution by Phase of Development
- Figure 30.7 Adeno-associated Viral Vector Based Manufacturing Market for Clinical Stage Products: Distribution by Therapeutic Area
- Figure 30.8 Adeno-associated Viral Vector Based Manufacturing Market for Clinical Stage Products: Distribution by Geographical Regions
- Figure 30.9 Adeno-associated Viral Vector Based Manufacturing Market for Preclinical Stage Products, Historical Trends (since 2021) and Forecasted Estimates (till 2035) (USD Million)
- Figure 30.10 Adeno-associated Viral Vector Based Manufacturing Market for Preclinical Stage Products: Distribution by Therapeutic Area
- Figure 30.11 Adeno-associated Viral Vector Based Manufacturing Market for Preclinical Stage Products: Distribution by Animal Model Used
- Figure 30.12 Adeno-associated Viral Vector Based Manufacturing Market for Preclinical Stage Products: Distribution by Geographical Regions
- Figure 31.1 Concluding Remarks: Adeno-Associated Viral Vector Based Therapies Market Landscape
- Figure 31.2 Concluding Remarks: Adeno-Associated Viral Vector Based Manufacturers and Technologies / Platforms Landscape
- Figure 31.3 Concluding Remarks: Clinical Trial Analysis
- Figure 31.4 Concluding Remarks: Partnerships and Collaborations
- Figure 31.5 Concluding Remarks: Patent Analysis
- Figure 31.6 Concluding Remarks: Adeno-Associated Viral Vector-based Therapy Market Forecast
- Figure 31.7 Concluding Remarks: Adeno-Associated Viral Vector Manufacturing Market Forecast

