
PUBLISHER: Roots Analysis | PRODUCT CODE: 1821505

PUBLISHER: Roots Analysis | PRODUCT CODE: 1821505
Anti-Obesity Drugs Market: Industry Trends and Global Forecasts, till 2035 - Distribution by Type of Molecule, Active Compound Used, Mechanism of Action, Agonist, Action Pathway, Route of Administration, Regions, Sales Forecast and Key Players
Anti-Obesity Drugs Market: Overview
As per Roots Analysis, the global anti-obesity drugs market is estimated to grow from USD 19.6 billion in the current year and USD 104.9 billion by 2035, representing a CAGR of 18.3% during the forecast period.
The market sizing and opportunity analysis has been segmented across the following parameters:
Type of Molecule
- Biologics
- Small Molecules
Active Compound Used
- Tirzepatide
- Semaglutide
- Retatrutide
- Survodutide
- Cagrilintide and Semaglutide
- Orforglipron
- Liraglutide
- Other Active Compounds
Mechanism of Action
- GLP-1 Agonist / GIP Agonist
- GLP-1 Agonist / GCGR Agonist
- GLP-1 Agonist
- GLP-1 Agonist / Amylin Analogue
- GLP-1 / GCGR / GIP Agonist
- Other Mechanisms of Action
Type of Agonist
- Single-Agonist
- Dual-Agonist
- Tri-Agonist
Action Pathway
- Centrally Acting
- Peripherally Acting
- Centrally Acting and Peripherally Acting
Route of Administration
- Oral
- Parenteral
Geographical Regions
- North America
- Europe
- Asia
- Latin America
- Middle East and North Africa
Sales Forecast of Drugs
- Contrave / Mysimba
- Feisumei
- Imcivree
- LOMAIRA
- QSYMIA
- Saxenda
- Wegovy / Ozempic
- Zepbound / Mounjaro
- BI 456906
- CagriSema
- HM11260C
- HRS-9531
- IBI362
- LM-008
- LY3437943
- LY3502970
- TG103
- Semaglutide 7.2 mg (Subcutaneous)
- Semaglutide (Oral)
- XW003
Anti-Obesity drugs Market: Growth and Trends
The urgent need to address obesity epidemic globally has resulted in the boost of the anti-obesity drugs market. Factors such as increasing obesity prevalence, rising disposable incomes, and greater access to healthcare services are propelling this trend. The recent years have witnessed a rise in the approval of anti-obesity drugs, thereby expanding treatment options for patients. This is a result of the alarming statistics of approximately 40% of adults in the U.S. being classified as obese, with a body mass index (BMI) of 30 or higher.
The anti-obesity drugs target weight loss by regulating appetite, fat absorption, and metabolic processes. These drugs include various therapeutic options designed to assist individuals in managing obesity and related conditions. As global obesity rates increase and the awareness of associated health risks, including diabetes, cardiovascular diseases, and certain cancers rise, the need for effective anti-obesity medications has escalated. It is worth mentioning that, in the recent years, many new anti-obesity drugs have gained regulatory approval, expanding options for patients and offering alternatives to surgical procedures for weight loss.
Anti-obesity medications are vital in enhancing weight loss results, especially for patients with severe obesity-related health issues. Further, these drugs contribute to improved quality of life and can lower healthcare expenses by preventing complications related to obesity. Innovations in drug formulation and delivery systems, along with the integration of novel compounds, have resulted in the development of safer and more effective anti-obesity medications. The growing emphasis on personalized medicine and pharmacogenomics further enhances the potential for tailored treatments that address individual patient needs. Additionally, the rise in telehealth services and digital therapeutics applications is facilitating better patient engagement and adherence to treatment plans.
Public and private sectors are actively providing investments in order to conduct research and development in the anti-obesity space, along with fostering innovation and developing cutting-edge therapies. As the focus on obesity as a chronic disease that needs long-term management increases, the anti-obesity drugs market is poised for substantial growth, presenting significant opportunities for stakeholders in the coming years.
Anti-Obesity Drugs Market: Key Insights
The report delves into the current state of the anti-obesity drugs market and identifies potential growth opportunities within the industry. Some key findings from the report include:
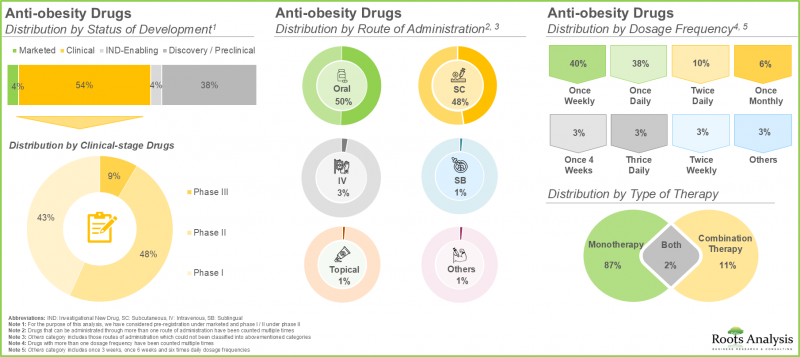
- Currently, close to 225 drugs are marketed / being developed for the management of obesity; around 50% of these can be administered through the oral route.
- Around 55% of the anti-obesity drugs are presently in their clinical stage of development; of these, majority of these drugs are being evaluated as monotherapy.
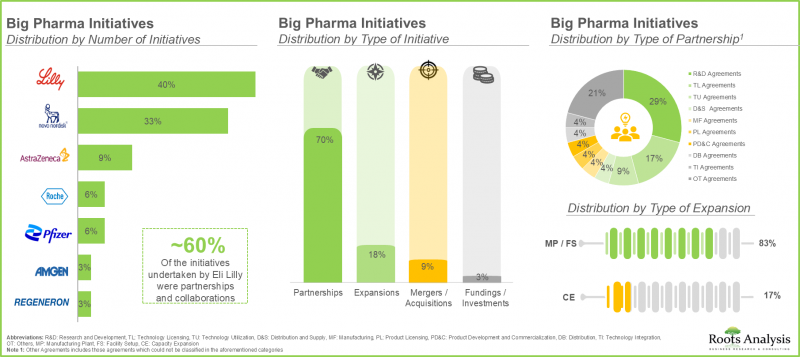
- A sizeable proportion (70%) of big pharma players have entered into various partnerships in order to expand their anti-obesity drug portfolios; majority of these partnerships (~30%) were research and development agreements.
- The growing awareness among patients about the health risks associated with obesity coupled with its increasing prevalence, is driving the anti-obesity market and positioning it for steady growth in the foreseeable future.
- The anti-obesity drugs market is anticipated to grow at an annualized rate (CAGR) of 21.1%, till 2035; North America is expected to capture the majority share (~60%) of the market by 2035.
- Currently, the centrally acting anti-obesity drugs dominate the market; notably, parenteral route of administration is expected to capture the majority share (~85%) in the market by 2035.
Anti-Obesity Drugs Market: Key Segments
Small Molecules is the Fastest Growing Segment of the Anti-obesity Drugs Market
In terms of type of molecule, the anti-obesity drugs market is segmented into different type of molecules, such as biologics and small molecules. Majority (54%) of the market share is captured small molecules owing to their proven efficacy, ease of administration, lower production costs, accessibility and established safe drug profiles. However, the landscape is expected to change as biologics emerge as a promising and more effective alternative for the underlying biological pathways associated with obesity.
Semaglutide is Likely to Hold the Largest Share of the Anti-obesity Drugs Market During the Forecast Period
In terms of type of molecule, the anti-obesity drugs market is segmented into various active compounds used, such as semaglutide, retatrutide, survodutide, cagrilintide, orforglipron, liraglutide and other active compounds. Owing to its strong efficacy in weight management and diabetes control, majority of the anti-obesity drugs market is currently captured by semaglutide. However, as research progresses, tirzepatide is gaining attention for its dual action as both a GLP-1 and GIP receptor agonist, demonstrating superior weight loss results in clinical trials. This innovative approach targets various metabolic pathways, offering a more comprehensive treatment for obesity. With its potential for greater efficacy and improved patient outcomes, tirzepatide is expected to rise in prominence, ultimately securing the largest market share in the years to come.
Anti-Obesity Drugs Market for GLP-1 Agonist is Likely to grow at a Relatively Faster Pace During the Forecast Period
In terms of mechanism of action, the anti-obesity drugs / weight loss drugs market is segmented into GLP-1 agonist / GIP agonist, GLP-1 agonist / GCGR agonist, GLP-1 agonist, GLP-1 agonist / amylin analogue, GLP-1 / GCGR / GIP agonist and other mechanisms of action. The current market is dominated by GLP-1 market segment. This is attributed to their well-established mechanism of action, which improve glycemic control, thereby promoting significant weight loss. Their ability to enhance satiety and reduce appetite is the foundation in obesity treatment. However, dual GLP-1 and GIP agonists are anticipated to grow at a comparatively higher CAGR because of their ability to target multiple metabolic pathways. Clinical studies suggest that dual agonists can yield greater weight loss and improved metabolic profiles compared to GLP-1 agonists alone.
Anti-Obesity Drugs Market for Single Agonist is Likely to Grow at a Higher CAGR During the Forecast Period
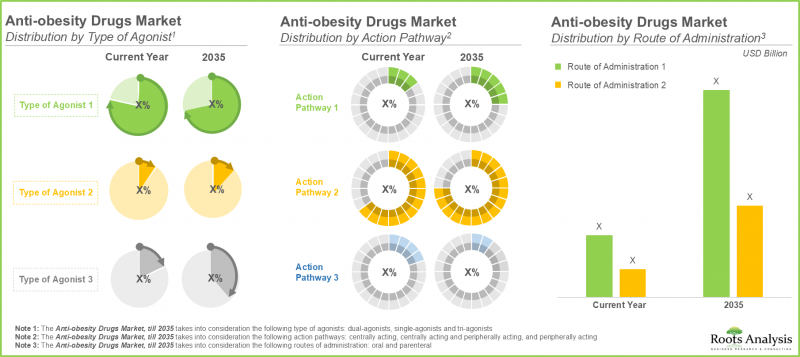
The market is segmented into different types of agonists, including single-agonist, dual-agonist and tri-agonist. Owing to the ease of use in order to facilitate patient adherence, the single agonist segment currently captures the maximum anti-obesity drugs market share (68%). These medications have a long-standing history of clinical success, which enables healthcare providers to confidently prescribe them based on extensive data. Following it, the dual agonist segment will capture a prominent market share, driven by its capability to address the complexities of obesity by targeting multiple physiological mechanisms simultaneously. This allows for more tailored treatments that can adapt to individual patient needs and conditions. Dual agonists are set to become more popular as healthcare shifts toward personalized medicine, thus resulting in greater investments in their development.
Anti-Obesity Drugs Catering to Centrally Acting Pathways is Likely to Dominate the Anti-Obesity Drugs Market During the Forecast Period
The market caters to a variety of action pathways, including centrally acting, peripherally acting and centrally and peripherally acting pathways. Centrally acting segment currently captures the highest anti-obesity drugs market share (86%) and is expected to dominate the market during the forecast period. This is a result of its effectiveness in modulating appetite and energy expenditure through direct interactions with the central nervous system. Additionally, centrally acting agents have a well-established safety profile, which further solidifies their position in clinical practice. Further, the reliance on centrally acting pathways is likely to remain strong, as they provide a comprehensive approach to managing weight. Despite ongoing research into alternative pathways, robust clinical evidence supporting the efficacy of centrally acting agents ensures their continued dominance in the market. Consequently, while new treatments may emerge, the trend towards centrally acting pathways is expected to persist, reflecting their fundamental role in obesity management.
Currently, Parenteral Route Hold the Largest Share of the Anti-Obesity Drugs Market
In terms of route of administration, the anti-obesity drugs market is segmented across oral and parenteral routes. Our research suggests that parenteral route captures the majority share (98%) in the market owing to its rapid onset of action and higher bioavailability compared to oral formulations. Parenteral delivery ensures the medications to bypass the gastrointestinal tract, reducing variability in absorption and enhancing therapeutic effectiveness. It is advantageous for agents that require precise dosing and consistent plasma levels to achieve optimal weight loss outcomes. Moreover, the growing preference for injectable formulations reinforces the trend toward parenteral administration. Consequently, although oral options remain available, the dominance of parenteral administration in the anti-obesity landscape is likely to persist well into the future as well.
North America Accounts for the Largest Share of the Market
The global market value is segmented across various geographies, including North America, Europe, Asia-Pacific, and Latin America. According to our projections, North America region accounts for the major anti-obesity drugs market share (70%), which is likely to remain the same during the forecast period. This is complemented by the availability of advanced healthcare infrastructure, significant investment in pharmaceutical research, and robust regulatory frameworks in this region that facilitate the development and approval of new therapies. It is worth highlighting that the market for anti-obesity drugs in Asia-Pacific is expected to grow at a relatively higher CAGR (~40%), till 2035.
Example Players in the Antibody Contract Manufacturing Market
- Boehringer Ingelheim
- Eli Lilly
- Novo Nordisk
- Other Drug Developers
- Eli Lilly
- Pfizer
- Regeneron
- Kallyope
- CinFina Pharma
- Viking Therapeutics
- AstraZeneca
- Novo Nordisk
- Roche
- Adocia
- Boehringer Ingelheim
- Zealand Pharma
- Hanmi Pharm
- Jiangsu Hengrui Pharmaceuticals
- Gmax Biopharma
- PegBio
- QL Biopharm
- Sciwind Biosciences
Anti-Obesity Market: Research Coverage
- Market Sizing and Opportunity Analysis: The report features a thorough analysis of the global anti-obesity drugs market, in terms of the key market segments, including [A] type of molecule [B] active compound used [C] mechanism of action [D] type of agonist [E] action pathway [F] route of administration and [G] geographical regions.
- Market Landscape: An in-depth assessment of the companies involved in anti-obesity market, based on several relevant parameters, such as including [A] status of development, [B] type of molecule, [C] mechanism of action [D] type of agonist [E] route of administration [F] dosage frequency and [G] type of therapy.
- Company Competitiveness Analysis: A comprehensive competitive analysis of ant-obesity drugs, examining factors, such as [A] company strength and [B] pipeline portfolio.
- Company Profiles: Detailed profiles of key service providers engaged in the anti-obesity drugs market, focused on [A] overview of the company, [B] financial information (if available), [C] pipeline portfolio, and [D] recent developments and an informed future outlook.
- Big Pharma Initiatives A review of the various anti-obesity initiatives undertaken by big pharma players, highlighting trends across various parameters [A] number of initiatives, [B] year of initiative, [C] type of initiative, [D] type of partnership and [D] type of expansion.
Key Questions Answered in this Report
- How many companies are currently engaged in this market?
- Which are the leading companies in this market?
- What factors are likely to influence the evolution of this market?
- What is the current and future market size?
- What is the CAGR of this market?
- How is the current and future market opportunity likely to be distributed across key market segments?
Reasons to Buy this Report
- The report provides a comprehensive market analysis, offering detailed revenue projections of the overall market and its specific sub-segments. This information is valuable to both established market leaders and emerging entrants.
- Stakeholders can leverage the report to gain a deeper understanding of the competitive dynamics within the market. By analyzing the competitive landscape, businesses can make informed decisions to optimize their market positioning and develop effective go-to-market strategies.
- The report offers stakeholders a comprehensive overview of the market, including key drivers, barriers, opportunities, and challenges. This information empowers stakeholders to stay abreast of market trends and make data-driven decisions to capitalize on growth prospects.
Additional Benefits
- Complimentary Excel Data Packs for all Analytical Modules in the Report
- 15% Free Content Customization
- Detailed Report Walkthrough Session with Research Team
- Free Updated report if the report is 6-12 months old or older
TABLE OF CONTENTS
1. BACKGROUND
- 1.1. Context
- 1.2. Project Objectives
2. RESEARCH METHODOLOGY
- 2.1. Chapter Overview
- 2.2. Research Assumptions
- 2.3. Project Methodology
- 2.4. Forecast Methodology
- 2.5. Robust Quality Control
- 2.6. Key Factors
- 2.6.1. Demographics
- 2.6.2. Economic Factors
- 2.6.3. Competitive Landscape
- 2.6.4. Government Regulations and Healthcare Policies
- 2.6.5. R&D Investment
- 2.6.6. Technological Factors
- 2.6.7. Industry Consolidation
- 2.6.8. Supply Chain
- 2.6.9. Market Access
- 2.6.10. COVID Impact / Related Factors
- 2.6.11. Market Access
- 2.6.12. COVID Impact / Related Factors
- 2.6.13. Patient Advocacy and Influence
- 2.6.14. Healthcare Infrastructure
3. MARKET DYNAMICS
- 3.1. Chapter Overview
- 3.2. Forecast Methodology
- 3.2.1. Top-Down Approach
- 3.2.2. Botton-Up Approach
- 3.2.3. Hybrid Approach
- 3.3. Market Assessment Framework
- 3.3.1. Total Addressable Market (TAM)
- 3.3.2. Serviceable Addressable Market (SAM)
- 3.3.3. Serviceable Obtainable Market (SOM)
- 3.3.4. Currently Acquired Market (CAM)
- 3.4. Forecasting Tools and Techniques
- 3.4.1. Qualitative Forecasting
- 3.4.2. Correlation
- 3.4.3. Regression
- 3.4.4. Extrapolation
- 3.4.5. Convergence
- 3.4.6. Sensitivity Analysis
- 3.4.7. Scenario Planning
- 3.4.8. Data Visualization
- 3.4.9. Time Series Analysis
- 3.4.10. Forecast Error Analysis
- 3.5. Key Considerations
- 3.5.1. Demographics
- 3.5.2. Government Regulations
- 3.5.3. Reimbursement Scenarios
- 3.5.4. Market Access
- 3.5.5. Supply Chain
- 3.5.6. Industry Consolidation
- 3.5.7. Pandemic / Unforeseen Disruptions Impact
- 3.6. Key Market Segments
- 3.7. Robust Quality Control
- 3.8. Limitations
4. ECONOMIC AND OTHER PROJECT SPECIFIC CONSIDERATIONS
- 4.1. Chapter Overview
- 4.2. Market Dynamics
- 4.2.1. Time Period
- 4.2.1.1. Historical Trends
- 4.2.1.2. Current and Forecasted Estimates
- 4.2.2. Currency Coverage
- 4.2.2.1. Overview of Major Currencies Affecting the Market
- 4.2.2.2. Impact of Currency Fluctuations on the Industry
- 4.2.3. Foreign Exchange Impact
- 4.2.3.1. Evaluation of Foreign Exchange Rates and Their Impact on Market
- 4.2.3.2. Strategies for Mitigating Foreign Exchange Risk
- 4.2.4. Recession
- 4.2.4.1. Historical Analysis of Past Recessions and Lessons Learnt
- 4.2.4.2. Assessment of Current Economic Conditions and Potential Impact on the Market
- 4.2.5. Inflation
- 4.2.5.1. Measurement and Analysis of Inflationary Pressures in the Economy
- 4.2.5.2. Potential Impact of Inflation on the Market Evolution
- 4.2.1. Time Period
5. EXECUTIVE SUMMARY
6. INTRODUCTION
- 6.1. Overview of Anti-Obesity Drugs
- 6.2. Health Risks Linked with Long-term Obesity
- 6.3. Currently Approved Anti-Obesity Drug Classes
- 6.4. Challenges Associated with Anti-Obesity Drugs
- 6.5. Future Perspectives
7. MARKET LANDSCAPE: ANTI-OBESITY DRUGS
- 7.1. Market Landscape: Anti-Obesity Drugs
- 7.1.1. Analysis by Status of Development
- 7.1.2. Analysis by Type of Molecule
- 7.1.3. Analysis by Mechanism of Action
- 7.1.4. Analysis by Type of Agonist
- 7.1.5. Analysis by Route of Administration
- 7.1.6. Analysis by Dosage Frequency
- 7.1.7. Analysis by Type of Therapy
- 7.2. Developer Landscape: Anti-Obesity Drugs
- 7.2.1. Analysis by Year of Establishment
- 7.2.2. Analysis by Company Size
- 7.2.3. Analysis by Location of Headquarters
- 7.2.4. Analysis by Headquarters (Country) and Status of Development
- 7.2.5. Most Active Developers: Analysis by Number of Drug Candidates
8. COMPANY PROFILES: ANTI-OBESITY DRUG DEVELOPERS BASED IN NORTH AMERICA
- 8.1. Chapter Overview
- 8.2. Detailed Company Profiles
- 8.2.1. Eli Lilly
- 8.2.1.1. Company Details
- 8.2.1.2. Pipeline Portfolio
- 8.2.1.3. Financial Details
- 8.2.1.4. Recent Developments and Future Outlook
- 8.2.2. Pfizer
- 8.2.3. Regeneron
- 8.2.1. Eli Lilly
- 8.3. Brief Company Profiles
- 8.3.1. CinFina Pharma
- 8.3.1.1. Company Details
- 8.3.1.2. Pipeline Portfolio
- 8.3.2. Kallyope
- 8.3.3. Viking Therapeutics
- 8.3.1. CinFina Pharma
9. COMPANY PROFILES: ANTI-OBESITY DRUG DEVELOPERS BASED IN EUROPE
- 9.1. Chapter Overview
- 9.2. Detailed Company Profiles
- 9.2.1. AstraZeneca
- 9.2.1.1. Company Details
- 9.2.1.2. Pipeline Portfolio
- 9.2.1.3. Financial Details
- 9.2.1.4. Recent Developments and Future Outlook
- 9.2.2. Novo Nordisk
- 9.2.3. Roche
- 9.2.1. AstraZeneca
- 9.3. Brief Company Profiles
- 9.3.1. Adocia
- 9.3.1.1. Company Details
- 9.3.1.2. Pipeline Portfolio
- 9.3.2. Boehringer Ingelheim
- 9.3.3. Zealand Pharma
- 9.3.1. Adocia
10. COMPANY PROFILES: ANTI-OBESITY DRUG DEVELOPERS BASED IN ASIA-PACIFIC AND REST OF THE WORLD
- 10.1. Chapter Overview
- 10.2. Detailed Company Profiles
- 10.2.1. Hanmi Pharmaceuticals
- 10.2.1.1. Company Details
- 10.2.1.2. Pipeline Portfolio
- 10.2.1.3. Financial Details
- 10.2.1.4. Recent Developments and Future Outlook
- 10.2.2. Jiangsu Hengrui Pharmaceuticals
- 10.2.1. Hanmi Pharmaceuticals
- 10.3. Brief Company Profiles
- 10.3.1. Gmax Biopharma
- 10.3.1.1. Company Details
- 10.3.1.2. Pipeline Portfolio
- 10.3.2. PegBio
- 10.3.3. QL Biopharm
- 10.3.4. Sciwind Biosciences
- 10.3.1. Gmax Biopharma
11. BIG PHARMA INITIATIVES
- 11.1. Methodology
- 11.2. Big Pharma Players: Anti-obesity focused Initiatives
- 11.2.1. Analysis of Big Pharma Players by Number of Initiatives
- 11.2.2. Analysis by Year of Initiative
- 11.2.3. Analysis by Big Pharma Player by Year of Initiative and Number of Initiatives
- 11.2.4. Analysis by Type of Initiative
- 11.2.5. Analysis by Year and Type of Initiative
- 11.2.6. Analysis by Big Pharma Player and Type of Initiative
- 11.2.7. Analysis by Big Pharma Player and Number of Partnerships
- 11.2.8. Analysis by Type of Partnership
- 11.2.9. Analysis by Type of Expansion
- 11.2.10. Analysis by Big Pharma Player by Region and Number of Initiatives
- 11.2.11. Benchmarking of Big Pharma Players
12. MARKET IMPACT ANALYSIS: DRIVERS, RESTRAINTS, OPPORTUNITIES AND CHALLENGES
- 12.1. Chapter Overview
- 12.2. Market Drivers
- 12.3. Market Restraints
- 12.4. Market Opportunities
- 12.5. Market Challenges
13. GLOBAL ANTI-OBESITY DRUGS MARKET
- 13.1. Forecast Methodology and Key Assumptions
- 13.2. Global Anti-Obesity Drugs Market, Historical Trends (Since 2019) and Forecasted Estimates (Till 2035) (USD Billion)
- 13.2.1. Scenario Analysis
- 13.2.1.1. Conservative Scenario
- 13.2.1.2. Optimistic Scenario
- 13.2.1. Scenario Analysis
- 13.3. Key Market Segmentations
14. ANTI-OBESITY DRUGS MARKET, BY TYPE OF MOLECULE
- 14.1. Anti-Obesity Drugs Market: Distribution by Type of Molecule
- 14.1.1. Anti-Obesity Drugs Market for Biologics, Historical Trends (since 2019) and Forecasted Estimates (till 2035)
- 14.1.2. Anti-Obesity Drugs Market for Small Molecules, Historical Trends (since 2019) and Forecasted Estimates (till 2035)
15. ANTI-OBESITY DRUGS MARKET, BY ACTIVE COMPOUND USED
- 15.1. Anti-Obesity Drugs Market: Distribution by Active Compound Used
- 15.1.1. Anti-Obesity Drugs Market for Tirzepatide, Historical Trends (since 2019) and Forecasted Estimates (till 2035)
- 15.1.2. Anti-Obesity Drugs Market for Semaglutide, Historical Trends (since 2019) and Forecasted Estimates (till 2035)
- 15.1.3. Anti-Obesity Drugs Market for Retatrutide, Historical Trends (since 2019) and Forecasted Estimates (till 2035)
- 15.1.4. Anti-Obesity Drugs Market for Survodutide, Historical Trends (since 2019) and Forecasted Estimates (till 2035)
- 15.1.5. Anti-Obesity Drugs Market for Cagrilintide and Semglutide, Historical Trends (since 2019) and Forecasted Estimates (till 2035)
- 15.1.6. Anti-Obesity Drugs Market for Orforglipron, Historical Trends (since 2019) and Forecasted Estimates (till 2035)
- 15.1.7. Anti-Obesity Drugs Market for Liraglutide, Historical Trends (since 2019) and Forecasted Estimates (till 2035)
- 15.1.8. Anti-Obesity Drugs Market for other active compounds used, Historical Trends (since 2019) and Forecasted Estimates (till 2035)
16. ANTI-OBESITY DRUGS MARKET, BY MECHANISM OF ACTION
- 16.1. Anti-Obesity Drugs Market: Distribution by Mechanism of Action
- 16.1.1. Anti-Obesity Drugs Market for GLP-1 Agonist / GIP Agonist, Historical Trends (since 2019) and Forecasted Estimates (till 2035)
- 16.1.2. Anti-Obesity Drugs Market for GLP-1 Agonist, Historical Trends (since 2019) and Forecasted Estimates (till 2035)
- 16.1.3. Anti-Obesity Drugs Market for GLP-1 Agonist / GCGR Agonist, Historical Trends (since 2019) and Forecasted Estimates (till 2035)
- 16.1.4. Anti-Obesity Drugs Market for GLP-1 / GCGR / GIP Agonist, Historical Trends (since 2019) and Forecasted Estimates (till 2035)
- 16.1.5. Anti-Obesity Drugs Market for GLP-1 Agonist / Amylin Analogue, Historical Trends (since 2019) and Forecasted Estimates (till 2035)
- 16.1.6. Anti-Obesity Drugs Market for Other Mechanisms of Action, Historical Trends (since 2019) and Forecasted Estimates (till 2035)
17. ANTI-OBESITY DRUGS MARKET, BY TYPE OF AGONIST
- 17.1. Anti-Obesity Drugs Market: Distribution by Type of Agonist
- 17.1.1. Anti-Obesity Drugs Market for Single-Agonist, Historical Trends (since 2019) and Forecasted Estimates (till 2035)
- 17.1.2. Anti-Obesity Drugs Market for Dual-Agonist, Historical Trends (since 2019) and Forecasted Estimates (till 2035)
- 17.1.3. Anti-Obesity Drugs Market for Tri-Agonist, Historical Trends (since 2019) and Forecasted Estimates (till 2035)
18. ANTI-OBESITY DRUGS MARKET, BY ACTION PATHWAY
- 18.1. Anti-Obesity Drugs Market: Distribution by Action Pathway
- 18.1.1. Anti-Obesity Drugs Market for Centrally Acting Drugs, Historical Trends (since 2019) and Forecasted Estimates (till 2035)
- 18.1.2. Anti-Obesity Drugs Market for Peripherally Acting Drugs, Historical Trends (since 2019) and Forecasted Estimates (till 2035)
- 18.1.3. Anti-Obesity Drugs Market for Centrally Acting and Peripherally Acting Drugs, Historical Trends (since 2019) and Forecasted Estimates (till 2035)
19. ANTI-OBESITY DRUGS MARKET, BY ROUTE OF ADMINISTRATION
- 19.1. Anti-Obesity Drugs Market: Distribution by Route of Administration
- 19.1.1. Anti-Obesity Drugs Market for Oral Administration, Historical Trends (since 2019) and Forecasted Estimates (till 2035)
- 19.1.2. Anti-Obesity Drugs Market for Parenteral Administration, Historical Trends (since 2019) and Forecasted Estimates (till 2035)
20. ANTI-OBESITY DRUGS MARKET, BY GEOGRAPHICAL REGIONS
- 20.1. Anti-Obesity Drugs Market: Distribution by Geographical Regions
- 20.1.1. Anti-Obesity Drugs Market in North America, Historical Trends (since 2019) and Forecasted Estimates (till 2035)
- 20.1.2. Anti-Obesity Drugs Market in Europe, Historical Trends (since 2019) and Forecasted Estimates (till 2035)
- 20.1.3. Anti-Obesity Drugs Market in Asia-Pacific, Historical Trends (since 2019) and Forecasted Estimates (till 2035)
- 20.1.4. Anti-Obesity Drugs Market in Latin America, Historical Trends (since 2019) and Forecasted Estimates (till 2035)
21. ANTI-OBESITY DRUGS MARKET, SALES FORECAST OF MARKETED AND PHASE III DRUGS
- 21.1. Marketed Drugs: Sales Forecast
- 21.1.1. Contrave / Mysimba (Naltrexone, Bupropion)
- 21.1.2. Feisumei (Beinaglutide)
- 21.1.3. Imcivree (Setmelanotide)
- 21.1.4. LOMAIRA (Phentermine Hydrochloride)
- 21.1.5. QSYMIA (Phentermine and Topiramate)
- 21.1.6. Saxenda (Liraglutide)
- 21.1.7. Wegovy / Ozempic (Semaglutide)
- 21.1.8. Zepbound / Mounjaro (Tirzepatide)
- 21.2. Phase III Drugs: Sales Forecast
- 21.2.1. BI 456906 (Survodutide)
- 21.2.2. CagriSema (Cagrilintide and Semaglutide)
- 21.2.3. HM11260C (Efpeglenatide)
- 21.2.4. HRS-9531
- 21.2.5. IBI362 (Mazdutide)
- 21.2.6. LM-008
- 21.2.7. LY3437943 (Retatrutide)
- 21.2.8. LY3502970 (Orforglipron)
- 21.2.9. TG103
- 21.2.10. Semaglutide 7.2 mg (Subcutaneous)
- 21.2.11. Semaglutide (Oral)
- 21.2.12. XW003
22. ANTI-OBESITY DRUGS MARKET, BY KEY PLAYERS
- 22.1. Anti-Obesity Drugs Market: Distribution of Key Players
23. APPENDIX 1: TABULATED DATA
24. APPENDIX 2: LIST OF COMPANIES AND ORGANIZATIONS
List of Tables
- Table 7.1 List of Anti-Obesity Drugs
- Table 7.2 List of Anti-Obesity Drug Developers
- Table 8.1 Eli Lily: Pipeline Portfolio
- Table 8.2 Eli Lily: Recent Developments and Future Outlook
- Table 8.3 Pfizer: Pipeline Portfolio
- Table 8.4 Pfizer: Recent Developments and Future Outlook
- Table 8.5 Regeneron: Pipeline Portfolio
- Table 8.6 Regeneron: Recent Developments and Future Outlook
- Table 8.7 CinFina Pharma: Pipeline Portfolio
- Table 8.8 Kallyope: Pipeline Portfolio
- Table 8.9 Viking Therapeutics: Pipeline Portfolio
- Table 9.1 AstraZeneca: Pipeline Portfolio
- Table 9.2 AstraZeneca: Recent Developments and Future Outlook
- Table 9.3 Novo Nordisk: Pipeline Portfolio
- Table 9.4 Novo Nordisk: Recent Developments and Future Outlook
- Table 9.5 Roche: Pipeline Portfolio
- Table 9.6 Roche: Recent Developments and Future Outlook
- Table 9.7 Adocia: Pipeline Portfolio
- Table 9.8 Boehringer Ingelheim: Pipeline Portfolio
- Table 9.9 Zealand Pharma: Pipeline Portfolio
- Table 10.1 Hanmi Pharmaceuticals: Pipeline Portfolio
- Table 10.2 Hanmi Pharmaceuticals: Recent Developments and Future Outlook
- Table 10.3 Jiangsu Hengrui Pharmaceuticals: Pipeline Portfolio
- Table 10.4 Jiangsu Hengrui Pharmaceuticals: Recent Developments and Future Outlook
- Table 10.5 Gmax Biopharma: Pipeline Portfolio
- Table 10.6 PegBio: Pipeline Portfolio
- Table 10.7 QL Biopharm: Pipeline Portfolio
- Table 10.8 Sciwind Biosciences: Pipeline Portfolio
- Table 11.1 Big Pharma Players: List of Anti-obesity Focused Initiatives
- Table 13.1 Anti-obesity Market: List of Forecasted Drugs
- Table 23.1 Anti-Obesity Drugs: Distribution by Status of Development
- Table 23.2 Anti-Obesity Drugs: Distribution by Type of Molecule
- Table 23.3 Anti-Obesity Drugs: Distribution by Mechanism of Action
- Table 23.4 Anti-Obesity Drugs: Distribution by Type of Agonist
- Table 23.5 Anti-Obesity Drugs: Distribution by Route of Administration
- Table 23.6 Anti-Obesity Drugs: Distribution by Dosage Frequency
- Table 23.7 Anti-Obesity Drugs: Distribution by Type of Therapy
- Table 23.8 Anti-Obesity Drug Developers: Distribution by Year of Establishment
- Table 23.9 Anti-Obesity Drug Developers: Distribution by Company Size
- Table 23.10 Anti-Obesity Drug Developers: Distribution by Location of Headquarters
- Table 23.11 Anti-Obesity Drug Developers: Distribution by Headquarters (Country) and Status of Development
- Table 23.12 Most Active Developers: Distribution by Number of Drugs
- Table 23.13 Eli Lilly: Annual Revenues (USD Billion)
- Table 23.14 Pfizer: Annual Revenues (USD Billion)
- Table 23.15 Regeneron: Annual Revenues (USD Billion)
- Table 23.16 AstraZeneca: Annual Revenues (USD Billion)
- Table 23.17 Novo Nordisk: Annual Revenues (DKK Billion)
- Table 23.18 Roche: Annual Revenues (CHF Billion)
- Table 23.19 Hanmi Pharmaceuticals: Annual Revenues (KRW Billion)
- Table 23.20 Jiangsu Hengrui Pharmaceuticals: Annual Revenues (CNY Billion)
- Table 23.21 Big Pharma Initiatives: Distribution of Big Pharma Players by Number of Initiatives
- Table 23.22 Big Pharma Initiatives: Distribution by Year of Initiative
- Table 23.23 Big Pharma Initiatives: Distribution by Big Pharma Players by Year and Number of Initiatives
- Table 23.24 Big Pharma Initiatives: Distribution by Type of Initiative
- Table 23.25 Big Pharma Initiatives: Distribution by Year and Type of Initiative
- Table 23.26 Big Pharma Initiatives: Distribution by Big Pharma Players and Type of Initiative
- Table 23.27 Big Pharma Initiatives: Distribution by Type of Partnership
- Table 23.28 Big Pharma Initiatives: Distribution by Type of Expansion
- Table 23.29 Big Pharma Initiatives: Distribution by Big Pharma Players by Region and Number of Initiatives
- Table 23.30 Global Anti-Obesity Drug Market, Historical Trends (Since 2019) and Forecasted Estimates (Till 2035)
- Table 23.31 Global Anti-obesity Drugs Market, till 2035 (USD Billion): Conservative Scenario
- Table 23.32 Global Anti-obesity Drugs Market, till 2035 (USD Billion): Optimistic Scenario
- Table 23.33 Anti-obesity Drugs Market: Distribution by Type of Molecule
- Table 23.34 Anti-obesity Market for Biologics, till 2035 (USD Billion)
- Table 23.35 Anti-obesity Market for Small Molecules, till 2035 (USD Billion)
- Table 23.36 Anti-obesity Drugs Market: Distribution by Active Compound Used
- Table 23.37 Anti-obesity Market for Tirzepatide, till 2035 (USD Billion)
- Table 23.38 Anti-obesity Market for Semaglutide, till 2035 (USD Billion)
- Table 23.39 Anti-obesity Market for Retatrutide, till 2035 (USD Billion)
- Table 23.40 Anti-obesity Market for Survodutide, till 2035 (USD Billion)
- Table 23.41 Anti-obesity Market for Cagrilintide / Semaglutide, till 2035 (USD Billion)
- Table 23.42 Anti-obesity Market for Orforglipron, till 2035 (USD Billion)
- Table 23.43 Anti-obesity Market for Liraglutide, till 2035 (USD Billion)
- Table 23.44 Anti-obesity Market for Other Compounds, till 2035 (USD Billion)
- Table 23.45 Anti-obesity Drugs Market: Distribution by Mechanism of Action
- Table 23.46 Anti-obesity Market for GLP-1 Agonist / GIP Agonist, till 2035 (USD Billion)
- Table 23.47 Anti-obesity Market for GLP-1 Agonist, till 2035 (USD Billion)
- Table 23.48 Anti-obesity Market for GLP-1 / GCGR / GIP Agonist, till 2035 (USD Billion)
- Table 23.49 Anti-obesity Market for GLP-1 Agonist / GCGR Agonist, till 2035 (USD Billion)
- Table 23.50 Anti-obesity Market for GLP-1 Agonist / Amylin Analogue, till 2035 (USD Billion)
- Table 23.51 Anti-obesity Market for Other Mechanisms of Action, till 2035 (USD Billion)
- Table 23.52 Anti-obesity Market: Distribution by Type of Agonist
- Table 23.53 Anti-obesity Market for Single-Agonist, till 2035 (USD Billion)
- Table 23.54 Anti-obesity Market for Dual-Agonist, till 2035 (USD Billion)
- Table 23.55 Anti-obesity Market for Tri-Agonist, till 2035 (USD Billion)
- Table 23.56 Anti-obesity Drugs Market: Distribution by Action Pathway
- Table 23.57 Anti-obesity Market for Centrally Acting Drugs, till 2035 (USD Billion)
- Table 23.58 Anti-obesity Market for Peripherally Acting Drugs, till 2035 (USD Billion)
- Table 23.59 Anti-obesity Market for Centrally and Peripherally Acting, till 2035 (USD Billion)
- Table 23.60 Anti-obesity Drugs Market: Distribution by Route of Administration
- Table 23.61 Anti-obesity Market for Parenteral Administration, till 2035 (USD Billion)
- Table 23.62 Anti-obesity Market for Oral Administration, till 2035 (USD Billion)
- Table 23.63 Anti-obesity Drugs Market: Distribution by Geography
- Table 23.64 Anti-obesity Market in North America, till 2035 (USD Billion)
- Table 23.65 Anti-obesity Market in North America (country-wise), till 2035 (USD Billion)
- Table 23.66 Anti-obesity Market in Europe, till 2035 (USD Billion)
- Table 23.67 Anti-obesity Market in Europe (country-wise), till 2035 (USD Billion)
- Table 23.68 Anti-obesity Market in Asia-Pacific, till 2035 (USD Billion)
- Table 23.69 Anti-obesity Market in Asia-Pacific (country-wise), till 2035 (USD Billion)
- Table 23.70 Anti-obesity Market in Latin America, till 2035 (USD Billion)
- Table 23.71 Anti-obesity Market in Latin America (country-wise), till 2035 (USD Billion)
- Table 23.72 Contrave / Mysimba (Naltrexone, Bupropion) Sales Forecast, till 2035 (USD Billion)
- Table 23.73 Feisumei (Beinaglutide) Sales Forecast, till 2035 (USD Billion)
- Table 23.74 Imcivree (Setmelanotide) Sales Forecast, till 2035 (USD Billion)
- Table 23.75 LOMAIRA (Phentermine Hydrochloride) Sales Forecast, till 2035 (USD Billion)
- Table 23.76 QSYMIA (Phentermine and Topiramate) Sales Forecast, till 2035 (USD Billion)
- Table 23.77 Saxenda (Liraglutide) Sales Forecast, till 2035 (USD Billion)
- Table 23.78 Wegovy / Ozempic (Semaglutide) Sales Forecast, till 2035 (USD Billion)
- Table 23.79 Zepbound / Mounjaro (Tirzepatide) Sales Forecast, till 2035 (USD Billion)
- Table 23.80 BI 456906 (Survodutide) Sales Forecast, till 2035 (USD Billion)
- Table 23.81 CagriSema (Cagrilintide and Semaglutide) Sales Forecast, till 2035 (USD Billion)
- Table 23.82 HM11260C (Efpeglenatide) Sales Forecast, till 2035 (USD Billion)
- Table 23.83 HRS-9531 Sales Forecast, till 2035 (USD Billion)
- Table 23.84 IBI362 (Mazdutide) Sales Forecast, till 2035 (USD Billion)
- Table 23.85 LM-008 Sales Forecast, till 2035 (USD Billion)
- Table 23.86 LY3437943 (Retatrutide) Sales Forecast, till 2035 (USD Billion)
- Table 23.87 LY3502970 (Orforglipron) Sales Forecast, till 2035 (USD Billion)
- Table 23.88 TG103 Sales Forecast, till 2035 (USD Billion)
- Table 23.89 Semaglutide 7.2 mg (Subcutaneous) Sales Forecast, till 2035 (USD Billion)
- Table 23.90 Semaglutide (Oral) Sales Forecast, till 2035 (USD Billion)
- Table 23.91 XW003 Sales Forecast, till 2035 (USD Billion)
- Table 23.92 Anti-obesity Drugs Market: Distribution by Key Players, 2020 (USD Billion)
- Table 23.93 Anti-obesity Drugs Market: Distribution by Key Players, Current Year (USD Billion)
- Table 23.94 Anti-obesity Drugs Market: Distribution by Key Players, 2035 (USD Billion)
List of Figures
- Figure 2.1 Research Methodology: Project Methodology
- Figure 2.2 Research Methodology: Forecast Methodology
- Figure 3.1 Lessons Learnt from Past Recessions
- Figure 6.1 Health Risks Linked with Long-term Obesity
- Figure 6.2 Currently Approved Anti-Obesity Drug Classes
- Figure 7.1 Anti-Obesity Drugs: Distribution by Status of Development
- Figure 7.2 Anti-Obesity Drugs: Distribution by Type of Molecule
- Figure 7.3 Anti-Obesity Drugs: Distribution by Mechanism of Action
- Figure 7.4 Anti-Obesity Drugs: Distribution by Type of Agonist
- Figure 7.5 Anti-Obesity Drugs: Distribution by Route of Administration
- Figure 7.6 Anti-Obesity Drugs: Distribution by Dosage Frequency
- Figure 7.7 Anti-Obesity Drugs: Distribution by Type of Therapy
- Figure 7.8 Anti-Obesity Drug Developers: Distribution by Year of Establishment
- Figure 7.9 Anti-Obesity Drug Developers: Distribution by Company Size
- Figure 7.10 Anti-Obesity Drug Developers: Distribution by Location of Headquarters
- Figure 7.11 Anti-Obesity Drug Developers: Distribution by Headquarters (Country) and Status of Development
- Figure 7.12 Most Active Developers: Distribution by Number of Drug Candidates
- Figure 8.1 Eli Lilly: Annual Revenues (USD Billion)
- Figure 8.2 Pfizer: Annual Revenues (USD Billion)
- Figure 8.3 Regeneron: Annual Revenues (USD Billion)
- Figure 9.1 AstraZeneca: Annual Revenues (USD Billion)
- Figure 9.2 Novo Nordisk: Annual Revenues (DKK Billion)
- Figure 9.3 Roche: Annual Revenues (CHF Billion)
- Figure 10.1 Hanmi Pharmaceuticals: Annual Revenues (KRW Billion)
- Figure 10.2 Jiangsu Hengrui Pharmaceuticals: Annual Revenues (CNY Billion)
- Figure 11.1 Big Pharma Initiatives: Distribution of Big Pharma Players by Number
of Initiatives
- Figure 11.2 Big Pharma Initiatives: Distribution by Year of Initiative
Figure 11.3Big Pharma Initiatives: Distribution by Big Pharma Players by Year and Number of Initiatives
- Figure 11.4 Big Pharma Initiatives: Distribution by Type of Initiative
- Figure 11.5 Big Pharma Initiatives: Distribution by Year and Type of Initiative
- Figure 11.6 Big Pharma Initiatives: Distribution by Big Pharma Players and Type of Initiative
- Figure 11.7 Big Pharma Initiatives: Distribution by Type of Partnership
- Figure 11.8 Big Pharma Initiatives: Distribution by Type of Expansion
- Figure 11.9 Big Pharma Initiatives: Distribution of Big Pharma Players by Region and Number of Initiatives
- Figure 11.10 Benchmarking of Big Pharma Players
- Figure 12.1 Anti-Obesity Drugs: Market Drivers
- Figure 12.2 Anti-Obesity Drugs: Market Restraints
- Figure 12.3 Anti-Obesity Drugs: Market Opportunities
- Figure 12.4 Anti-Obesity Drugs: Market Challenges
- Figure 13.1 Global Anti-Obesity Drug Market, Historical Trends (Since 2019) and Forecasted Estimates (till 2035)
- Figure 13.2 Global Anti-obesity Drugs Market, till 2035 (USD Billion) (USD Billion): Conservative Scenario
- Figure 13.3 Global Anti-obesity Drugs Market, till 2035 (USD Billion) (USD Billion): Optimistic Scenario
- Figure 14.1 Anti-obesity Drugs Market: Distribution by Type of Molecule
- Figure 14.2 Anti-obesity Market for Biologics, till 2035 (USD Billion)
- Figure 14.3 Anti-obesity Market for Small Molecules, till 2035 (USD Billion)
- Figure 15.1 Anti-obesity Drugs Market: Distribution by Active Compound Used
- Figure 15.2 Anti-obesity Market for Tirzepatide, till 2035 (USD Billion)
- Figure 15.3 Anti-obesity Market for Semaglutide, till 2035 (USD Billion)
- Figure 15.4 Anti-obesity Market for Retatrutide, till 2035 (USD Billion)
- Figure 15.5 Anti-obesity Market for Survodutide, till 2035 (USD Billion)
- Figure 15.6 Anti-obesity Market for Cagrilintide / Semaglutide, till 2035 (USD Billion)
- Figure 15.7 Anti-obesity Market for Orforglipron, till 2035 (USD Billion)
- Figure 15.8 Anti-obesity Market for Liraglutide, till 2035 (USD Billion)
- Figure 15.9 Anti-obesity Market for Other Compounds, till 2035 (USD Billion)
- Figure 16.1 Anti-obesity Drugs Market: Distribution by Mechanism of Action
- Figure 16.2 Anti-obesity Market for GLP-1 Agonist / GIP Agonist, till 2035 (USD Billion)
- Figure 16.3 Anti-obesity Market for GLP-1 Agonist, till 2035 (USD Billion)
- Figure 16.4 Anti-obesity Market for GLP-1 / GCGR / GIP Agonist, till 2035 (USD Billion)
- Figure 16.5 Anti-obesity Market for GLP-1 Agonist / GCGR Agonist, till 2035 (USD Billion)
- Figure 16.6 Anti-obesity Market for GLP-1 Agonist / Amylin Analogue, till 2035 (USD Billion)
- Figure 16.7 Anti-obesity Market for Other Mechanisms of Action, till 2035 (USD Billion)
- Figure 17.1 Anti-obesity Market: Distribution by Type of Agonist
- Figure 17.2 Anti-obesity Market for Single-Agonist, till 2035 (USD Billion)
- Figure 17.3 Anti-obesity Market for Dual-Agonist, till 2035 (USD Billion)
- Figure 17.4 Anti-obesity Market for Tri-Agonist, till 2035 (USD Billion)
- Figure 18.1 Anti-obesity Drugs Market: Distribution by Action Pathway
- Figure 18.2 Anti-obesity Market for Centrally Acting Drugs, till 2035 (USD Billion)
- Figure 18.3 Anti-obesity Market for Peripherally Acting Drugs, till 2035 (USD Billion)
- Figure 18.4 Anti-obesity Market for Centrally and Peripherally Acting Drugs, till 2035 (USD Billion)
- Figure 19.1 Anti-obesity Drugs Market: Distribution by Route of Administration
- Figure 19.2 Anti-obesity Market for Parenteral Administration, till 2035 (USD Billion)
- Figure 19.3 Anti-obesity Market for Oral Administration, till 2035 (USD Billion)
- Figure 20.1 Anti-obesity Drugs Market: Distribution by Geographical Regions
- Figure 20.2 Anti-obesity Market in North America, till 2035 (USD Billion)
- Figure 20.3 Anti-obesity Market in North America (country-wise), till 2035 (USD Billion)
- Figure 20.4 Anti-obesity Market in Europe, till 2035 (USD Billion)
- Figure 20.5 Anti-obesity Market in Europe (country-wise), till 2035 (USD Billion)
- Figure 20.6 Anti-obesity Market in Asia-Pacific, till 2035 (USD Billion)
- Figure 20.7 Anti-obesity Market in Asia-Pacific (country-wise), till 2035 (USD Billion)
- Figure 20.8 Anti-obesity Market in Latin America, till 2035 (USD Billion)
- Figure 20.9 Anti-obesity Market in Latin America (country-wise), till 2035 (USD Billion)
- Figure 21.1 Contrave / Mysimba (Naltrexone, Bupropion) Sales Forecast, till 2035 (USD Billion)
- Figure 21.2 Feisumei (Beinaglutide) Sales Forecast, till 2035 (USD Billion)
- Figure 21.3 Imcivree (Setmelanotide) Sales Forecast, till 2035 (USD Billion)
- Figure 21.4 LOMAIRA (Phentermine Hydrochloride) Sales Forecast, till 2035 (USD Billion)
- Figure 21.5 QSYMIA (Phentermine and Topiramate) Sales Forecast, till 2035 (USD Billion)
- Figure 21.6 Saxenda (Liraglutide) Sales Forecast, till 2035 (USD Billion)
- Figure 21.7 Wegovy / Ozempic (Semaglutide) Sales Forecast, till 2035 (USD Billion)
- Figure 21.8 Zepbound / Mounjaro (Tirzepatide) Sales Forecast, till 2035 (USD Billion)
- Figure 21.9 BI 456906 (Survodutide) Sales Forecast, till 2035 (USD Billion)
- Figure 21.10 CagriSema (Cagrilintide and Semaglutide) Sales Forecast, till 2035 (USD Billion)
- Figure 21.11 HM11260C (Efpeglenatide) Sales Forecast, till 2035 (USD Billion)
- Figure 21.12 HRS-9531 Sales Forecast, till 2035 (USD Billion)
- Figure 21.13 IBI362 (Mazdutide) Sales Forecast, till 2035 (USD Billion)
- Figure 21.14 LM-008 Sales Forecast, till 2035 (USD Billion)
- Figure 21.15 LY3437943 (Retatrutide) Sales Forecast, till 2035 (USD Billion)
- Figure 21.16 LY3502970 (Orforglipron) Sales Forecast, till 2035 (USD Billion)
- Figure 21.17 TG103 Sales Forecast, till 2035 (USD Billion)
- Figure 21.18 Semaglutide 7.2 mg (Subcutaneous) Sales Forecast, till 2035 (USD Billion)
- Figure 21.19 Semaglutide (Oral) Sales Forecast, till 2035 (USD Billion)
- Figure 21.20 XW003 Sales Forecast, till 2035 (USD Billion)
- Figure 22.1 Anti-obesity Drugs Market: Distribution by Key Players, 2020 (USD Billion)
- Figure 22.2 Anti-obesity Drugs Market: Distribution by Key Players, Current Year (USD Billion)
- Figure 22.3 Anti-obesity Drugs Market: Distribution by Key Players, 2035 (USD Billion)

