
PUBLISHER: Roots Analysis | PRODUCT CODE: 1821525

PUBLISHER: Roots Analysis | PRODUCT CODE: 1821525
Metamaterials Market, Till 2035: Distribution by Type of Metamaterial, Product Form, Application, Type of Enterprise, End Use Industry and Geographical Regions
Metamaterials Market Overview
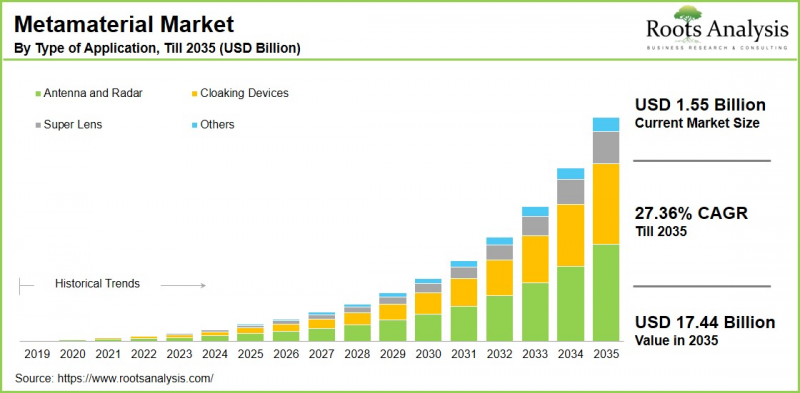
As per Roots Analysis, the global metamaterials market size is estimated to grow from USD 1.55 billion in the current year to USD 17.44 billion by 2035, at a CAGR of 27.36% during the forecast period, till 2035.
The opportunity for metamaterials market has been distributed across the following segments:
Type of Metamaterial
- Electromagnetic
- Optical
- Thermal
- Acoustic
- Other Metamaterials
Application
- Antenna and Radar
- Super Lens
- Cloaking Devices
- Other Applications
Product Form
- Thin Films
- Bulk Materials
End Use Industry
- Consumer Electronics
- Aerospace and Defense
- Automotive
- Energy and Power
- Medical
- Other Industries
Geographical Regions
- North America
- US
- Canada
- Mexico
- Other North American countries
- Europe
- Austria
- Belgium
- Denmark
- France
- Germany
- Ireland
- Italy
- Netherlands
- Norway
- Russia
- Spain
- Sweden
- Switzerland
- UK
- Other European countries
- Asia
- China
- India
- Japan
- Singapore
- South Korea
- Other Asian countries
- Latin America
- Brazil
- Chile
- Colombia
- Venezuela
- Other Latin American countries
- Middle East and North Africa
- Egypt
- Iran
- Iraq
- Israel
- Kuwait
- Saudi Arabia
- UAE
- Other MENA countries
- Rest of the World
- Australia
- New Zealand
- Other countries
Metamaterials Market: Growth and Trends
Metals have been an essential component of antennas since their invention in 1888. However, traditional metals were limited in functionality as they could not efficiently operate across multiple frequencies. This resulted in significant energy loss and restricted performance. To address these challenges, metamaterials were developed that are capable of manipulating electromagnetic waves, radio signals, and even light. These materials are designed by arranging nano- and micro-scale patterns, giving them the unique ability to absorb or redirect waves in controlled directions.
One of the most noteworthy advantages of metamaterials is their ability to function across a broad range of frequencies, enabling faster and more reliable wireless networks, including advancements in 5G technology. Beyond telecommunications, their precision, modular design, and advanced material properties make them highly attractive for industries such as automotive, aerospace, and defense.
The metamaterials market is increasingly recognized as a vital element in the global push for innovation and efficiency. The use of diverse raw materials has further expanded their application potential. Active research and development, particularly at leading institutions like the University of Glasgow and Imperial College London, is accelerating breakthroughs in this space. Owing to the above mentioned reasons, the metamaterials market is expected to grow at a steady pace during the forecast period.
Metamaterials Market: Key Segments
Market Share by Type of Metamaterial
Based on type of metamaterial, the global metamaterials market is segmented into electromagnetic, frequency selective surface, photonic, terahertz, tunable and others. According to our estimates, currently, the electromagnetic segment captures the majority of the market share and this trend is unlikely to change in future.
This can be attributed to the tunable properties of electromagnetic metamaterials, which enable precise control and manipulation of electromagnetic waves across specific frequency ranges. As a result, they are highly suited for advanced applications such as optical lenses, cloaking devices, and next-generation wireless communication systems.
Market Share by Applications
Based on applications, the global metamaterials market is segmented into antenna and radar, cloaking devices, super lens and others. According to our estimates, currently, the antenna and radar segment captures the majority of the market share during the forecast period. This can be attributed to the enhanced signal detection and imaging capabilities of metamaterials, which improve both resolution and range. Such advancements are expanding their use in medical imaging as well as in the aerospace and defense industries.
Further, this segment is anticipated to grow at a relatively higher rate during the forecast period, owing to the progress in miniaturized technologies, advanced telecommunications materials, and the adoption of 5G, which is further accelerating the demand for metamaterials.
Market Share by Type of Product Form
Based on type of product form, the global metamaterials market is segmented into bulk materials and thin films. According to our estimates, currently, the thin layer segment captures the majority of the market share. Additionally, the electromagnetic metamaterials segment is expected to witness strong growth, during the forecast period. This can be attributed to advancements in fabrication techniques, particularly the use of metamaterials and FeSi alloy, which enable the achievement of a bandwidth range of 11-16.8 Hz.
Market Share by End-Users
Based on end-users, the global metamaterials market is segmented into aerospace and defense, automotive, consumer electronics, energy and power, medical and others. According to our estimates, currently, the aerospace and defense segment captures the majority of the market share. However, the new installations segment is expected to grow at a higher CAGR during the forecast period, owing to the development of advanced antennas and radar systems that feature smaller sizes, improved performance, and wider frequency bandwidths.
On the other hand, the medical segment is expected to grow at a higher CAGR during the forecast period. This rapid expansion is fueled by the integration of metamaterials into imaging and diagnostic technologies, enhancing resolution, accuracy, and overall efficiency of medical devices.
Market Share by Type of Enterprises
Based on end-users, the global metamaterials market is segmented into large enterprises and small and medium enterprises. According to our estimates, currently, the large enterprise segment captures the majority of the market share. This can be attributed to their strong financial resources, extensive R&D capabilities, established market presence, and ability to drive large-scale business growth.
On the other hand, the SME segment is expected to grow at a higher CAGR during the forecast period. This is fueled by their agility in adopting emerging technologies, which enables them to quickly enhance operational efficiency, lower costs, and deliver improved customer experiences.
Market Share by Geographical Regions
Based on geographical regions, the metamaterials market is segmented into North America, Europe, Asia, Latin America, Middle East and North Africa, and the rest of the world. According to our estimates, currently, North America captures the majority share of the market. This can be attributed to the presence of key industry players, significant R&D investments, and a strong emphasis on military and defense, aerospace, and advanced wireless network technologies.
Further, Asia is expected to experience a higher CAGR during this forecast period, fueled by the rapid adoption of new technologies, the widespread rollout of 5G networks, and rising defense expenditures in major developing economies such as India, China, and Japan.
Example Players in Metamaterials Market
- Acoustic Metamaterials
- Advanced Research Projects Agency
- Cellink
- Echodyne
- Evolv Technologies
- Fractal Antenna Systems
- JEM Engineering
- Kymeta
- Metamagnetics
- Metamaterial Technology
- Metashield
- Multiwave Technologies
- Nanohmics
- Palo Alto Research Center
- Plasmonics
- Sandvik Materials Technology
- TeraView
Metamaterials Market: Research Coverage
The report on the metamaterials market features insights on various sections, including:
- Market Sizing and Opportunity Analysis: An in-depth analysis of the metamaterials market, focusing on key market segments, including [A] type of metamaterial, [B] product form, [C] application, [D] type of enterprise, [E] end use industry and [F] geographical regions.
- Competitive Landscape: A comprehensive analysis of the companies engaged in the metamaterials market, based on several relevant parameters, such as [A] year of establishment, [B] company size, [C] location of headquarters and [D] ownership structure.
- Company Profiles: Elaborate profiles of prominent players engaged in the metamaterials market, providing details on [A] location of headquarters, [B] company size, [C] company mission, [D] company footprint, [E] management team, [F] contact details, [G] financial information, [H] operating business segments, [I] metamaterials portfolio, [J] moat analysis, [K] recent developments, and an informed future outlook.
- Megatrends: An evaluation of ongoing megatrends in the metamaterials industry.
- Patent Analysis: An insightful analysis of patents filed / granted in the metamaterials domain, based on relevant parameters, including [A] type of patent, [B] patent publication year, [C] patent age and [D] leading players.
- Recent Developments: An overview of the recent developments made in the metamaterials market, along with analysis based on relevant parameters, including [A] year of initiative, [B] type of initiative, [C] geographical distribution and [D] most active players.
- Porter's Five Forces Analysis: An analysis of five competitive forces prevailing in the metamaterials market, including threats of new entrants, bargaining power of buyers, bargaining power of suppliers, threats of substitute products and rivalry among existing competitors.
- SWOT Analysis: An insightful SWOT framework, highlighting the strengths, weaknesses, opportunities and threats in the domain. Additionally, it provides Harvey ball analysis, highlighting the relative impact of each SWOT parameter.
- Value Chain Analysis: A comprehensive analysis of the value chain, providing information on the different phases and stakeholders involved in the metamaterials market
Key Questions Answered in this Report
- How many companies are currently engaged in metamaterials market?
- Which are the leading companies in this market?
- What factors are likely to influence the evolution of this market?
- What is the current and future market size?
- What is the CAGR of this market?
- How is the current and future market opportunity likely to be distributed across key market segments?
Reasons to Buy this Report
- The report provides a comprehensive market analysis, offering detailed revenue projections of the overall market and its specific sub-segments. This information is valuable to both established market leaders and emerging entrants.
- Stakeholders can leverage the report to gain a deeper understanding of the competitive dynamics within the market. By analyzing the competitive landscape, businesses can make informed decisions to optimize their market positioning and develop effective go-to-market strategies.
- The report offers stakeholders a comprehensive overview of the market, including key drivers, barriers, opportunities, and challenges. This information empowers stakeholders to stay abreast of market trends and make data-driven decisions to capitalize on growth prospects.
Additional Benefits
- Complimentary Excel Data Packs for all Analytical Modules in the Report
- 15% Free Content Customization
- Detailed Report Walkthrough Session with Research Team
- Free Updated report if the report is 6-12 months old or older
TABLE OF CONTENTS
SECTION I: REPORT OVERVIEW
1. PREFACE
- 1.1. Introduction
- 1.2. Market Share Insights
- 1.3. Key Market Insights
- 1.4. Report Coverage
- 1.5. Key Questions Answered
- 1.6. Chapter Outlines
2. RESEARCH METHODOLOGY
- 2.1. Chapter Overview
- 2.2. Research Assumptions
- 2.3. Database Building
- 2.3.1. Data Collection
- 2.3.2. Data Validation
- 2.3.3. Data Analysis
- 2.4. Project Methodology
- 2.4.1. Secondary Research
- 2.4.1.1. Annual Reports
- 2.4.1.2. Academic Research Papers
- 2.4.1.3. Company Websites
- 2.4.1.4. Investor Presentations
- 2.4.1.5. Regulatory Filings
- 2.4.1.6. White Papers
- 2.4.1.7. Industry Publications
- 2.4.1.8. Conferences and Seminars
- 2.4.1.9. Government Portals
- 2.4.1.10. Media and Press Releases
- 2.4.1.11. Newsletters
- 2.4.1.12. Industry Databases
- 2.4.1.13. Roots Proprietary Databases
- 2.4.1.14. Paid Databases and Sources
- 2.4.1.15. Social Media Portals
- 2.4.1.16. Other Secondary Sources
- 2.4.2. Primary Research
- 2.4.2.1. Introduction
- 2.4.2.2. Types
- 2.4.2.2.1. Qualitative
- 2.4.2.2.2. Quantitative
- 2.4.2.3. Advantages
- 2.4.2.4. Techniques
- 2.4.2.4.1. Interviews
- 2.4.2.4.2. Surveys
- 2.4.2.4.3. Focus Groups
- 2.4.2.4.4. Observational Research
- 2.4.2.4.5. Social Media Interactions
- 2.4.2.5. Stakeholders
- 2.4.2.5.1. Company Executives (CXOs)
- 2.4.2.5.2. Board of Directors
- 2.4.2.5.3. Company Presidents and Vice Presidents
- 2.4.2.5.4. Key Opinion Leaders
- 2.4.2.5.5. Research and Development Heads
- 2.4.2.5.6. Technical Experts
- 2.4.2.5.7. Subject Matter Experts
- 2.4.2.5.8. Scientists
- 2.4.2.5.9. Doctors and Other Healthcare Providers
- 2.4.2.6. Ethics and Integrity
- 2.4.2.6.1. Research Ethics
- 2.4.2.6.2. Data Integrity
- 2.4.3. Analytical Tools and Databases
- 2.4.1. Secondary Research
3. MARKET DYNAMICS
- 3.1. Forecast Methodology
- 3.1.1. Top-Down Approach
- 3.1.2. Bottom-Up Approach
- 3.1.3. Hybrid Approach
- 3.2. Market Assessment Framework
- 3.2.1. Total Addressable Market (TAM)
- 3.2.2. Serviceable Addressable Market (SAM)
- 3.2.3. Serviceable Obtainable Market (SOM)
- 3.2.4. Currently Acquired Market (CAM)
- 3.3. Forecasting Tools and Techniques
- 3.3.1. Qualitative Forecasting
- 3.3.2. Correlation
- 3.3.3. Regression
- 3.3.4. Time Series Analysis
- 3.3.5. Extrapolation
- 3.3.6. Convergence
- 3.3.7. Forecast Error Analysis
- 3.3.8. Data Visualization
- 3.3.9. Scenario Planning
- 3.3.10. Sensitivity Analysis
- 3.4. Key Considerations
- 3.4.1. Demographics
- 3.4.2. Market Access
- 3.4.3. Reimbursement Scenarios
- 3.4.4. Industry Consolidation
- 3.5. Robust Quality Control
- 3.6. Key Market Segmentations
- 3.7. Limitations
4. MACRO-ECONOMIC INDICATORS
- 4.1. Chapter Overview
- 4.2. Market Dynamics
- 4.2.1. Time Period
- 4.2.1.1. Historical Trends
- 4.2.1.2. Current and Forecasted Estimates
- 4.2.2. Currency Coverage
- 4.2.2.1. Overview of Major Currencies Affecting the Market
- 4.2.2.2. Impact of Currency Fluctuations on the Industry
- 4.2.3. Foreign Exchange Impact
- 4.2.3.1. Evaluation of Foreign Exchange Rates and Their Impact on Market
- 4.2.3.2. Strategies for Mitigating Foreign Exchange Risk
- 4.2.4. Recession
- 4.2.4.1. Historical Analysis of Past Recessions and Lessons Learnt
- 4.2.4.2. Assessment of Current Economic Conditions and Potential Impact on the Market
- 4.2.5. Inflation
- 4.2.5.1. Measurement and Analysis of Inflationary Pressures in the Economy
- 4.2.5.2. Potential Impact of Inflation on the Market Evolution
- 4.2.6. Interest Rates
- 4.2.6.1. Overview of Interest Rates and Their Impact on the Market
- 4.2.6.2. Strategies for Managing Interest Rate Risk
- 4.2.7. Commodity Flow Analysis
- 4.2.7.1. Type of Commodity
- 4.2.7.2. Origins and Destinations
- 4.2.7.3. Values and Weights
- 4.2.7.4. Modes of Transportation
- 4.2.8. Global Trade Dynamics
- 4.2.8.1. Import Scenario
- 4.2.8.2. Export Scenario
- 4.2.9. War Impact Analysis
- 4.2.9.1. Russian-Ukraine War
- 4.2.9.2. Israel-Hamas War
- 4.2.10. COVID Impact / Related Factors
- 4.2.10.1. Global Economic Impact
- 4.2.10.2. Industry-specific Impact
- 4.2.10.3. Government Response and Stimulus Measures
- 4.2.10.4. Future Outlook and Adaptation Strategies
- 4.2.11. Other Indicators
- 4.2.11.1. Fiscal Policy
- 4.2.11.2. Consumer Spending
- 4.2.11.3. Gross Domestic Product (GDP)
- 4.2.11.4. Employment
- 4.2.11.5. Taxes
- 4.2.11.6. R&D Innovation
- 4.2.11.7. Stock Market Performance
- 4.2.11.8. Supply Chain
- 4.2.11.9. Cross-Border Dynamics
- 4.2.1. Time Period
SECTION II: QUALITATIVE INSIGHTS
5. EXECUTIVE SUMMARY
6. INTRODUCTION
- 6.1. Chapter Overview
- 6.2. Overview of Metamaterials Market
- 6.2.1. Type of Metamaterial
- 6.2.2. Type of Application
- 6.2.3. Type of Product Forms
- 6.2.4. Type of End-Users
- 6.2.5. Type of Enterprises
- 6.3. Future Perspective
7. REGULATORY SCENARIO
SECTION III: MARKET OVERVIEW
8. COMPREHENSIVE DATABASE OF LEADING PLAYERS
9. COMPETITIVE LANDSCAPE
- 9.1. Chapter Overview
- 9.2. Metamaterials: Overall Market Landscape
- 9.2.1. Analysis by Year of Establishment
- 9.2.2. Analysis by Company Size
- 9.2.3. Analysis by Location of Headquarters
- 9.2.4. Analysis by Ownership Structure
10. WHITE SPACE ANALYSIS
11. COMPANY COMPETITIVENESS ANALYSIS
12. STARTUP ECOSYSTEM IN THE METAMATERIALS MARKET
- 12.1. Metamaterials Market: Market Landscape of Startups
- 12.1.1. Analysis by Year of Establishment
- 12.1.2. Analysis by Company Size
- 12.1.3. Analysis by Company Size and Year of Establishment
- 12.1.4. Analysis by Location of Headquarters
- 12.1.5. Analysis by Company Size and Location of Headquarters
- 12.1.6. Analysis by Ownership Structure
- 12.2. Key Findings
SECTION IV: COMPANY PROFILES
13. COMPANY PROFILES
- 13.1. Chapter Overview
- 13.2. Acoustic Metamaterials*
- 13.2.1. Company Overview
- 13.2.2. Company Mission
- 13.2.3. Company Footprint
- 13.2.4. Management Team
- 13.2.5. Contact Details
- 13.2.6. Financial Performance
- 13.2.7. Operating Business Segments
- 13.2.8. Service / Product Portfolio (project specific)
- 13.2.9. MOAT Analysis
- 13.2.10. Recent Developments and Future Outlook
- 13.3. Advanced Research Projects Agency
- 13.4. Cellink
- 13.5. Echodyne
- 13.6. Elolv Technologies
- 13.7. Fractal Antenna Systems
- 13.8. JEM Engineering
- 13.9. Kymeta
- 13.10. Metamagnetics
- 13.11. Metamaterial Technology
- 13.12. Metashield
- 13.13. Multiwave Technologies
- 13.14. Nanohmics
- 13.15. Palo Alto Research Center
- 13.16. Plasmonics
- 13.17. Sandvik Materials Technology
- 13.18. TeraView
SECTION V: MARKET TRENDS
14. MEGA TRENDS ANALYSIS
15. UNMET NEED ANALYSIS
16. PATENT ANALYSIS
17. RECENT DEVELOPMENTS
- 17.1. Chapter Overview
- 17.2. Recent Funding
- 17.3. Recent Partnerships
- 17.4. Other Recent Initiatives
SECTION VI: MARKET OPPORTUNITY ANALYSIS
18. GLOBAL METAMATERIALS MARKET
- 18.1. Chapter Overview
- 18.2. Key Assumptions and Methodology
- 18.3. Trends Disruption Impacting Market
- 18.4. Demand Side Trends
- 18.5. Supply Side Trends
- 18.6. Global Metamaterials Market, Historical Trends (Since 2019) and Forecasted Estimates (Till 2035)
- 18.7. Multivariate Scenario Analysis
- 18.7.1. Conservative Scenario
- 18.7.2. Optimistic Scenario
- 18.8. Investment Feasibility Index
- 18.9. Key Market Segmentations
19. MARKET OPPORTUNITIES BASED ON TYPE OF METAMATERIAL
- 19.1. Chapter Overview
- 19.2. Key Assumptions and Methodology
- 19.3. Revenue Shift Analysis
- 19.4. Market Movement Analysis
- 19.5. Penetration-Growth (P-G) Matrix
- 19.6. Metamaterials Market for Electromagnetic: Historical Trends (Since 2019) and Forecasted Estimates (Till 2035)
- 19.7. Metamaterials Market for Frequency Selective Surface: Historical Trends (Since 2019) and Forecasted Estimates (Till 2035)
- 19.8. Metamaterials Market for Photonic: Historical Trends (Since 2019) and Forecasted Estimates (Till 2035)
- 19.9. Metamaterials Market for Terahertz: Historical Trends (Since 2019) and Forecasted Estimates (Till 2035)
- 19.10. Metamaterials Market for Tunable: Historical Trends (Since 2019) and Forecasted Estimates (Till 2035)
- 19.11. Metamaterials Market for Others: Historical Trends (Since 2019) and Forecasted Estimates (Till 2035)
- 19.12. Data Triangulation and Validation
- 19.12.1. Secondary Sources
- 19.12.2. Primary Sources
- 19.12.3. Statistical Modeling
20. MARKET OPPORTUNITIES BASED ON APPLICATIONS
- 20.1. Chapter Overview
- 20.2. Key Assumptions and Methodology
- 20.3. Revenue Shift Analysis
- 20.4. Market Movement Analysis
- 20.5. Penetration-Growth (P-G) Matrix
- 20.6. Metamaterials Market for Antenna and Radar: Historical Trends (Since 2019) and Forecasted Estimates (Till 2035)
- 20.7. Metamaterials Market for Cloaking Devices: Historical Trends (Since 2019) and Forecasted Estimates (Till 2035)
- 20.8. Metamaterials Market for Super Lens: Historical Trends (Since 2019) and Forecasted Estimates (Till 2035)
- 20.9. Metamaterials Market for Others: Historical Trends (Since 2019) and Forecasted Estimates (Till 2035)
- 20.10. Data Triangulation and Validation
- 20.10.1. Secondary Sources
- 20.10.2. Primary Sources
- 20.10.3. Statistical Modeling
21. MARKET OPPORTUNITIES BASED ON TYPE OF PRODUCT FORM
- 21.1. Chapter Overview
- 21.2. Key Assumptions and Methodology
- 21.3. Revenue Shift Analysis
- 21.4. Market Movement Analysis
- 21.5. Penetration-Growth (P-G) Matrix
- 21.6. Metamaterials Market for Bulk Materials: Historical Trends (Since 2019) and Forecasted Estimates (Till 2035)
- 21.7. Metamaterials Market for Thin Films: Historical Trends (Since 2019) and Forecasted Estimates (Till 2035)
- 21.8. Data Triangulation and Validation
- 21.8.1. Secondary Sources
- 21.8.2. Primary Sources
- 21.8.3. Statistical Modeling
22. MARKET OPPORTUNITIES BASED ON END-USER
- 22.1. Chapter Overview
- 22.2. Key Assumptions and Methodology
- 22.3. Revenue Shift Analysis
- 22.4. Market Movement Analysis
- 22.5. Penetration-Growth (P-G) Matrix
- 22.6. Metamaterials Market for Aerospace and Defense: Historical Trends (Since 2019) and Forecasted Estimates (Till 2035)
- 22.7. Metamaterials Market for Automotive: Historical Trends (Since 2019) and Forecasted Estimates (Till 2035)
- 22.8. Metamaterials Market for Consumer Electronics: Historical Trends (Since 2019) and Forecasted Estimates (Till 2035)
- 22.9. Metamaterials Market for Energy and Power: Historical Trends (Since 2019) and Forecasted Estimates (Till 2035)
- 22.10. Metamaterials Market for Medical: Historical Trends (Since 2019) and Forecasted Estimates (Till 2035)
- 22.11. Metamaterials Market for Others: Historical Trends (Since 2019) and Forecasted Estimates (Till 2035)
- 22.12. Data Triangulation and Validation
- 22.12.1. Secondary Sources
- 22.12.2. Primary Sources
- 22.12.3. Statistical Modeling
23. MARKET OPPORTUNITIES BASED ON TYPE OF ENTERPRISE
- 23.1. Chapter Overview
- 23.2. Key Assumptions and Methodology
- 23.3. Revenue Shift Analysis
- 23.4. Market Movement Analysis
- 23.5. Penetration-Growth (P-G) Matrix
- 23.6. Metamaterials Market for Large Enterprises: Historical Trends (Since 2019) and Forecasted Estimates (Till 2035)
- 23.7. Metamaterials Market for Small and Medium Enterprises: Historical Trends (Since 2019) and Forecasted Estimates (Till 2035)
- 23.8. Data Triangulation and Validation
- 23.8.1. Secondary Sources
- 23.8.2. Primary Sources
- 23.8.3. Statistical Modeling
24. MARKET OPPORTUNITIES FOR METAMATERIALS IN NORTH AMERICA
- 24.1. Chapter Overview
- 24.2. Key Assumptions and Methodology
- 24.3. Revenue Shift Analysis
- 24.4. Market Movement Analysis
- 24.5. Penetration-Growth (P-G) Matrix
- 24.6. Metamaterials Market in North America: Historical Trends (Since 2019) and Forecasted Estimates (Till 2035)
- 24.6.1. Metamaterials Market in the US: Historical Trends (Since 2019) and Forecasted Estimates (Till 2035)
- 24.6.2. Metamaterials Market in Canada: Historical Trends (Since 2019) and Forecasted Estimates (Till 2035)
- 24.6.3. Metamaterials Market in Mexico: Historical Trends (Since 2019) and Forecasted Estimates (Till 2035)
- 24.6.4. Metamaterials Market in Other North American Countries: Historical Trends (Since 2019) and Forecasted Estimates (Till 2035)
- 24.7. Data Triangulation and Validation
25. MARKET OPPORTUNITIES FOR METAMATERIALS IN EUROPE
- 25.1. Chapter Overview
- 25.2. Key Assumptions and Methodology
- 25.3. Revenue Shift Analysis
- 25.4. Market Movement Analysis
- 25.5. Penetration-Growth (P-G) Matrix
- 25.6. Metamaterials Market in Europe: Historical Trends (Since 2019) and Forecasted Estimates (Till 2035)
- 25.6.1. Metamaterials Market in Austria: Historical Trends (Since 2019) and Forecasted Estimates (Till 2035)
- 25.6.2. Metamaterials Market in Belgium: Historical Trends (Since 2019) and Forecasted Estimates (Till 2035)
- 25.6.3. Metamaterials Market in Denmark: Historical Trends (Since 2019) and Forecasted Estimates (Till 2035)
- 25.6.4. Metamaterials Market in France: Historical Trends (Since 2019) and Forecasted Estimates (Till 2035)
- 25.6.5. Metamaterials Market in Germany: Historical Trends (Since 2019) and Forecasted Estimates (Till 2035)
- 25.6.6. Metamaterials Market in Ireland: Historical Trends (Since 2019) and Forecasted Estimates (Till 2035)
- 25.6.7. Metamaterials Market in Italy: Historical Trends (Since 2019) and Forecasted Estimates (Till 2035)
- 25.6.8. Metamaterials Market in Netherlands: Historical Trends (Since 2019) and Forecasted Estimates (Till 2035)
- 25.6.9. Metamaterials Market in Norway: Historical Trends (Since 2019) and Forecasted Estimates (Till 2035)
- 25.6.10. Metamaterials Market in Russia: Historical Trends (Since 2019) and Forecasted Estimates (Till 2035)
- 25.6.11. Metamaterials Market in Spain: Historical Trends (Since 2019) and Forecasted Estimates (Till 2035)
- 25.6.12. Metamaterials Market in Sweden: Historical Trends (Since 2019) and Forecasted Estimates (Till 2035)
- 25.6.13. Metamaterials Market in Switzerland: Historical Trends (Since 2019) and Forecasted Estimates (Till 2035)
- 25.6.14. Metamaterials Market in the UK: Historical Trends (Since 2019) and Forecasted Estimates (Till 2035)
- 25.6.15. Metamaterials Market in Other European Countries: Historical Trends (Since 2019) and Forecasted Estimates (Till 2035)
- 25.7. Data Triangulation and Validation
26. MARKET OPPORTUNITIES FOR METAMATERIALS IN ASIA
- 26.1. Chapter Overview
- 26.2. Key Assumptions and Methodology
- 26.3. Revenue Shift Analysis
- 26.4. Market Movement Analysis
- 26.5. Penetration-Growth (P-G) Matrix
- 26.6. Metamaterials Market in Asia: Historical Trends (Since 2019) and Forecasted Estimates (Till 2035)
- 26.6.1. Metamaterials Market in China: Historical Trends (Since 2019) and Forecasted Estimates (Till 2035)
- 26.6.2. Metamaterials Market in India: Historical Trends (Since 2019) and Forecasted Estimates (Till 2035)
- 26.6.3. Metamaterials Market in Japan: Historical Trends (Since 2019) and Forecasted Estimates (Till 2035)
- 26.6.4. Metamaterials Market in Singapore: Historical Trends (Since 2019) and Forecasted Estimates (Till 2035)
- 26.6.5. Metamaterials Market in South Korea: Historical Trends (Since 2019) and Forecasted Estimates (Till 2035)
- 26.6.6. Metamaterials Market in Other Asian Countries: Historical Trends (Since 2019) and Forecasted Estimates (Till 2035)
- 26.7. Data Triangulation and Validation
27. MARKET OPPORTUNITIES FOR METAMATERIALS IN MIDDLE EAST AND NORTH AFRICA (MENA)
- 27.1. Chapter Overview
- 27.2. Key Assumptions and Methodology
- 27.3. Revenue Shift Analysis
- 27.4. Market Movement Analysis
- 27.5. Penetration-Growth (P-G) Matrix
- 27.6. Metamaterials Market in Middle East and North Africa (MENA): Historical Trends (Since 2019) and Forecasted Estimates (Till 2035)
- 27.6.1. Metamaterials Market in Egypt: Historical Trends (Since 2019) and Forecasted Estimates (Till 205)
- 27.6.2. Metamaterials Market in Iran: Historical Trends (Since 2019) and Forecasted Estimates (Till 2035)
- 27.6.3. Metamaterials Market in Iraq: Historical Trends (Since 2019) and Forecasted Estimates (Till 2035)
- 27.6.4. Metamaterials Market in Israel: Historical Trends (Since 2019) and Forecasted Estimates (Till 2035)
- 27.6.5. Metamaterials Market in Kuwait: Historical Trends (Since 2019) and Forecasted Estimates (Till 2035)
- 27.6.6. Metamaterials Market in Saudi Arabia: Historical Trends (Since 2019) and Forecasted Estimates (Till 2035)
- 27.6.7. Metamaterials Market in United Arab Emirates (UAE): Historical Trends (Since 2019) and Forecasted Estimates (Till 2035)
- 27.6.8. Metamaterials Market in Other MENA Countries: Historical Trends (Since 2019) and Forecasted Estimates (Till 2035)
- 27.7. Data Triangulation and Validation
28. MARKET OPPORTUNITIES FOR METAMATERIALS IN LATIN AMERICA
- 28.1. Chapter Overview
- 28.2. Key Assumptions and Methodology
- 28.3. Revenue Shift Analysis
- 28.4. Market Movement Analysis
- 28.5. Penetration-Growth (P-G) Matrix
- 28.6. Metamaterials Market in Latin America: Historical Trends (Since 2019) and Forecasted Estimates (Till 2035)
- 28.6.1. Metamaterials Market in Argentina: Historical Trends (Since 2019) and Forecasted Estimates (Till 2035)
- 28.6.2. Metamaterials Market in Brazil: Historical Trends (Since 2019) and Forecasted Estimates (Till 2035)
- 28.6.3. Metamaterials Market in Chile: Historical Trends (Since 2019) and Forecasted Estimates (Till 2035)
- 28.6.4. Metamaterials Market in Colombia Historical Trends (Since 2019) and Forecasted Estimates (Till 2035)
- 28.6.5. Metamaterials Market in Venezuela: Historical Trends (Since 2019) and Forecasted Estimates (Till 2035)
- 28.6.6. Metamaterials Market in Other Latin American Countries: Historical Trends (Since 2019) and Forecasted Estimates (Till 2035)
- 28.7. Data Triangulation and Validation
29. MARKET OPPORTUNITIES FOR METAMATERIALS IN REST OF THE WORLD
- 29.1. Chapter Overview
- 29.2. Key Assumptions and Methodology
- 29.3. Revenue Shift Analysis
- 29.4. Market Movement Analysis
- 29.5. Penetration-Growth (P-G) Matrix
- 29.6. Metamaterials Market in Rest of the World: Historical Trends (Since 2019) and Forecasted Estimates (Till 2035)
- 29.6.1. Metamaterials Market in Australia: Historical Trends (Since 2019) and Forecasted Estimates (Till 2035)
- 29.6.2. Metamaterials Market in New Zealand: Historical Trends (Since 2019) and Forecasted Estimates (Till 2035)
- 29.6.3. Metamaterials Market in Other Countries
- 29.7. Data Triangulation and Validation
30. MARKET CONCENTRATION ANALYSIS: DISTRIBUTION BY LEADING PLAYERS
- 30.1. Leading Player 1
- 30.2. Leading Player 2
- 30.3. Leading Player 3
- 30.4. Leading Player 4
- 30.5. Leading Player 5
- 30.6. Leading Player 6
- 30.7. Leading Player 7
- 30.8. Leading Player 8
31. ADJACENT MARKET ANALYSIS
SECTION VII: STRATEGIC TOOLS
32. KEY WINNING STRATEGIES
33. PORTER'S FIVE FORCES ANALYSIS
34. SWOT ANALYSIS
35. VALUE CHAIN ANALYSIS
36. ROOTS STRATEGIC RECOMMENDATIONS
- 36.1. Chapter Overview
- 36.2. Key Business-related Strategies
- 36.2.1. Research & Development
- 36.2.2. Product Manufacturing
- 36.2.3. Commercialization / Go-to-Market
- 36.2.4. Sales and Marketing
- 36.3. Key Operations-related Strategies
- 36.3.1. Risk Management
- 36.3.2. Workforce
- 36.3.3. Finance
- 36.3.4. Others
SECTION VIII: OTHER EXCLUSIVE INSIGHTS
37. INSIGHTS FROM PRIMARY RESEARCH
38. REPORT CONCLUSION
SECTION IX: APPENDIX
39. TABULATED DATA
40. LIST OF COMPANIES AND ORGANIZATIONS
41. CUSTOMIZATION OPPORTUNITIES
42. ROOTS SUBSCRIPTION SERVICES
43. AUTHOR DETAILS

