
PUBLISHER: Roots Analysis | PRODUCT CODE: 1856063

PUBLISHER: Roots Analysis | PRODUCT CODE: 1856063
Flexible Display Market, Till 2035: Distribution by Type of Display Method, Type of Material, Product, Application, Panel Size, Display Resolution, Technology, and Geographical Regions: Industry Trends and Market Forecasts
Flexible Display Market Overview
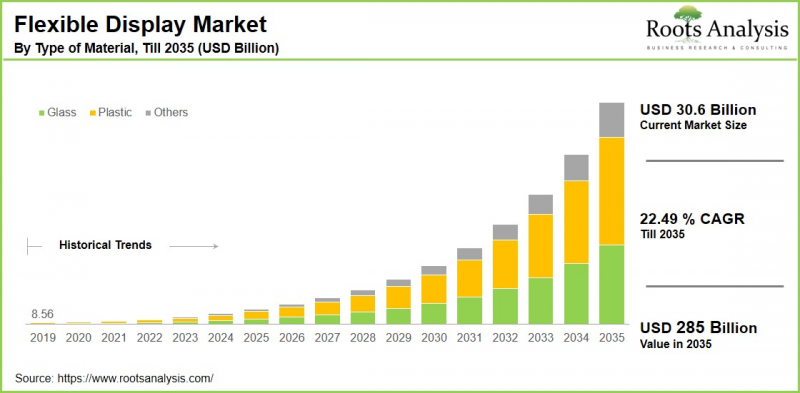
As per Roots Analysis, the global flexible display market size is estimated to grow from USD 30.6 billion in the current year USD 285 billion by 2035, at a CAGR of 22.49% during the forecast period, till 2035.
The opportunity for flexible display market has been distributed across the following segments:
Type of Display
- EPD
- LCD
- LED
- OLED
- Others
Type of Material
- Glass
- Plastic
- Others
Type of Product
- Bendable and Foldable
- Curved and Rollable
Type of Application
- Automotive
- E-reader
- PCs & Laptops
- Smart Home Appliances
- Smart Wearables
- Smartphones and Tablets
- Television
- Others
Type of Panel Size
- Up to 6"
- Above 50"
- 20-50"
- 6-20"
Type of Display Resolution
- Standard Definition (SD)
- High Definition (HD)
- Ultra-High Definition (UHD)
Type of Technology
- Active Matrix
- Passive Matrix
- Quantum Dot Technology
Geographical Regions
- North America
- US
- Canada
- Mexico
- Other North American countries
- Europe
- Austria
- Belgium
- Denmark
- France
- Germany
- Ireland
- Italy
- Netherlands
- Norway
- Russia
- Spain
- Sweden
- Switzerland
- UK
- Other European countries
- Asia
- China
- India
- Japan
- Singapore
- South Korea
- Other Asian countries
- Latin America
- Brazil
- Chile
- Colombia
- Venezuela
- Other Latin American countries
- Middle East and North Africa
- Egypt
- Iran
- Iraq
- Israel
- Kuwait
- Saudi Arabia
- UAE
- Other MENA countries
- Rest of the World
- Australia
- New Zealand
- Other countries
Flexible Display Market: Growth and Trends
Flexible displays represent a groundbreaking development in electronics, distinguished by their capability to bend and adapt in design. This innovation is fueled by the demand for more versatile and portable electronic devices that can seamlessly integrate into daily life, including wearable technologies and smartphones. Importantly, these displays utilize a specific polymer compound to enhance the longevity of the device.
Flexible displays operate by absorbing the pressure applied to the screen when fingers press and glide over the surface. Additionally, they enhance functionality across various sectors, including consumer electronics, security, agricultural and environmental sensors, healthcare, and environmental monitoring. Key characteristics of flexible displays include their bendability, ultra-thin profile, shatter resistance, unbreakable nature, portability, and low energy consumption.
Moreover, there are numerous ongoing technological developments within the flexible display sector, focusing on integrating advanced technologies for adaptable designs and an improved user experience. Recent progress in materials, manufacturing methods, and device design has led to the creation of displays that can be bent, folded, or rolled without sacrificing image quality. The increasing implementation of organic light-emitting diode (OLED) technology has made these displays appropriate for a wide array of applications, including wearable devices, tablets, and televisions.
Furthermore, new trends are emerging, such as foldable smartphones and rollable televisions, along with the rising popularity of flexible displays in cutting-edge technologies like augmented reality (AR) and virtual reality (VR). Given all the above mentioned factors, we believe that the flexible display market will grow at a steady pace during the forecast period.
Flexible Display Market: Key Segments
Market Share by Type of Display
Based on type of display, the global flexible display market is segmented into EPD, LCD, LED, OLED and others. According to our estimates, currently, the organic light emitting diode (OLED) segment captures the majority of the market share. This can be attributed to its superior image quality, broader viewing angles, and quicker response times. Its slim, lightweight, and flexible structure enables innovative designs such as foldable smartphones.
Conversely, the EPD (electrophoretic display) segment is expected to grow at a higher CAGR during the forecast period. This growth is attributed to its increasing use in e-readers and electronic shelf labels, owing to its low energy consumption and outstanding readability.
Market Share by Type of Material
Based on type of material, the global flexible display market is segmented into glass, plastic and others. According to our estimates, currently, the plastic synthesis segment captures the majority of the market share. Furthermore, this segment is anticipated to experience a higher growth rate during the forecast period. This trend can be attributed to its lightweight, flexible, and shatter-resistant characteristics, which make it particularly suitable for different uses in consumer electronics, especially in smartphones and wearables.
Market Share by Type of Product
Based on type of product, the global flexible display market is segmented into bendable and foldable and curved and rollable. According to our estimates, currently, the curved and rollable segment captures the majority of the market share. This is due to its capacity to improve viewing angles and brightness, making it a favored choice for smartphones and smartwatches.
However, the bendable and foldable segment is expected to grow at a higher CAGR during the forecast period. Key factors driving this growth include increasing demand for innovative, adaptable devices that merge portability and larger screen sizes.
Market Share by Type of Application
Based on type of application, the global flexible display market is segmented into automotive, E-reader, PC's & laptops, smart home appliances, smart wearables, smartphones and tablets, television and others. According to our estimates, currently, the smartphones and tablets segment captures the majority of the market share.
This growth is due to the increasing demand for portable, high-performance, and visually appealing electronic devices. Conversely, automotive segment is projected to experience the fastest CAGR during the forecast period. This can be attributed to several factors, including the expansion of the automotive industry and growing investments in charging infrastructure.
Market Share by Type of Panel Size
Based on type of panel size, the global flexible display market is segmented into up to 6", above 50", 20-50" and 6-20". According to our estimates, currently, the up to 6" segment captures the majority of the market share, primarily due to its compact nature, portability, affordability, and widespread use in smartphones.
Conversely, the 6-20" segment is projected to experience the fastest CAGR during the forecast period. This growth can be attributed to the rising smart devices like tablets, the benefits of OLED flexible display technology, advancements in consumer electronics, and improvements in manufacturing processes leading to lower costs.
Market Share by Type of Display Resolution
Based on type of display resolution, the global flexible display market is segmented into standard definition (SD), high definition (HD) and ultra-high definition (UHD). According to our estimates, currently, the standard definition (SD) segment captures the majority of the market share, largely due to a well-established ecosystem of devices and widespread adoption across different applications. Conversely, ultra-high definition (UHD) segment is projected to experience the fastest CAGR during the forecast period, driven by the rising demand for high-resolution content and enhanced viewing experiences.
Market Share by Type of Technology
Based on type of technology, the global flexible display market is segmented into active matrix, passive matrix and quantum dot technology. According to our estimates, currently, the active-matrix segment captures the majority of the market share, owing to its advantages such as high-resolution output, faster refresh rates, and enhanced power efficiency across electronic devices.
Conversely, quantum dot technology segment is projected to experience the fastest CAGR during the forecast period, driven by its superior display quality, continuous manufacturing advancements, and increasing emphasis on energy efficiency.
Market Share by Geographical Regions
Based on geographical regions, the flexible display market is segmented into North America, Europe, Asia, Latin America, Middle East and North Africa, and the rest of the world. According to our estimates, currently, Asia captures the majority share of the market. This trend can be attributed to the rapid technological progress, the presence of leading manufacturers such as Samsung and LG, and increasing adoption in key developing countries like China and India.
Furthermore, the market in North America is projected to experience a faster compound annual growth rate (CAGR) over the next decade, driven by strong consumer electronics adoption, a robust technological ecosystem, and substantial investments in research and development.
Example Players in Flexible Display Market
- AU Optronics
- BOE Technology
- Chunghwa Picture Tubes
- Corning Incorporated
- E-ink Holdings
- FlexEnable
- Guangzhou Oed Technologies
- Huawei Technologies
- Innolux
- Japan Display
- LG Display
- Microtips
- Plastic Logic
- ROYOLE
- Samsung Electronics
- Sharp
- TCL Electronics
Flexible Display Market: Research Coverage
The report on the flexible display market features insights on various sections, including:
- Market Sizing and Opportunity Analysis: An in-depth analysis of the flexible display market, focusing on key market segments, including [A] type of display method, [B] type of material, [C] type of product, [D] type of application, [E] type of panel size, [F] type of display resolution, [G] type of technology, and [H] geographical regions.
- Competitive Landscape: A comprehensive analysis of the companies engaged in the flexible display market, based on several relevant parameters, such as [A] year of establishment, [B] company size, [C] location of headquarters and [D] ownership structure.
- Company Profiles: Elaborate profiles of prominent players engaged in the flexible display market, providing details on [A] location of headquarters, [B] company size, [C] company mission, [D] company footprint, [E] management team, [F] contact details, [G] financial information, [H] operating business segments, [I] flexible display portfolio, [J] moat analysis, [K] recent developments, and an informed future outlook.
- Megatrends: An evaluation of ongoing megatrends in the flexible display industry.
- Patent Analysis: An insightful analysis of patents filed / granted in the flexible display domain, based on relevant parameters, including [A] type of patent, [B] patent publication year, [C] patent age and [D] leading players.
- Recent Developments: An overview of the recent developments made in the flexible display market, along with analysis based on relevant parameters, including [A] year of initiative, [B] type of initiative, [C] geographical distribution and [D] most active players.
- Porter's Five Forces Analysis: An analysis of five competitive forces prevailing in the flexible display market, including threats of new entrants, bargaining power of buyers, bargaining power of suppliers, threats of substitute products and rivalry among existing competitors.
- SWOT Analysis: An insightful SWOT framework, highlighting the strengths, weaknesses, opportunities and threats in the domain. Additionally, it provides Harvey ball analysis, highlighting the relative impact of each SWOT parameter.
Key Questions Answered in this Report
- How many companies are currently engaged in flexible display market?
- Which are the leading companies in this market?
- What factors are likely to influence the evolution of this market?
- What is the current and future market size?
- What is the CAGR of this market?
- How is the current and future market opportunity likely to be distributed across key market segments?
Reasons to Buy this Report
- The report provides a comprehensive market analysis, offering detailed revenue projections of the overall market and its specific sub-segments. This information is valuable to both established market leaders and emerging entrants.
- Stakeholders can leverage the report to gain a deeper understanding of the competitive dynamics within the market. By analyzing the competitive landscape, businesses can make informed decisions to optimize their market positioning and develop effective go-to-market strategies.
- The report offers stakeholders a comprehensive overview of the market, including key drivers, barriers, opportunities, and challenges. This information empowers stakeholders to stay abreast of market trends and make data-driven decisions to capitalize on growth prospects.
Additional Benefits
- Complimentary Excel Data Packs for all Analytical Modules in the Report
- 15% Free Content Customization
- Detailed Report Walkthrough Session with Research Team
- Free Updated report if the report is 6-12 months old or older
TABLE OF CONTENTS
1. PREFACE
- 1.1. Introduction
- 1.2. Market Share Insights
- 1.3. Key Market Insights
- 1.4. Report Coverage
- 1.5. Key Questions Answered
- 1.6. Chapter Outlines
2. RESEARCH METHODOLOGY
- 2.1. Chapter Overview
- 2.2. Research Assumptions
- 2.3. Database Building
- 2.3.1. Data Collection
- 2.3.2. Data Validation
- 2.3.3. Data Analysis
- 2.4. Project Methodology
- 2.4.1. Secondary Research
- 2.4.1.1. Annual Reports
- 2.4.1.2. Academic Research Papers
- 2.4.1.3. Company Websites
- 2.4.1.4. Investor Presentations
- 2.4.1.5. Regulatory Filings
- 2.4.1.6. White Papers
- 2.4.1.7. Industry Publications
- 2.4.1.8. Conferences and Seminars
- 2.4.1.9. Government Portals
- 2.4.1.10. Media and Press Releases
- 2.4.1.11. Newsletters
- 2.4.1.12. Industry Databases
- 2.4.1.13. Roots Proprietary Databases
- 2.4.1.14. Paid Databases and Sources
- 2.4.1.15. Social Media Portals
- 2.4.1.16. Other Secondary Sources
- 2.4.2. Primary Research
- 2.4.2.1. Introduction
- 2.4.2.2. Types
- 2.4.2.2.1. Qualitative
- 2.4.2.2.2. Quantitative
- 2.4.2.3. Advantages
- 2.4.2.4. Techniques
- 2.4.2.4.1. Interviews
- 2.4.2.4.2. Surveys
- 2.4.2.4.3. Focus Groups
- 2.4.2.4.4. Observational Research
- 2.4.2.4.5. Social Media Interactions
- 2.4.2.5. Stakeholders
- 2.4.2.5.1. Company Executives (CXOs)
- 2.4.2.5.2. Board of Directors
- 2.4.2.5.3. Company Presidents and Vice Presidents
- 2.4.2.5.4. Key Opinion Leaders
- 2.4.2.5.5. Research and Development Heads
- 2.4.2.5.6. Technical Experts
- 2.4.2.5.7. Subject Matter Experts
- 2.4.2.5.8. Scientists
- 2.4.2.5.9. Doctors and Other Healthcare Providers
- 2.4.2.6. Ethics and Integrity
- 2.4.2.6.1. Research Ethics
- 2.4.2.6.2. Data Integrity
- 2.4.3. Analytical Tools and Databases
- 2.4.1. Secondary Research
3. ECONOMIC AND OTHER PROJECT SPECIFIC CONSIDERATIONS
- 3.1. Forecast Methodology
- 3.1.1. Top-Down Approach
- 3.1.2. Bottom-Up Approach
- 3.1.3. Hybrid Approach
- 3.2. Market Assessment Framework
- 3.2.1. Total Addressable Market (TAM)
- 3.2.2. Serviceable Addressable Market (SAM)
- 3.2.3. Serviceable Obtainable Market (SOM)
- 3.2.4. Currently Acquired Market (CAM)
- 3.3. Forecasting Tools and Techniques
- 3.3.1. Qualitative Forecasting
- 3.3.2. Correlation
- 3.3.3. Regression
- 3.3.4. Time Series Analysis
- 3.3.5. Extrapolation
- 3.3.6. Convergence
- 3.3.7. Forecast Error Analysis
- 3.3.8. Data Visualization
- 3.3.9. Scenario Planning
- 3.3.10. Sensitivity Analysis
- 3.4. Key Considerations
- 3.4.1. Demographics
- 3.4.2. Market Access
- 3.4.3. Reimbursement Scenarios
- 3.4.4. Industry Consolidation
- 3.5. Robust Quality Control
- 3.6. Key Market Segmentations
- 3.7. Limitations
4. MACRO-ECONOMIC INDICATORS
- 4.1. Chapter Overview
- 4.2. Market Dynamics
- 4.2.1. Time Period
- 4.2.1.1. Historical Trends
- 4.2.1.2. Current and Forecasted Estimates
- 4.2.2. Currency Coverage
- 4.2.2.1. Overview of Major Currencies Affecting the Market
- 4.2.2.2. Impact of Currency Fluctuations on the Industry
- 4.2.3. Foreign Exchange Impact
- 4.2.3.1. Evaluation of Foreign Exchange Rates and Their Impact on Market
- 4.2.3.2. Strategies for Mitigating Foreign Exchange Risk
- 4.2.4. Recession
- 4.2.4.1. Historical Analysis of Past Recessions and Lessons Learnt
- 4.2.4.2. Assessment of Current Economic Conditions and Potential Impact on the Market
- 4.2.5. Inflation
- 4.2.5.1. Measurement and Analysis of Inflationary Pressures in the Economy
- 4.2.5.2. Potential Impact of Inflation on the Market Evolution
- 4.2.6. Interest Rates
- 4.2.6.1. Overview of Interest Rates and Their Impact on the Market
- 4.2.6.2. Strategies for Managing Interest Rate Risk
- 4.2.7. Commodity Flow Analysis
- 4.2.7.1. Type of Commodity
- 4.2.7.2. Origins and Destinations
- 4.2.7.3. Values and Weights
- 4.2.7.4. Modes of Transportation
- 4.2.8. Global Trade Dynamics
- 4.2.8.1. Import Scenario
- 4.2.8.2. Export Scenario
- 4.2.9. War Impact Analysis
- 4.2.9.1. Russian-Ukraine War
- 4.2.9.2. Israel-Hamas War
- 4.2.10. COVID Impact / Related Factors
- 4.2.10.1. Global Economic Impact
- 4.2.10.2. Industry-specific Impact
- 4.2.10.3. Government Response and Stimulus Measures
- 4.2.10.4. Future Outlook and Adaptation Strategies
- 4.2.11. Other Indicators
- 4.2.11.1. Fiscal Policy
- 4.2.11.2. Consumer Spending
- 4.2.11.3. Gross Domestic Product (GDP)
- 4.2.11.4. Employment
- 4.2.11.5. Taxes
- 4.2.11.6. R&D Innovation
- 4.2.11.7. Stock Market Performance
- 4.2.11.8. Supply Chain
- 4.2.11.9. Cross-Border Dynamics
- 4.2.1. Time Period
5. EXECUTIVE SUMMARY
6. INTRODUCTION
- 6.1. Chapter Overview
- 6.2. Overview of Flexible Display Market
- 6.2.1. Type of Display
- 6.2.2. Type of Material
- 6.2.3. Type of Product
- 6.2.4. Type of Application
- 6.2.5. Type of Panel Size
- 6.2.6. Type of Display Resolution
- 6.2.7. Type of Technology
- 6.3. Future Perspective
7. COMPETITIVE LANDSCAPE
- 7.1. Chapter Overview
- 7.2. Flexible Display: Overall Market Landscape
- 7.2.1. Analysis by Year of Establishment
- 7.2.2. Analysis by Company Size
- 7.2.3. Analysis by Location of Headquarters
- 7.2.4. Analysis by Ownership Structure
8. STARTUP ECOSYSTEM IN THE FLEXIBLE DISPLAY MARKET
- 8.1. Flexible Display Market: Market Landscape of Startups
- 8.1.1. Analysis by Year of Establishment
- 8.1.2. Analysis by Company Size
- 8.1.3. Analysis by Company Size and Year of Establishment
- 8.1.4. Analysis by Location of Headquarters
- 8.1.5. Analysis by Company Size and Location of Headquarters
- 8.1.6. Analysis by Ownership Structure
- 8.2. Key Findings
9. COMPANY PROFILES
- 9.1. Chapter Overview
- 9.2. AU Optronics*
- 9.2.1. Company Overview
- 9.2.2. Company Mission
- 9.2.3. Company Footprint
- 9.2.4. Management Team
- 9.2.5. Contact Details
- 9.2.6. Financial Performance
- 9.2.7. Operating Business Segments
- 9.2.8. Service / Product Portfolio (project specific)
- 9.2.9. MOAT Analysis
- 9.2.10. Recent Developments and Future Outlook
- 9.3. BOE Technology
- 9.4. Chunghwa Picture Tubes
- 9.5. Corning Incorporated
- 9.6. E-ink Holdings
- 9.7. FlexEnable
- 9.8. Guangzhou Oed Technologies
- 9.9. Huawei Technologies
- 9.10. Innolux
- 9.11. Japan Display
- 9.12. LG Display
- 9.13. Microtips
- 9.14. Plastic Logic
- 9.15. ROYOLE
- 9.16. Samsung Electronics
- 9.17. Sharp
- 9.18. TCL Electronics
10. VALUE CHAIN ANALYSIS
11. SWOT ANALYSIS
12. GLOBAL FLEXIBLE DISPLAY MARKET
- 12.1. Chapter Overview
- 12.2. Key Assumptions and Methodology
- 12.3. Trends Disruption Impacting Market
- 12.4. Global Flexible Display Market, Historical Trends (Since 2019) and Forecasted Estimates (Till 2035)
- 12.5. Multivariate Scenario Analysis
- 12.5.1. Conservative Scenario
- 12.5.2. Optimistic Scenario
- 12.6. Key Market Segmentations
13. MARKET OPPORTUNITIES BASED ON TYPE OF DISPLAY
- 13.1. Chapter Overview
- 13.2. Key Assumptions and Methodology
- 13.3. Revenue Shift Analysis
- 13.4. Market Movement Analysis
- 13.5. Penetration-Growth (P-G) Matrix
- 13.6. Flexible Display Market for EPD: Historical Trends (Since 2019) and Forecasted Estimates (Till 2035)
- 13.7. Flexible Display Market for LCD: Historical Trends (Since 2019) and Forecasted Estimates (Till 2035)
- 13.8. Flexible Display Market for LED: Historical Trends (Since 2019) and Forecasted Estimates (Till 2035)
- 13.9. Flexible Display Market for OLED: Historical Trends (Since 2019) and Forecasted Estimates (Till 2035)
- 13.10. Flexible Display Market for Others: Historical Trends (Since 2019) and Forecasted Estimates (Till 2035)
- 13.11. Data Triangulation and Validation
14. MARKET OPPORTUNITIES BASED ON TYPE OF MATERIAL
- 14.1. Chapter Overview
- 14.2. Key Assumptions and Methodology
- 14.3. Revenue Shift Analysis
- 14.4. Market Movement Analysis
- 14.5. Penetration-Growth (P-G) Matrix
- 14.6. Flexible Display Market for Glass: Historical Trends (Since 2019) and Forecasted Estimates (Till 2035)
- 14.7. Flexible Display Market for Plastic: Historical Trends (Since 2019) and Forecasted Estimates (Till 2035)
- 14.8. Flexible Display Market for Others: Historical Trends (Since 2019) and Forecasted Estimates (Till 2035)
- 14.9. Data Triangulation and Validation
15. MARKET OPPORTUNITIES BASED ON TYPE OF PRODUCT
- 15.1. Chapter Overview
- 15.2. Key Assumptions and Methodology
- 15.3. Revenue Shift Analysis
- 15.4. Market Movement Analysis
- 15.5. Penetration-Growth (P-G) Matrix
- 15.6. Flexible Display Market for Bendable and Foldable: Historical Trends (Since 2019) and Forecasted Estimates (Till 2035)
- 15.7. Flexible Display Market for Curved and Rollable: Historical Trends (Since 2019) and Forecasted Estimates (Till 2035)
- 15.8. Data Triangulation and Validation
16. MARKET OPPORTUNITIES BASED ON TYPE OF APPLICATION
- 16.1. Chapter Overview
- 16.2. Key Assumptions and Methodology
- 16.3. Revenue Shift Analysis
- 16.4. Market Movement Analysis
- 16.5. Penetration-Growth (P-G) Matrix
- 16.6. Flexible Display Market for Automotive: Historical Trends (Since 2019) and Forecasted Estimates (Till 2035)
- 16.7. Flexible Display Market for E-reader: Historical Trends (Since 2019) and Forecasted Estimates (Till 2035)
- 16.8. Flexible Display Market for PC's & Laptops: Historical Trends (Since 2019) and Forecasted Estimates (Till 2035)
- 16.9. Flexible Display Market for Smart Home Appliances: Historical Trends (Since 2019) and Forecasted Estimates (Till 2035)
- 16.10. Flexible Display Market for Smart Wearables: Historical Trends (Since 2019) and Forecasted Estimates (Till 2035)
- 16.11. Flexible Display Market for Smartphones and Tablets: Historical Trends (Since 2019) and Forecasted Estimates (Till 2035)
- 16.12. Flexible Display Market for Television: Historical Trends (Since 2019) and Forecasted Estimates (Till 2035)
- 16.13. Flexible Display Market for Others: Historical Trends (Since 2019) and Forecasted Estimates (Till 2035)
- 16.14. Data Triangulation and Validation
17. MARKET OPPORTUNITIES BASED ON TYPE OF PANEL SIZE
- 17.1. Chapter Overview
- 17.2. Key Assumptions and Methodology
- 17.3. Revenue Shift Analysis
- 17.4. Market Movement Analysis
- 17.5. Penetration-Growth (P-G) Matrix
- 17.6. Flexible Display Market for Up to 6": Historical Trends (Since 2019) and Forecasted Estimates (Till 2035)
- 17.7. Flexible Display Market for Above 50": Historical Trends (Since 2019) and Forecasted Estimates (Till 2035)
- 17.8. Flexible Display Market for 20-50": Historical Trends (Since 2019) and Forecasted Estimates (Till 2035)
- 17.9. Flexible Display Market for 6-20": Historical Trends (Since 2019) and Forecasted Estimates (Till 2035)
- 17.10. Data Triangulation and Validation
18. MARKET OPPORTUNITIES BASED ON DISPLAY RESOLUTION
- 18.1. Chapter Overview
- 18.2. Key Assumptions and Methodology
- 18.3. Revenue Shift Analysis
- 18.4. Market Movement Analysis
- 18.5. Penetration-Growth (P-G) Matrix
- 18.6. Flexible Display Market for Standard Definition (SD): Historical Trends (Since 2019) and Forecasted Estimates (Till 2035)
- 18.7. Flexible Display Market for High definition (HD): Historical Trends (Since 2019) and Forecasted Estimates (Till 2035)
- 18.8. Flexible Display Market for Ultra-High definition (UHD): Historical Trends (Since 2019) and Forecasted Estimates (Till 2035)
- 18.9. Data Triangulation and Validation
19. MARKET OPPORTUNITIES BASED ON TYPE OF TECHNOLOGY
- 19.1. Chapter Overview
- 19.2. Key Assumptions and Methodology
- 19.3. Revenue Shift Analysis
- 19.4. Market Movement Analysis
- 19.5. Penetration-Growth (P-G) Matrix
- 19.6. Flexible Display Market for Active Matrix: Historical Trends (Since 2019) and Forecasted Estimates (Till 2035)
- 19.7. Flexible Display Market for Passive Matrix: Historical Trends (Since 2019) and Forecasted Estimates (Till 2035)
- 19.8. Flexible Display Market for Quantum Dot Technology: Historical Trends (Since 2019) and Forecasted Estimates (Till 2035)
- 19.9. Data Triangulation and Validation
20. MARKET OPPORTUNITIES FLEXIBLE DISPLAY IN NORTH AMERICA
- 20.1. Chapter Overview
- 20.2. Key Assumptions and Methodology
- 20.3. Revenue Shift Analysis
- 20.4. Market Movement Analysis
- 20.5. Penetration-Growth (P-G) Matrix
- 20.6. Flexible Display Market in North America: Historical Trends (Since 2019) and Forecasted Estimates (Till 2035)
- 20.6.1. Flexible Display Market in the US: Historical Trends (Since 2019) and Forecasted Estimates (Till 2035)
- 20.6.2. Flexible Display Market in Canada: Historical Trends (Since 2019) and Forecasted Estimates (Till 2035)
- 20.6.3. Flexible Display Market in Mexico: Historical Trends (Since 2019) and Forecasted Estimates (Till 2035)
- 20.6.4. Flexible Display Market in Other North American Countries: Historical Trends (Since 2019) and Forecasted Estimates (Till 2035)
- 20.7. Data Triangulation and Validation
21. MARKET OPPORTUNITIES FOR FLEXIBLE DISPLAY IN EUROPE
- 21.1. Chapter Overview
- 21.2. Key Assumptions and Methodology
- 21.3. Revenue Shift Analysis
- 21.4. Market Movement Analysis
- 21.5. Penetration-Growth (P-G) Matrix
- 21.6. Flexible Display Market in Europe: Historical Trends (Since 2019) and Forecasted Estimates (Till 2035)
- 21.6.1. Flexible Display Market in Austria: Historical Trends (Since 2019) and Forecasted Estimates (Till 2035)
- 21.6.2. Flexible Display Market in Belgium: Historical Trends (Since 2019) and Forecasted Estimates (Till 2035)
- 21.6.3. Flexible Display Market in Denmark: Historical Trends (Since 2019) and Forecasted Estimates (Till 2035)
- 21.6.4. Flexible Display Market in France: Historical Trends (Since 2019) and Forecasted Estimates (Till 2035)
- 21.6.5. Flexible Display Market in Germany: Historical Trends (Since 2019) and Forecasted Estimates (Till 2035)
- 21.6.6. Flexible Display Market in Ireland: Historical Trends (Since 2019) and Forecasted Estimates (Till 2035)
- 21.6.7. Flexible Display Market in Italy: Historical Trends (Since 2019) and Forecasted Estimates (Till 2035)
- 21.6.8. Flexible Display Market in Netherlands: Historical Trends (Since 2019) and Forecasted Estimates (Till 2035)
- 21.6.9. Flexible Display Market in Norway: Historical Trends (Since 2019) and Forecasted Estimates (Till 2035)
- 21.6.10. Flexible Display Market in Russia: Historical Trends (Since 2019) and Forecasted Estimates (Till 2035)
- 21.6.11. Flexible Display Market in Spain: Historical Trends (Since 2019) and Forecasted Estimates (Till 2035)
- 21.6.12. Flexible Display Market in Sweden: Historical Trends (Since 2019) and Forecasted Estimates (Till 2035)
- 21.6.13. Flexible Display Market in Switzerland: Historical Trends (Since 2019) and Forecasted Estimates (Till 2035)
- 21.6.14. Flexible Display Market in the UK: Historical Trends (Since 2019) and Forecasted Estimates (Till 2035)
- 21.6.15. Flexible Display Market in Other European Countries: Historical Trends (Since 2019) and Forecasted Estimates (Till 2035)
- 21.7. Data Triangulation and Validation
22. MARKET OPPORTUNITIES FOR FLEXIBLE DISPLAY IN ASIA
- 22.1. Chapter Overview
- 22.2. Key Assumptions and Methodology
- 22.3. Revenue Shift Analysis
- 22.4. Market Movement Analysis
- 22.5. Penetration-Growth (P-G) Matrix
- 22.6. Flexible Display Market in Asia: Historical Trends (Since 2019) and Forecasted Estimates (Till 2035)
- 22.6.1. Flexible Display Market in China: Historical Trends (Since 2019) and Forecasted Estimates (Till 2035)
- 22.6.2. Flexible Display Market in India: Historical Trends (Since 2019) and Forecasted Estimates (Till 2035)
- 22.6.3. Flexible Display Market in Japan: Historical Trends (Since 2019) and Forecasted Estimates (Till 2035)
- 22.6.4. Flexible Display Market in Singapore: Historical Trends (Since 2019) and Forecasted Estimates (Till 2035)
- 22.6.5. Flexible Display Market in South Korea: Historical Trends (Since 2019) and Forecasted Estimates (Till 2035)
- 22.6.6. Flexible Display Market in Other Asian Countries: Historical Trends (Since 2019) and Forecasted Estimates (Till 2035)
- 22.7. Data Triangulation and Validation
23. MARKET OPPORTUNITIES FOR FLEXIBLE DISPLAY IN MIDDLE EAST AND NORTH AFRICA (MENA)
- 23.1. Chapter Overview
- 23.2. Key Assumptions and Methodology
- 23.3. Revenue Shift Analysis
- 23.4. Market Movement Analysis
- 23.5. Penetration-Growth (P-G) Matrix
- 23.6. Flexible Display Market in Middle East and North Africa (MENA): Historical Trends (Since 2019) and Forecasted Estimates (Till 2035)
- 23.6.1. Flexible Display Market in Egypt: Historical Trends (Since 2019) and Forecasted Estimates (Till 205)
- 23.6.2. Flexible Display Market in Iran: Historical Trends (Since 2019) and Forecasted Estimates (Till 2035)
- 23.6.3. Flexible Display Market in Iraq: Historical Trends (Since 2019) and Forecasted Estimates (Till 2035)
- 23.6.4. Flexible Display Market in Israel: Historical Trends (Since 2019) and Forecasted Estimates (Till 2035)
- 23.6.5. Flexible Display Market in Kuwait: Historical Trends (Since 2019) and Forecasted Estimates (Till 2035)
- 23.6.6. Flexible Display Market in Saudi Arabia: Historical Trends (Since 2019) and Forecasted Estimates (Till 2035)
- 23.6.7. Flexible Display Market in United Arab Emirates (UAE): Historical Trends (Since 2019) and Forecasted Estimates (Till 2035)
- 23.6.8. Flexible Display Market in Other MENA Countries: Historical Trends (Since 2019) and Forecasted Estimates (Till 2035)
- 23.7. Data Triangulation and Validation
24. MARKET OPPORTUNITIES FOR FLEXIBLE DISPLAY IN LATIN AMERICA
- 24.1. Chapter Overview
- 24.2. Key Assumptions and Methodology
- 24.3. Revenue Shift Analysis
- 24.4. Market Movement Analysis
- 24.5. Penetration-Growth (P-G) Matrix
- 24.6. Flexible Display Market in Latin America: Historical Trends (Since 2019) and Forecasted Estimates (Till 2035)
- 24.6.1. Flexible Display Market in Argentina: Historical Trends (Since 2019) and Forecasted Estimates (Till 2035)
- 24.6.2. Flexible Display Market in Brazil: Historical Trends (Since 2019) and Forecasted Estimates (Till 2035)
- 24.6.3. Flexible Display Market in Chile: Historical Trends (Since 2019) and Forecasted Estimates (Till 2035)
- 24.6.4. Flexible Display Market in Colombia Historical Trends (Since 2019) and Forecasted Estimates (Till 2035)
- 24.6.5. Flexible Display Market in Venezuela: Historical Trends (Since 2019) and Forecasted Estimates (Till 2035)
- 24.6.6. Flexible Display Market in Other Latin American Countries: Historical Trends (Since 2019) and Forecasted Estimates (Till 2035)
- 24.7. Data Triangulation and Validation
25. MARKET OPPORTUNITIES FOR FLEXIBLE DISPLAY IN REST OF THE WORLD
- 25.1. Chapter Overview
- 25.2. Key Assumptions and Methodology
- 25.3. Revenue Shift Analysis
- 25.4. Market Movement Analysis
- 25.5. Penetration-Growth (P-G) Matrix
- 25.6. Flexible Display Market in Rest of the World: Historical Trends (Since 2019) and Forecasted Estimates (Till 2035)
- 25.6.1. Flexible Display Market in Australia: Historical Trends (Since 2019) and Forecasted Estimates (Till 2035)
- 25.6.2. Flexible Display Market in New Zealand: Historical Trends (Since 2019) and Forecasted Estimates (Till 2035)
- 25.6.3. Flexible Display Market in Other Countries
- 25.7. Data Triangulation and Validation
24. TABULATED DATA
25. LIST OF COMPANIES AND ORGANIZATIONS
26. CUSTOMIZATION OPPORTUNITIES
27. ROOTS SUBSCRIPTION SERVICES
28. AUTHOR DETAILS

