
PUBLISHER: Roots Analysis | PRODUCT CODE: 1869573

PUBLISHER: Roots Analysis | PRODUCT CODE: 1869573
Voluntary Carbon Credit Market: Industry Trends and Global Forecasts, till 2035 - Distribution by Project, Transaction, Application Area, End User and Geography
GLOBAL VOLUNTARY CARBON CREDIT MARKET: OVERVIEW
As per Roots Analysis, the global voluntary carbon credit market is expected to grow from USD 1.6 billion in the current year to USD 47.5 billion, at a CAGR of 40% during the forecast period.
The market sizing and opportunity analysis has been segmented across the following parameters:
Project
- Renewable Energy Projects
- Energy Efficiency Projects
- Forestry and Land Use Projects
- Methane Capture and Destruction Projects
- Other Projects
Type of Transaction
- Carbon Removal
- Carbon Reduction
- Mixed Transaction
Application Area
- Industrial Sector
- Household Sector
- Energy Sector
- Agriculture Sector
- Other Application Area
End User
- Government Agencies / Organizations
- Non-Profit Organizations
- Private Companies
- Individuals
Geography
- North America (US and Canada)
- Europe (Austria, Belgium, Estonia, France, Germany, Italy, Netherlands, Spain, Sweden, UK and Rest of Europe)
- Asia-Pacific (Australia, China, India, Japan, Malaysia, Singapore, Thailand and Rest of Asia-Pacific)
- Latin America (Argentina, Brazil and Rest of Latin America)
- Middle East and Africa (Israel, Kenya, Kuwait, Malawi, Oman, South Africa, Uganda, UAE, Zambia and Rest of MEA)
GLOBAL VOLUNTARY CARBON CREDIT MARKET: GROWTH AND TRENDS
Carbon credits signify a decrease or elimination of greenhouse gases in the atmosphere achieved through several climate initiatives. These credits are acquired either to meet compliance obligations or are purchased on a voluntary basis. The carbon reduction initiatives benefit the market by stakeholders either willingly eliminate or prevent emissions to lessen their environmental impact. This market has become an essential tool for tackling worldwide issues related to climate change. In contrast to compliance markets that are influenced by government regulations and cap-and-trade systems, the voluntary carbon credit sector functions on a non-mandatory principle, enabling companies, individuals, and organizations to voluntarily compensate for their carbon emissions. In 2021, the market reached a peak with more than USD 2 billion in revenue from trading voluntary carbon credits. This expansion is driven by continuous initiatives to decrease carbon emissions and transition towards sustainability in both public and private sectors. To offer different kinds of carbon credits, the project developers engage in a diverse range of efforts, such as afforestation, blue carbon, clean cooking, clean water, forest preservation, reforestation, land safeguarding, and renewable energy projects.
Additionally, by engaging in voluntary carbon offset initiatives, the end users in this market aid in lowering greenhouse gas emissions and provide financial backing for projects that enhance biodiversity, environmental resilience, and sustainable development. Voluntary carbon credits serve as both an environmental catalyst and an economic driver, fostering innovation and generating new business prospects. With the growing integration of environmental, social, and governance objectives into business strategies, it is expected that the need for carbon credits will rise.
As both businesses and government agencies / organizations pursue ambitious climate goals, the voluntary carbon credit market will play an essential role in enabling a global transition to a low-carbon economy. Moreover, the increasing corporate commitment to net zero emissions targets is anticipated to drive significant growth in the market, in the coming decade.
GLOBAL VOLUNTARY CARBON CREDIT MARKET: KEY INSIGHTS
The report delves into the current state of voluntary carbon credit market and identifies potential growth opportunities within industry. Some key findings from the report include:
1. Voluntary carbon credit providers are dedicated to addressing climate change issues by offering carbon credits generated through a variety of projects.
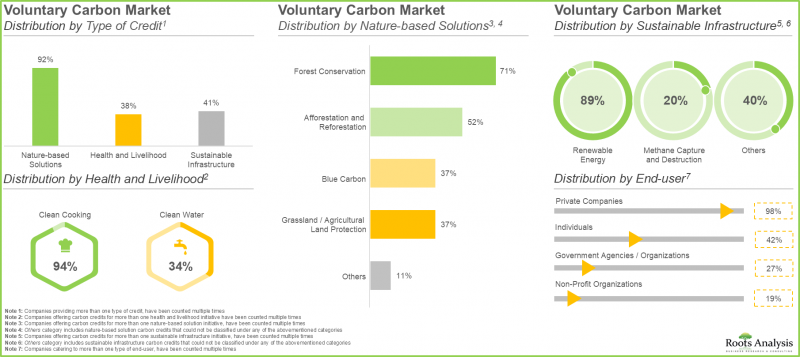
2. More than 90% of the players provide carbon credits through nature-based solution initiatives; of these, nearly 70% of the credits are generated via forest conservation projects.
3. The piqued interest towards sustainable practices and increasing concerns related to climate change drives the market for voluntary carbon credits, positioning it for significant growth in the foreseeable future.
4. Currently, the global voluntary carbon market size is estimated to be worth USD 1.6 billion and is anticipated to grow at a CAGR of 40% over the next ten years.
5. The detailed market forecast analysis reveals the historical data (since 2020) and the overall opportunity in the current year and the next 10 years (till 2035).
GLOBAL VOLUNTARY CARBON CREDIT MARKET: KEY SEGMENTS
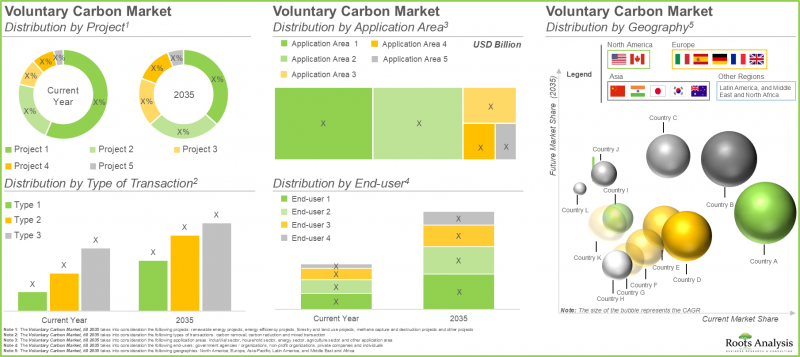
Renewable Energy Projects Occupies a Relatively Higher Voluntary Carbon Credit Market Share
The global voluntary carbon credit market is categorized into different projects, such as renewable energy projects, energy efficiency projects, forestry and land use projects, methane capture and destruction projects and other projects. Currently, the renewable energy projects occupy a relatively higher market share (more than 30%); however, this scenario is likely to change in the upcoming future and the forestry and land use projects segment and is expected to witness substantial growth during the forecast period.
This is because forest management enhances the absorption of emissions by regulating deforestation and forest degradation. Moreover, forestry and land management initiatives help reduce the effects of climate change and the decline of biodiversity.
Carbon Removal Segment Is Expected to Grow at a Higher CAGR
The global market is segmented across various types of transactions, such as carbon removal, carbon reduction and mixed transactions. Presently, the mixed transactions segment occupies the highest voluntary carbon credit market share (more than 45%), and this trend is unlikely to change over the next decade. However, the carbon removal segment is expected to grow at a relatively higher pace due to several reasons, including heightened awareness concerning greenwashing and changes in regulatory guidelines.
Industrial Sector Currently Occupies the Highest Voluntary Carbon Credit Market Share
This segment highlights the segmentation of global market across various application areas, such as industrial sector, household sector, energy sector, agriculture sector and other application areas. Among these application areas, the industrial sector segment currently occupies the highest voluntary carbon credit market share and is likely to stay dominant during the forecast period. This can be linked to the growing adoption of net zero emission initiatives by industry participants, fostering a flourishing market. Further, it is worth mentioning that the energy sector segment is expected to grow at a higher CAGR compared to other segments.
Private Companies' Segment Is Expected to Hold the Majority Market Share
In terms of end-users, the global voluntary carbon credit market is segmented across different types of end users, such as government agencies / organizations, non-profit organizations, private companies and individuals. Currently, private companies' segment is expected to hold the majority (nearly 45%) of the market share, and this trend is unlikely to change in the future as well. Further, private companies' segment is anticipated to grow at an annualized rate of ~40%, till 2035. This is a result of the growing use of voluntary carbon credit by private companies to counterbalance their carbon emissions, focusing on minimizing environmental impact and achieving their sustainability objectives.
North America is Likely to Capture the Major Market Share
In terms of geography, the global market is segmented across North America, Europe, Asia-Pacific, Latin America, and Middle East and Africa. Currently North America is likely to capture the majority (over 30%) of the market share; however, in the upcoming decade the market for Europe is likely to capture majority of the market share. It is worth highlighting that during the forecast period till 2035, the voluntary carbon credit market share in Asia-Pacific is expected to grow at a relatively faster pace (CAGR of 42%) in comparison to other regions.
Primary Research Overview
The opinions and insights presented in this study were influenced by discussions conducted with multiple stakeholders in this domain. The market report features detailed transcripts of interviews held with the following individuals:
- Founder, Small Company, UAE
- Managing Director, Small Company, Poland
- Global Senior Director of Nature Based Solutions, Very Large Company, Switzerland
- Team Lead Sales International, Mid-sized Company, Germany
- Enterprise Innovation Lead, Small Company, UK
- International Business Development and Strategic Business Partnerships, Small Company, France
- Partnerships Coordinator, Small Company, Australia
Example Players in the Global Voluntary Carbon Credit Market
- 3Degrees
- Climate Impact Partners
- ClimateSeed
- Cool Effect
- Earthly
- Ecologi Impact Funds
- EKI Energy Services
- First Climate
- Green Wedge
- Greenfleet
- natureOffice
- Solaxy Group
- South Pole
- The Carbon Collective Company
GLOBAL VOLUNTARY CARBON CREDIT MARKET: RESEARCH COVERAGE
- Market Sizing and Opportunity Analysis: The report features an in-depth analysis of the global voluntary carbon credit market, focusing on key market segments, including [A] project, [B] type of transaction [C] application area, [D] end user and [H] geography.
- Market Landscape: A comprehensive evaluation of voluntary carbon credit project developers, considering various parameters, such as [A] type of credit, [B] nature-based solution credits, [C] health and livelihood credits, [D] sustainable infrastructure credits, and [E] end user and [F] year of their establishment, [B] company size, and [C] location of headquarters.
- Company Profiles: In-depth profiles of companies that are engaged in this domain, focusing on [A] company overview, [B] financial information (if available), [C] carbon credit portfolio, and [E] recent developments and an informed future outlook.
- Case Study: A detailed case study on voluntary carbon offset initiatives by pharma companies in this domain, highlighting the impact of these practices within the pharmaceutical industry.
- Market Impact Analysis: An in-depth analysis of the factors that can impact on the growth of the market. It also features identification and market analysis of [A] key drivers, [B] potential restraints, [C] emerging opportunities, and [D] existing challenges.
KEY QUESTIONS ANSWERED IN THIS REPORT
- How many companies are currently engaged in this market?
- Which are the leading companies in this market?
- What factors are likely to influence the evolution of this market?
- What is the current and future market size?
- What is the CAGR of this market?
- How is the current and future market opportunity likely to be distributed across key market segments?
REASONS TO BUY THIS REPORT
- The report provides a comprehensive market analysis, offering detailed revenue projections of the overall market and its specific sub-segments. This information is valuable to both established market leaders and emerging entrants.
- Stakeholders can leverage the report to gain a deeper understanding of the competitive dynamics within the market. By analyzing the competitive landscape, businesses can make informed decisions to optimize their market positioning and develop effective go-to-market strategies.
- The report offers stakeholders a comprehensive overview of the market, including key drivers, barriers, opportunities, and challenges. This information empowers stakeholders to stay abreast of market trends and make data-driven decisions to capitalize on growth prospects.
ADDITIONAL BENEFITS
- Complimentary Excel Data Packs for all Analytical Modules in the Report
- 15% Free Content Customization
- Detailed Report Walkthrough Session with Research Team
- Free Updated report if the report is 6-12 months old or older
TABLE OF CONTENTS
SECTION I: REPORT OVERVIEW
1. BACKGROUND
- 1.1. Context
- 1.2. Project Objectives
2. RESEARCH METHODOLOGY
- 2.1. Chapter Overview
- 2.2. Research Assumptions
- 2.2.1. Market Landscape and Market Trends
- 2.2.2. Market Forecast and Opportunity Analysis
- 2.2.3. Comparative Analysis
- 2.3. Database Building
- 2.3.1. Data Collection
- 2.3.2. Data Validation
- 2.3.3. Data Analysis
- 2.4. Project Methodology
- 2.4.1. Secondary Research
- 2.4.1.1. Annual Reports
- 2.4.1.2. Academic Research Papers
- 2.4.1.3. Company Websites
- 2.4.1.4. Investor Presentations
- 2.4.1.5. Regulatory Filings
- 2.4.1.6. White Papers
- 2.4.1.7. Industry Publications
- 2.4.1.8. Conferences and Seminars
- 2.4.1.9. Government Portals
- 2.4.1.10. Media and Press Releases
- 2.4.1.11. Newsletters
- 2.4.1.12. Industry Databases
- 2.4.1.13. Roots Proprietary Databases
- 2.4.1.14. Paid Databases and Sources
- 2.4.1.15. Social Media Portals
- 2.4.1.16. Other Secondary Sources
- 2.4.2. Primary Research
- 2.4.2.1. Types of Primary Research
- 2.4.2.1.1. Qualitative Research
- 2.4.2.1.2. Quantitative Research
- 2.4.2.1.3. Hybrid Approach
- 2.4.2.2. Advantages of Primary Research
- 2.4.2.3. Techniques for Primary Research
- 2.4.2.3.1. Interviews
- 2.4.2.3.2. Surveys
- 2.4.2.3.3. Focus Groups
- 2.4.2.3.4. Observational Research
- 2.4.2.3.5. Social Media Interactions
- 2.4.2.4. Key Opinion Leaders Considered in Primary Research
- 2.4.2.4.1. Company Executives (CXOs)
- 2.4.2.4.2. Board of Directors
- 2.4.2.4.3. Company Presidents and Vice Presidents
- 2.4.2.4.4. Research and Development Heads
- 2.4.2.4.5. Technical Experts
- 2.4.2.4.6. Subject Matter Experts
- 2.4.2.4.7. Scientists
- 2.4.2.4.8. Doctors and Other Healthcare Providers
- 2.4.2.5. Ethics and Integrity
- 2.4.2.5.1. Research Ethics
- 2.4.2.5.2. Data Integrity
- 2.4.2.1. Types of Primary Research
- 2.4.3. Analytical Tools and Databases
- 2.4.1. Secondary Research
- 2.5. Robust Quality Control
3. MARKET DYNAMICS
- 3.1. Chapter Overview
- 3.2. Forecast Methodology
- 3.2.1. Top-down Approach
- 3.2.2. Bottom-up Approach
- 3.2.3. Hybrid Approach
- 3.3. Market Assessment Framework
- 3.3.1. Total Addressable Market (TAM)
- 3.3.2. Serviceable Addressable Market (SAM)
- 3.3.3. Serviceable Obtainable Market (SOM)
- 3.3.4. Currently Acquired Market (CAM)
- 3.4. Forecasting Tools and Techniques
- 3.4.1. Qualitative Forecasting
- 3.4.2. Correlation
- 3.4.3. Regression
- 3.4.4. Extrapolation
- 3.4.5. Convergence
- 3.4.6. Sensitivity Analysis
- 3.4.7. Scenario Planning
- 3.4.8. Data Visualization
- 3.4.9. Time Series Analysis
- 3.4.10. Forecast Error Analysis
- 3.5. Key Considerations
- 3.5.1. Demographics
- 3.5.2. Government Regulations
- 3.5.3. Reimbursement Scenarios
- 3.5.4. Market Access
- 3.5.5. Supply Chain
- 3.5.6. Industry Consolidation
- 3.5.7. Pandemic / Unforeseen Disruptions Impact
- 3.6. Limitations
4. MACRO-ECONOMIC INDICATORS
- 4.1. Chapter Overview
- 4.2. Market Dynamics
- 4.2.1. Time Period
- 4.2.1.1. Historical Trends
- 4.2.1.2. Current and Forecasted Estimates
- 4.2.2. Currency Coverage
- 4.2.2.1. Major Currencies Affecting the Market
- 4.2.2.2. Factors Affecting Currency Fluctuations on the Industry
- 4.2.2.3. Impact of Currency Fluctuations on the Industry
- 4.2.3. Foreign Currency Exchange Rate
- 4.2.3.1. Impact of Foreign Exchange Rate Volatility on the Market
- 4.2.3.2. Strategies for Mitigating Foreign Exchange Risk
- 4.2.4. Recession
- 4.2.4.1. Assessment of Current Economic Conditions and Potential Impact on the Market
- 4.2.4.2. Historical Analysis of Past Recessions and Lessons Learnt
- 4.2.5. Inflation
- 4.2.5.1. Measurement and Analysis of Inflationary Pressures in the Economy
- 4.2.5.2. Potential Impact of Inflation on the Market Evolution
- 4.2.6. Interest Rates
- 4.2.6.1. Interest Rates and Their Impact on the Market
- 4.2.6.2. Strategies for Managing Interest Rate Risk
- 4.2.7. Commodity Flow Analysis
- 4.2.7.1. Type of Commodity
- 4.2.7.2. Origins and Destinations
- 4.2.7.3. Values and Weights
- 4.2.7.4. Modes of Transportation
- 4.2.8. Global Trade Dynamics
- 4.2.8.1. Import Scenario
- 4.2.8.2. Export Scenario
- 4.2.8.3. Trade Policies
- 4.2.8.4. Strategies for Mitigating the Risks Associated with Trade Barriers
- 4.2.8.5. Impact of Trade Barriers on the Market
- 4.2.9. War Impact Analysis
- 4.2.9.1. Russian-Ukraine War
- 4.2.9.2. Israel-Hamas War
- 4.2.10. COVID Impact / Related Factors
- 4.2.10.1. Global Economic Impact
- 4.2.10.2. Industry-specific Impact
- 4.2.10.3. Government Response and Stimulus Measures
- 4.2.10.4. Future Outlook and Adaptation Strategies
- 4.2.11. Other Indicators
- 4.2.11.1. Fiscal Policy
- 4.2.11.2. Consumer Spending
- 4.2.11.3. Gross Domestic Product
- 4.2.11.4. Employment
- 4.2.11.5. Taxes
- 4.2.11.6. Stock Market Performance
- 4.2.11.7. Cross Border Dynamics
- 4.2.1. Time Period
- 4.3. Conclusion
SECTION II: QUALITATIVE INSIGHTS
5. EXECUTIVE SUMMARY
6. INTRODUCTION
- 6.1. Overview of Carbon Credits
- 6.2. Carbon Credits Issuers
- 6.3. Types of Carbon Credits
- 6.4. Introduction to Voluntary Carbon Market
- 6.5. Factors Impacting the Pricing of Voluntary Carbon Projects
- 6.6. Advantages of Voluntary Carbon
- 6.7. Future Perspectives
SECTION III: MARKET OVERVIEW
7. COMPETITIVE LANDSCAPE
- 7.1. Methodology and Key Parameters
- 7.2. Voluntary Carbon Credit Providers: Overall Landscape
- 7.2.1. Analysis by Year of Establishment
- 7.2.2. Analysis by Company Size
- 7.2.3. Analysis by Location of Headquarters (Region)
- 7.2.4. Analysis by Location of Headquarters (Country)
- 7.3. Voluntary Carbon Market: Overall Landscape
- 7.3.1. Analysis by Type of Credit
- 7.3.2. Analysis by Health and Livelihood Credits
- 7.3.3. Analysis by Nature-based Solution Credits
- 7.3.4. Analysis by Sustainable Infrastructure Credits
- 7.3.5. Analysis by End-user
SECTION IV: COMPANY PROFILES
8. COMPANY PROFILES
- 8.1. Overview
- 8.2. Leading Voluntary Carbon Credit Providers
- 8.2.1. EKI Energy Services
- 8.2.1.1. Company Overview
- 8.2.1.2. Company Mission
- 8.2.1.3. Management Team
- 8.2.1.4. Contact Details
- 8.2.1.5. Carbon Credit Portfolio
- 8.2.1.6. Financial Information
- 8.2.1.7. Recent Developments and Future Outlook
- 8.2.2. 3Degrees
- 8.2.3. Climate Impact Partners
- 8.2.4. Cool Effect
- 8.2.5. Ecologi Impact Funds
- 8.2.6. natureOffice
- 8.2.7. Solaxy Group
- 8.2.1. EKI Energy Services
- 8.3. Other Prominent Voluntary Carbon Credit Providers
- 8.3.1. ClimateSeed
- 8.3.1.1. Company Mission
- 8.3.1.2. Management Team
- 8.3.1.3. Carbon Credit Portfolio
- 8.3.2. Earthly
- 8.3.3. First Climate
- 8.3.4. Green Wedge
- 8.3.5. Greenfleet
- 8.3.6. South Pole
- 8.3.7. The Carbon Collective Company
- 8.3.1. ClimateSeed
SECTION V: MARKET TRENDS
9. CASE STUDY: IMPACT OF BIG PHARMA PLAYERS IN VOLUNTARY CARBON MARKET
- 9.1. Chapter Overview
- 9.2. Methodology and Key Parameters
- 9.2. Impact of Big Pharma Players in Voluntary Carbon Market
- 9.2.1. Johnson & Johnson
- 9.2.2. Roche
- 9.2.3. Pfizer
- 9.2.4. AbbVie
- 9.2.5. AstraZeneca
- 9.2.6. Novartis
- 9.2.7. Bristol Myers Squibb
- 9.2.8. GlaxoSmithKline
10. MARKET IMPACT ANALYSIS: DRIVERS, RESTRAINTS, OPPORTUNITIES AND CHALLENGES
- 10.1. Chapter Overview
- 10.2. Market Drivers
- 10.3. Market Restraints
- 10.4. Market Opportunities
- 10.5. Market Challenges
- 10.6. Conclusion
SECTION VI: MARKET FORECAST AND OPPORTUNITY ANALYSIS
11. VOLUNTARY CARBON MARKET
- 11.1. Key Assumptions and Methodology
- 11.2. Voluntary Carbon Market, Historical Trends (Since 2020) and Forecasted Estimates (Till 2035)
- 11.2.1. Multivariate Scenario Analysis
- 11.2.1.1. Conservative Scenario
- 11.2.1.2. Optimistic Scenario
- 11.2.1. Multivariate Scenario Analysis
- 11.3. Key Market Segmentations
12. VOLUNTARY CARBON MARKET, BY PROJECT
- 12.1. Key Assumptions and Methodology
- 12.2. Voluntary Carbon Market: Distribution by Project
- 12.2.1. Voluntary Carbon Market for Renewable Energy Projects, Historical Trends (Since 2020) and Forecasted Estimates (Till 2035)
- 12.2.2. Voluntary Carbon Market for Energy Efficiency Projects, Historical Trends (Since 2020) and Forecasted Estimates (Till 2035)
- 12.2.3. Voluntary Carbon Market for Forestry and Land Use Projects, Historical Trends (Since 2020) and Forecasted Estimates (Till 2035)
- 12.2.4. Voluntary Carbon Market for Methane Capture and Destruction Projects, Historical Trends (Since 2020) and Forecasted Estimates (Till 2035)
- 12.2.5. Voluntary Carbon Market for Other Projects, Historical Trends (Since 2020) and Forecasted Estimates (Till 2035)
- 12.3. Data Triangulation and Validation
- 12.3.1. Secondary Sources
- 12.3.2. Primary Sources
13. Voluntary Carbon MARKET, BY TYPE OF TRANSACTION
- 13.1. Key Assumptions and Methodology
- 13.2. Voluntary Carbon Market: Distribution by Type of Transaction
- 13.2.1. Voluntary Carbon Market for Carbon Removal, Historical Trends (Since 2020) and Forecasted Estimates (Till 2035)
- 13.2.2. Voluntary Carbon Market for Carbon Reduction, Historical Trends (Since 2020) and Forecasted Estimates (Till 2035)
- 13.2.3. Voluntary Carbon Market for Mixed Transaction, Historical Trends (Since 2020) and Forecasted Estimates (Till 2035)
- 13.3. Data Triangulation and Validation
- 13.3.1. Secondary Sources
- 13.3.2. Primary Sources
14. Voluntary Carbon MARKET, BY APPLICATION AREA
- 14.1. Key Assumptions and Methodology
- 14.2. Voluntary Carbon Market: Distribution by Application Area
- 14.2.1. Voluntary Carbon Market for Industrial Sector, Historical Trends (Since 2020) and Forecasted Estimates (Till 2035)
- 14.2.2. Voluntary Carbon Market for Household Sector, Historical Trends (Since 2020) and Forecasted Estimates (Till 2035)
- 14.2.3. Voluntary Carbon Market for Energy Sector, Historical Trends (Since 2020) and Forecasted Estimates (Till 2035)
- 14.2.4. Voluntary Carbon Market for Agriculture Sector, Historical Trends (Since 2020) and Forecasted Estimates (Till 2035)
- 14.2.5. Voluntary Carbon Market for Other Application Area, Historical Trends (Since 2020) and Forecasted Estimates (Till 2035)
- 14.3. Data Triangulation and Validation
- 14.3.1. Secondary Sources
- 14.3.2. Primary Sources
15. VOLUNTARY CARBON MARKET, BY END-USER
- 15.1. Key Assumptions and Methodology
- 15.2. Voluntary Carbon Market: Distribution by End-user
- 15.2.1. Voluntary Carbon Market for Government Agencies / Organizations, Historical Trends (Since 2020) and Forecasted Estimates (Till 2035)
- 15.2.2. Voluntary Carbon Market for Non-Profit Organizations, Historical Trends (Since 2020) and Forecasted Estimates (Till 2035)
- 15.2.3. Voluntary Carbon Market for Private Companies, Historical Trends (Since 2020) and Forecasted Estimates (Till 2035)
- 15.2.4. Voluntary Carbon Market for Individuals, Historical Trends (Since 2020) and Forecasted Estimates (Till 2035)
- 15.3. Data Triangulation and Validation
- 15.3.1. Secondary Sources
- 15.3.2. Primary Sources
16. VOLUNTARY CARBON MARKET, BY GEOGRAPHICAL REGION
- 16.1. Key Assumptions and Methodology
- 16.2. Voluntary Carbon Market: Distribution by Geographical Regions
- 16.2.1. Voluntary Carbon Market in North America, Historical Trends (Since 2020) and Forecasted Estimates (Till 2035)
- 16.2.1.1. Voluntary Carbon Market in the US, Historical Trends (Since 2020) and Forecasted Estimates (Till 2035)
- 16.2.1.2. Voluntary Carbon Market in Canada, Historical Trends (Since 2020) and Forecasted Estimates (Till 2035)
- 16.2.2. Voluntary Carbon Market in Europe, Historical Trends (Since 2020) and Forecasted Estimates (Till 2035)
- 16.2.2.1. Voluntary Carbon Market in Germany, Historical Trends (Since 2020) and Forecasted Estimates (Till 2035)
- 16.2.2.2. Voluntary Carbon Market in France, Historical Trends (Since 2020) and Forecasted Estimates (Till 2035)
- 16.2.2.3. Voluntary Carbon Market in Italy, Historical Trends (Since 2020) and Forecasted Estimates (Till 2035)
- 16.2.2.4. Voluntary Carbon Market in Belgium, Historical Trends (Since 2020) and Forecasted Estimates (Till 2035)
- 16.2.2.5. Voluntary Carbon Market in Austria, Historical Trends (Since 2020) and Forecasted Estimates (Till 2035)
- 16.2.2.6. Voluntary Carbon Market in Spain, Historical Trends (Since 2020) and Forecasted Estimates (Till 2035)
- 16.2.2.7. Voluntary Carbon Market in Netherlands, Historical Trends (Since 2020) and Forecasted Estimates (Till 2035)
- 16.2.2.8. Voluntary Carbon Market in the UK, Historical Trends (Since 2020) and Forecasted Estimates (Till 2035)
- 16.2.2.9. Voluntary Carbon Market in Rest of the Europe, Historical Trends (Since 2020) and Forecasted Estimates (Till 2035)
- 16.2.3. Voluntary Carbon Market in Asia-Pacific, Historical Trends (Since 2020) and Forecasted Estimates (Till 2035)
- 16.2.3.1. Voluntary Carbon Market in China, Historical Trends (Since 2020) and Forecasted Estimates (Till 2035)
- 16.2.3.2. Voluntary Carbon Market in India, Historical Trends (Since 2020) and Forecasted Estimates (Till 2035)
- 16.2.3.3. Voluntary Carbon Market in Japan, Historical Trends (Since 2020) and Forecasted Estimates (Till 2035)
- 16.2.3.4. Voluntary Carbon Market in Indonesia, Historical Trends (Since 2020) and Forecasted Estimates (Till 2035)
- 16.2.3.5. Voluntary Carbon Market in South Korea, Historical Trends (Since 2020) and Forecasted Estimates (Till 2035)
- 16.2.3.6. Voluntary Carbon Market in Australia, Historical Trends (Since 2020) and Forecasted Estimates (Till 2035)
- 16.2.3.7. Voluntary Carbon Market in Rest of the Asia-Pacific, Historical Trends (Since 2020) and Forecasted Estimates (Till 2035)
- 16.2.4. Voluntary Carbon Market in Latin America, Historical Trends (Since 2020) and Forecasted Estimates (Till 2035)
- 16.2.4.1. Voluntary Carbon Market in Argentina, Historical Trends (Since 2020) and Forecasted Estimates (Till 2035)
- 16.2.4.2. Voluntary Carbon Market in Brazil, Historical Trends (Since 2020) and Forecasted Estimates (Till 2035)
- 16.2.4.3. Voluntary Carbon Market in Mexico, Historical Trends (Since 2020) and Forecasted Estimates (Till 2035)
- 16.2.4.4. Voluntary Carbon Market in Rest of Latin America, Historical Trends (Since 2020) and Forecasted Estimates (Till 2035)
- 16.2.5. Voluntary Carbon Market in Middle East and Africa, Historical Trends (Since 2020) and Forecasted Estimates (Till 2035)
- 16.2.5.1. Voluntary Carbon Market in Iran, Historical Trends (Since 2020) and Forecasted Estimates (Till 2035)
- 16.2.5.2. Voluntary Carbon Market in Saudi Arabia, Historical Trends (Since 2020) and Forecasted Estimates (Till 2035)
- 16.2.5.3. Voluntary Carbon Market in UAE, Historical Trends (Since 2020) and Forecasted Estimates (Till 2035)
- 16.2.5.4. Voluntary Carbon Market in Israel, Historical Trends (Since 2020) and Forecasted Estimates (Till 2035)
- 16.2.5.5. Voluntary Carbon Market in South Africa, Historical Trends (Since 2020) and Forecasted Estimates (Till 2035)
- 16.2.5.6. Voluntary Carbon Market in Kuwait, Historical Trends (Since 2020) and Forecasted Estimates (Till 2035)
- 16.2.5.7. Voluntary Carbon Market in Oman, Historical Trends (Since 2020) and Forecasted Estimates (Till 2035)
- 16.2.5.8. Voluntary Carbon Market in Rest of the Middle East and Africa, Historical Trends (Since 2020) and Forecasted Estimates (Till 2035)
- 16.2.1. Voluntary Carbon Market in North America, Historical Trends (Since 2020) and Forecasted Estimates (Till 2035)
- 16.3 Voluntary Carbon Market, By Geographical Regions: Market Dynamics Assessment
- 16.3.1. Penetration-Growth (P-G) Matrix
- 16.3.2. Market Movement Analysis
- 16.4. Data Triangulation and Validation
- 16.4.1. Secondary Sources
- 16.4.2. Primary Sources
SECTION VII: MARKET OPPORTUNITY ANALYSIS WITHIN GEOGRAPHICAL REGIONS**
17. MARKET OPPORTUNITY ANALYSIS: NORTH AMERICA
- 17.1. Voluntary Carbon Market in North America: Distribution by Project
- 17.1.1. Voluntary Carbon Market in North America for Renewable Energy Projects, Historical Trends (Since 2020) and Forecasted Estimates (Till 2035)
- 17.1.2. Voluntary Carbon Market in North America for Energy Efficiency Projects, Historical Trends (Since 2020) and Forecasted Estimates (Till 2035)
- 17.1.3. Voluntary Carbon Market in North America for Forestry and Land Use Projects, Historical Trends (Since 2020) and Forecasted Estimates (Till 2035)
- 17.1.4. Voluntary Carbon Market in North America for Methane Capture and Destruction Projects, Historical Trends (Since 2020) and Forecasted Estimates (Till 2035)
- 17.1.5. Voluntary Carbon Market in North America for Other Projects, Historical Trends (Since 2020) and Forecasted Estimates (Till 2035)
- 17.2. Voluntary Carbon Market in North America: Distribution by Type of Transaction
- 17.2.1. Voluntary Carbon Market in North America for Carbon Removal, Historical Trends (Since 2020) and Forecasted Estimates (Till 2035)
- 17.2.2. Voluntary Carbon Market in North America for Carbon Reduction, Historical Trends (Since 2020) and Forecasted Estimates (Till 2035)
- 17.2.3. Voluntary Carbon Market in North America for Mixed Transaction, Historical Trends (Since 2020) and Forecasted Estimates (Till 2035)
- 17.3. Voluntary Carbon Market in North America: Distribution by Application Area
- 17.3.1. Voluntary Carbon Market in North America for Industrial Sector, Historical Trends (Since 2020) and Forecasted Estimates (Till 2035)
- 17.3.2. Voluntary Carbon Market in North America for Household Sector, Historical Trends (Since 2020) and Forecasted Estimates (Till 2035)
- 17.3.3. Voluntary Carbon Market in North America for Energy Sector, Historical Trends (Since 2020) and Forecasted Estimates (Till 2035)
- 17.3.4. Voluntary Carbon Market in North America for Agriculture Sector, Historical Trends (Since 2020) and Forecasted Estimates (Till 2035)
- 17.3.5. Voluntary Carbon Market in North America for Other Application Area, Historical Trends (Since 2020) and Forecasted Estimates (Till 2035)
- 17.4. Voluntary Carbon Market in North America: Distribution by End-user
- 17.4.1. Voluntary Carbon Market in North America for Government Agencies / Organizations, Historical Trends (Since 2020) and Forecasted Estimates (Till 2035)
- 17.4.2. Voluntary Carbon Market in North America for Non-Profit Organizations, Historical Trends (Since 2020) and Forecasted Estimates (Till 2035)
- 17.4.3. Voluntary Carbon Market in North America for Private Companies, Historical Trends (Since 2020) and Forecasted Estimates (Till 2035)
- 17.4.4. Voluntary Carbon Market in North America for Individuals, Historical Trends (Since 2020) and Forecasted Estimates (Till 2035)
18. MARKET OPPORTUNITY ANALYSIS: EUROPE
- 18.1. Voluntary Carbon Market in Europe: Distribution by Project
- 18.1.1. Voluntary Carbon Market in Europe for Renewable Energy Projects, Historical Trends (Since 2020) and Forecasted Estimates (Till 2035)
- 18.1.2. Voluntary Carbon Market in Europe for Energy Efficiency Projects, Historical Trends (Since 2020) and Forecasted Estimates (Till 2035)
- 18.1.3. Voluntary Carbon Market in Europe for Forestry and Land Use Projects, Historical Trends (Since 2020) and Forecasted Estimates (Till 2035)
- 18.1.4. Voluntary Carbon Market in Europe for Methane Capture and Destruction Projects, Historical Trends (Since 2020) and Forecasted Estimates (Till 2035)
- 18.1.5. Voluntary Carbon Market in Europe for Other Projects, Historical Trends (Since 2020) and Forecasted Estimates (Till 2035)
- 18.2. Voluntary Carbon Market in Europe: Distribution by Type of Transaction
- 18.2.1. Voluntary Carbon Market in Europe for Carbon Removal, Historical Trends (Since 2020) and Forecasted Estimates (Till 2035)
- 18.2.2. Voluntary Carbon Market in Europe for Carbon Reduction, Historical Trends (Since 2020) and Forecasted Estimates (Till 2035)
- 18.2.3. Voluntary Carbon Market in Europe for Mixed Transaction, Historical Trends (Since 2020) and Forecasted Estimates (Till 2035)
- 18.3. Voluntary Carbon Market in Europe: Distribution by Application Area
- 18.3.1. Voluntary Carbon Market in Europe for Industrial Sector, Historical Trends (Since 2020) and Forecasted Estimates (Till 2035)
- 18.3.2. Voluntary Carbon Market in Europe for Household Sector, Historical Trends (Since 2020) and Forecasted Estimates (Till 2035)
- 18.3.3. Voluntary Carbon Market in Europe for Energy Sector, Historical Trends (Since 2020) and Forecasted Estimates (Till 2035)
- 18.3.4. Voluntary Carbon Market in Europe for Agriculture Sector, Historical Trends (Since 2020) and Forecasted Estimates (Till 2035)
- 18.3.5. Voluntary Carbon Market in Europe for Other Application Area, Historical Trends (Since 2020) and Forecasted Estimates (Till 2035)
- 18.4. Voluntary Carbon Market in Europe: Distribution by End-user
- 18.4.1. Voluntary Carbon Market in Europe for Government Agencies / Organizations, Historical Trends (Since 2020) and Forecasted Estimates (Till 2035)
- 18.4.2. Voluntary Carbon Market in Europe for Non-Profit Organizations, Historical Trends (Since 2020) and Forecasted Estimates (Till 2035)
- 18.4.3. Voluntary Carbon Market in Europe for Private Companies, Historical Trends (Since 2020) and Forecasted Estimates (Till 2035)
- 18.4.4. Voluntary Carbon Market in Europe for Individuals, Historical Trends (Since 2020) and Forecasted Estimates (Till 2035)
19. MARKET OPPORTUNITY ANALYSIS: ASIA-PACIFIC
- 19.1. Voluntary Carbon Market in Asia-Pacific: Distribution by Project
- 19.1.1. Voluntary Carbon Market in Asia-Pacific for Renewable Energy Projects, Historical Trends (Since 2020) and Forecasted Estimates (Till 2035)
- 19.1.2. Voluntary Carbon Market in Asia-Pacific for Energy Efficiency Projects, Historical Trends (Since 2020) and Forecasted Estimates (Till 2035)
- 19.1.3. Voluntary Carbon Market in Asia-Pacific for Forestry and Land Use Projects, Historical Trends (Since 2020) and Forecasted Estimates (Till 2035)
- 19.1.4. Voluntary Carbon Market in Asia-Pacific for Methane Capture and Destruction Projects, Historical Trends (Since 2020) and Forecasted Estimates (Till 2035)
- 19.1.5. Voluntary Carbon Market in Asia-Pacific for Other Projects, Historical Trends (Since 2020) and Forecasted Estimates (Till 2035)
- 19.2. Voluntary Carbon Market in Asia-Pacific: Distribution by Type of Transaction
- 19.2.1. Voluntary Carbon Market in Asia-Pacific for Carbon Removal, Historical Trends (Since 2020) and Forecasted Estimates (Till 2035)
- 19.2.2. Voluntary Carbon Market in Asia-Pacific for Carbon Reduction, Historical Trends (Since 2020) and Forecasted Estimates (Till 2035)
- 19.2.3. Voluntary Carbon Market in Asia-Pacific for Mixed Transaction, Historical Trends (Since 2020) and Forecasted Estimates (Till 2035)
- 19.3. Voluntary Carbon Market in Asia-Pacific: Distribution by Application Area
- 19.3.1. Voluntary Carbon Market in Asia-Pacific for Industrial Sector, Historical Trends (Since 2020) and Forecasted Estimates (Till 2035)
- 19.3.2. Voluntary Carbon Market in Asia-Pacific for Household Sector, Historical Trends (Since 2020) and Forecasted Estimates (Till 2035)
- 19.3.3. Voluntary Carbon Market in Asia-Pacific for Energy Sector, Historical Trends (Since 2020) and Forecasted Estimates (Till 2035)
- 19.3.4. Voluntary Carbon Market in Asia-Pacific for Agriculture Sector, Historical Trends (Since 2020) and Forecasted Estimates (Till 2035)
- 19.3.5. Voluntary Carbon Market in Asia-Pacific for Other Application Area, Historical Trends (Since 2020) and Forecasted Estimates (Till 2035)
- 19.4. Voluntary Carbon Market in Asia-Pacific: Distribution by End-user
- 19.4.1. Voluntary Carbon Market in Asia-Pacific for Government Agencies / Organizations, Historical Trends (Since 2020) and Forecasted Estimates (Till 2035)
- 19.4.2. Voluntary Carbon Market in Asia-Pacific for Non-Profit Organizations, Historical Trends (Since 2020) and Forecasted Estimates (Till 2035)
- 19.4.3. Voluntary Carbon Market in Asia-Pacific for Private Companies, Historical Trends (Since 2020) and Forecasted Estimates (Till 2035)
- 19.4.4. Voluntary Carbon Market in Asia-Pacific for Individuals, Historical Trends (Since 2020) and Forecasted Estimates (Till 2035)
20. MARKET OPPORTUNITY ANALYSIS: LATIN AMERICA
- 20.1. Voluntary Carbon Market in Latin America: Distribution by Project
- 20.1.1. Voluntary Carbon Market in Latin America for Renewable Energy Projects, Historical Trends (Since 2020) and Forecasted Estimates (Till 2035)
- 20.1.2. Voluntary Carbon Market in Latin America for Energy Efficiency Projects, Historical Trends (Since 2020) and Forecasted Estimates (Till 2035)
- 20.1.3. Voluntary Carbon Market in Latin America for Forestry and Land Use Projects, Historical Trends (Since 2020) and Forecasted Estimates (Till 2035)
- 20.1.4. Voluntary Carbon Market in Latin America for Methane Capture and Destruction Projects, Historical Trends (Since 2020) and Forecasted Estimates (Till 2035)
- 20.1.5. Voluntary Carbon Market in Latin America for Other Projects, Historical Trends (Since 2020) and Forecasted Estimates (Till 2035)
- 20.2. Voluntary Carbon Market in Latin America: Distribution by Type of Transaction
- 20.2.1. Voluntary Carbon Market in Latin America for Carbon Removal, Historical Trends (Since 2020) and Forecasted Estimates (Till 2035)
- 20.2.2. Voluntary Carbon Market in Latin America for Carbon Reduction, Historical Trends (Since 2020) and Forecasted Estimates (Till 2035)
- 20.2.3. Voluntary Carbon Market in Latin America for Mixed Transaction, Historical Trends (Since 2020) and Forecasted Estimates (Till 2035)
- 20.3. Voluntary Carbon Market in Latin America: Distribution by Application Area
- 20.3.1. Voluntary Carbon Market in Latin America for Industrial Sector, Historical Trends (Since 2020) and Forecasted Estimates (Till 2035)
- 20.3.2. Voluntary Carbon Market in Latin America for Household Sector, Historical Trends (Since 2020) and Forecasted Estimates (Till 2035)
- 20.3.3. Voluntary Carbon Market in Latin America for Energy Sector, Historical Trends (Since 2020) and Forecasted Estimates (Till 2035)
- 20.3.4. Voluntary Carbon Market in Latin America for Agriculture Sector, Historical Trends (Since 2020) and Forecasted Estimates (Till 2035)
- 20.3.5. Voluntary Carbon Market in Latin America for Other Application Area, Historical Trends (Since 2020) and Forecasted Estimates (Till 2035)
- 20.4. Voluntary Carbon Market in Latin America: Distribution by End-user
- 20.4.1. Voluntary Carbon Market in Latin America for Government Agencies / Organizations, Historical Trends (Since 2020) and Forecasted Estimates (Till 2035)
- 20.4.2. Voluntary Carbon Market in Latin America for Non-Profit Organizations, Historical Trends (Since 2020) and Forecasted Estimates (Till 2035)
- 20.4.3. Voluntary Carbon Market in Latin America for Private Companies, Historical Trends (Since 2020) and Forecasted Estimates (Till 2035)
- 20.4.4. Voluntary Carbon Market in Latin America for Individuals, Historical Trends (Since 2020) and Forecasted Estimates (Till 2035)
21. MARKET OPPORTUNITY ANALYSIS: MIDDLE EAST AND AFRICA
- 21.1. Voluntary Carbon Market in Middle East and Africa: Distribution by Project
- 21.1.1. Voluntary Carbon Market in Middle East and Africa for Renewable Energy Projects, Historical Trends (Since 2020) and Forecasted Estimates (Till 2035)
- 21.1.2. Voluntary Carbon Market in Middle East and Africa for Energy Efficiency Projects, Historical Trends (Since 2020) and Forecasted Estimates (Till 2035)
- 21.1.3. Voluntary Carbon Market in Middle East and Africa for Forestry and Land Use Projects, Historical Trends (Since 2020) and Forecasted Estimates (Till 2035)
- 21.1.4. Voluntary Carbon Market in Middle East and Africa for Methane Capture and Destruction Projects, Historical Trends (Since 2020) and Forecasted Estimates (Till 2035)
- 21.1.5. Voluntary Carbon Market in Middle East and Africa for Other Projects, Historical Trends (Since 2020) and Forecasted Estimates (Till 2035)
- 21.2. Voluntary Carbon Market in Middle East and Africa: Distribution by Type of Transaction
- 21.2.1. Voluntary Carbon Market in Middle East and Africa for Carbon Removal, Historical Trends (Since 2020) and Forecasted Estimates (Till 2035)
- 21.2.2. Voluntary Carbon Market in Middle East and Africa for Carbon Reduction, Historical Trends (Since 2020) and Forecasted Estimates (Till 2035)
- 21.2.3. Voluntary Carbon Market in Middle East and Africa for Mixed Transaction, Historical Trends (Since 2020) and Forecasted Estimates (Till 2035)
- 21.3. Voluntary Carbon Market in Middle East and Africa: Distribution by Application Area
- 21.3.1. Voluntary Carbon Market in Middle East and Africa for Industrial Sector, Historical Trends (Since 2020) and Forecasted Estimates (Till 2035)
- 21.3.2. Voluntary Carbon Market in Middle East and Africa for Household Sector, Historical Trends (Since 2020) and Forecasted Estimates (Till 2035)
- 21.3.3. Voluntary Carbon Market in Middle East and Africa for Energy Sector, Historical Trends (Since 2020) and Forecasted Estimates (Till 2035)
- 21.3.4. Voluntary Carbon Market in Middle East and Africa for Agriculture Sector, Historical Trends (Since 2020) and Forecasted Estimates (Till 2035)
- 21.3.5. Voluntary Carbon Market in Middle East and Africa for Other Application Area, Historical Trends (Since 2020) and Forecasted Estimates (Till 2035)
- 21.4. Voluntary Carbon Market in Middle East and Africa: Distribution by End-user
- 21.4.1. Voluntary Carbon Market in Middle East and Africa for Government Agencies / Organizations, Historical Trends (Since 2020) and Forecasted Estimates (Till 2035)
- 21.4.2. Voluntary Carbon Market in Middle East and Africa for Non-Profit Organizations, Historical Trends (Since 2020) and Forecasted Estimates (Till 2035)
- 21.4.3. Voluntary Carbon Market in Middle East and Africa for Private Companies, Historical Trends (Since 2020) and Forecasted Estimates (Till 2035)
- 21.4.4. Voluntary Carbon Market in Middle East and Africa for Individuals, Historical Trends (Since 2020) and Forecasted Estimates (Till 2035)
- *Detailed information on Section VII is available in the Excel Data Packs shared along with the report
SECTION VIII: OTHER EXCLUSIVE INSIGHTS
22. INSIGHTS FROM PRIMARY RESEARCH
23. CONCLUDING INSIGHTS
24. CUSTOMIZATION OPPORTUNITIES
25. ROOTS SUBSCRIPTION SERVICES
26. AUTHOR DETAILS
SECTION IX: APPENDICES
27. TABULATED DATA
28. LIST OF COMPANIES AND ORGANIZATIONS
List of Tables
- Table 7.1 List of Voluntary Carbon Credit Providers
- Table 7.2 List of Voluntary Carbon Credit Providers: Information on Type of Credit
- Table 7.3 List of Voluntary Carbon Credit Providers: Information on Location of Project (Region) and End-users
- Table 17.1 Voluntary Carbon Market in North America: Distribution by Project, Historical Trends (Since 2020) and Forecasted Estimates (Till 2035)
(USD Billion)**
- Table 17.2 Voluntary Carbon Market in North America: Distribution by Type of Transaction, Historical Trends (Since 2020) and Forecasted Estimates
(Till 2035) (USD Billion)
- Table 17.3 Voluntary Carbon Market in North America: Distribution by Application Area, Historical Trends (Since 2020) and Forecasted Estimates
(Till 2035) (USD Billion)
- Table 17.4 Voluntary Carbon Market in North America: Distribution by End-user, Historical Trends (Since 2020) and Forecasted Estimates (Till 2035) (USD Billion)
- Table 18.1 Voluntary Carbon Market in Europe: Distribution by Project, Historical Trends (Since 2020) and Forecasted Estimates (Till 2035) (USD Billion)
- Table 18.2 Voluntary Carbon Market in Europe: Distribution by Type of Transaction, Historical Trends (Since 2020) and Forecasted Estimates (Till 2035) (USD Billion)
- Table 18.3 Voluntary Carbon Market in Europe: Distribution by Application Area, Historical Trends (Since 2020) and Forecasted Estimates (Till 2035) (USD Billion)
- Table 18.4 Voluntary Carbon Market in Europe: Distribution by End-user, Historical Trends (Since 2020) and Forecasted Estimates (Till 2035) (USD Billion)
- Table 19.1 Voluntary Carbon Market in Asia-Pacific: Distribution by Project, Historical Trends (Since 2020) and Forecasted Estimates (Till 2035) (USD Billion)
- Table 19.2 Voluntary Carbon Market in Asia-Pacific: Distribution by Type of Transaction, Historical Trends (Since 2020) and Forecasted Estimates
(Till 2035) (USD Billion)
- Table 19.3 Voluntary Carbon Market in Asia-Pacific: Distribution by Application Area, Historical Trends (Since 2020) and Forecasted Estimates (Till 2035) (USD Billion)
- Table 19.4 Voluntary Carbon Market in Asia-Pacific: Distribution by End-user, Historical Trends (Since 2020) and Forecasted Estimates (Till 2035) (USD Billion)
- Table 20.1 Voluntary Carbon Market in Latin America: Distribution by Project, Historical Trends (Since 2020) and Forecasted Estimates (Till 2035) (USD Billion)
- Table 20.2 Voluntary Carbon Market in Latin America: Distribution by Type of Transaction, Historical Trends (Since 2020) and Forecasted Estimates
(Till 2035) (USD Billion)
- Table 20.3 Voluntary Carbon Market in Latin America: Distribution by Application Area, Historical Trends (Since 2020) and Forecasted Estimates
(Till 2035) (USD Billion)
- Table 20.4 Voluntary Carbon Market in Latin America: Distribution by End-user, Historical Trends (Since 2020) and Forecasted Estimates (Till 2035)
(USD Billion)
- Table 21.1 Voluntary Carbon Market in Middle East and Africa: Distribution by Project, Historical Trends (Since 2020) and Forecasted Estimates
(Till 2035) (USD Billion)
- Table 21.2 Voluntary Carbon Market in Middle East and Africa: Distribution by Type of Transaction, Historical Trends (Since 2020) and Forecasted Estimates (Till 2035) (USD Billion)
- Table 21.3 Voluntary Carbon Market in Middle East and Africa: Distribution by Application Area, Historical Trends (Since 2020) and Forecasted Estimates (Till 2035) (USD Billion)
- Table 21.4 Voluntary Carbon Market in Middle East and Africa: Distribution by End-user, Historical Trends (Since 2020) and Forecasted Estimates
(Till 2035) (USD Billion)
- *Detailed information on Tables 17.1-21.4 is available in the Excel Data Packs shared along with the report**
- Table 24.1 Voluntary Carbon Credit Providers: Distribution by Year of Establishment
- Table 24.2 Voluntary Carbon Credit Providers: Distribution by Company Size
- Table 24.3 Voluntary Carbon Credit Providers: Distribution by Location of Headquarters (Region)
- Table 24.4 Voluntary Carbon Credit Providers: Distribution by Location of Headquarters (Country)
- Table 24.5 Voluntary Carbon Market: Distribution by Type of Credit
- Table 24.6 Voluntary Carbon Market: Distribution by Health and Livelihood Credits
- Table 24.7 Voluntary Carbon Market: Distribution by Nature-based Solution Credits
- Table 24.8 Voluntary Carbon Market: Distribution by Sustainable Infrastructure Credits
- Table 24.9 Voluntary Carbon Market: Distribution by End-user
- Table 24.10 Voluntary Carbon Market: Growth Drivers
- Table 24.11 Voluntary Carbon Market: Market Restraints
- Table 24.12 Voluntary Carbon Market: Market Opportunities
- Table 24.13 Voluntary Carbon Market: Market Challenges
- Table 24.14 Voluntary Carbon Market, Historical Trends (Since 2020) and Forecasted Estimated (Till 2035) (USD Billion)
- Table 24.15 Voluntary Carbon Market, Historical Trends (Since 2020) and Forecasted Estimated (Till 2035): Conservative Scenario (USD Billion)
- Table 24.16 Voluntary Carbon Market, Historical Trends (Since 2020) and Forecasted Estimated (Till 2035): Optimistic Scenario (USD Billion)
- Table 24.17 Voluntary Carbon Market: Distribution by Project
- Table 24.18 Voluntary Carbon Market for Renewable Energy Projects, Historical Trends (Since 2020) and Forecasted Estimates (Till 2035) (USD Billion)
- Table 24.19 Voluntary Carbon Market for Energy Efficiency Projects, Historical Trends (Since 2020) and Forecasted Estimates (Till 2035) (USD Billion)
- Table 24.20 Voluntary Carbon Market for Forestry and Land Use Projects, Historical Trends (Since 2020) and Forecasted Estimates (Till 2035) (USD Billion)
- Table 24.21 Voluntary Carbon Market for Methane Capture and Destruction Projects, Historical Trends (Since 2020) and Forecasted Estimates (Till 2035) (USD Billion)
- Table 24.22 Voluntary Carbon Market for Other Projects, Historical Trends (Since 2020) and Forecasted Estimates (Till 2035) (USD Billion)
- Table 24.23 Voluntary Carbon Market: Distribution by Type of Transaction
- Table 24.24 Voluntary Carbon Market for Carbon Removal, Historical Trends (Since 2020) and Forecasted Estimates (Till 2035) (USD Billion)
- Table 24.25 Voluntary Carbon Market for Carbon Reduction, Historical Trends (Since 2020) and Forecasted Estimates (Till 2035) (USD Billion)
- Table 24.26 Voluntary Carbon Market for Mixed Transaction, Historical Trends (Since 2020) and Forecasted Estimates (Till 2035) (USD Billion)
- Table 24.27 Voluntary Carbon Market: Distribution by Application Area
- Table 24.28 Voluntary Carbon Market for Industrial Sector, Historical Trends (Since 2020) and Forecasted Estimates (Till 2035) (USD Billion)
- Table 24.29 Voluntary Carbon Market for Household Sector, Historical Trends (Since 2020) and Forecasted Estimates (Till 2035) (USD Billion)
- Table 24.30 Voluntary Carbon Market for Energy Sector, Historical Trends (Since 2020) and Forecasted Estimates (Till 2035) (USD Billion)
- Table 24.31 Voluntary Carbon Market for Agriculture Sector, Historical Trends (Since 2020) and Forecasted Estimates (Till 2035) (USD Billion)
- Table 24.32 Voluntary Carbon Market for Other Application Area, Historical Trends (Since 2020) and Forecasted Estimates (Till 2035) (USD Billion)
- Table 24.33 Voluntary Carbon Market: Distribution by End-user
- Table 24.34 Voluntary Carbon Market for Government Agencies / Organizations, Historical Trends (Since 2020) and Forecasted Estimates (Till 2035) (USD Billion)
- Table 24.35 Voluntary Carbon Market for Non-Profit Organizations, Historical Trends (Since 2020) and Forecasted Estimates (Till 2035) (USD Billion)
- Table 24.36 Voluntary Carbon Market for Private Companies, Historical Trends (Since 2020) and Forecasted Estimates (Till 2035) (USD Billion)
- Table 24.37 Voluntary Carbon Market for Individuals, Historical Trends (Since 2020) and Forecasted Estimates (Till 2035) (USD Billion)
- Table 24.38 Voluntary Carbon Market: Distribution by Geographical Regions
- Table 24.39 Voluntary Carbon Market in North America, Historical Trends (Since 2020) and Forecasted Estimates (Till 2035) (USD Billion)
- Table 24.40 Voluntary Carbon Market in the US, Historical Trends (Since 2020) and Forecasted Estimates (Till 2035) (USD Billion)
- Table 24.41 Voluntary Carbon Market in Canada, Historical Trends (Since 2020) and Forecasted Estimates (Till 2035) (USD Billion)
- Table 24.42 Voluntary Carbon Market in Europe, Historical Trends (Since 2020) and Forecasted Estimates (Till 2035) (USD Billion)
- Table 24.43 Voluntary Carbon Market in Germany, Historical Trends (Since 2020) and Forecasted Estimates (Till 2035) (USD Billion)
- Table 24.44 Voluntary Carbon Market in the France, Historical Trends (Since 2020) and Forecasted Estimates (Till 2035) (USD Billion)
- Table 24.45 Voluntary Carbon Market in Italy, Historical Trends (Since 2020) and Forecasted Estimates (Till 2035) (USD Billion)
- Table 24.46 Voluntary Carbon Market in Belgium, Historical Trends (Since 2020) and Forecasted Estimates (Till 2035) (USD Billion)
- Table 24.47 Voluntary Carbon Market in Austria, Historical Trends (Since 2020) and Forecasted Estimates (Till 2035) (USD Billion)
- Table 24.48 Voluntary Carbon Market in Spain, Historical Trends (Since 2020) and Forecasted Estimates (Till 2035) (USD Billion)
- Table 24.49 Voluntary Carbon Market in Netherlands, Historical Trends (Since 2020) and Forecasted Estimates (Till 2035) (USD Billion)
- Table 24.50 Voluntary Carbon Market in the UK, Historical Trends (Since 2020) and Forecasted Estimates (Till 2035) (USD Billion)
- Table 24.51 Voluntary Carbon Market in Rest of the Europe, Historical Trends (Since 2020) and Forecasted Estimates (Till 2035) (USD Billion)
- Table 24.52 Voluntary Carbon Market in Asia-Pacific, Historical Trends (Since 2020) and Forecasted Estimates (Till 2035) (USD Billion)
- Table 24.53 Voluntary Carbon Market in China, Historical Trends (Since 2020) and Forecasted Estimates (Till 2035) (USD Billion)
- Table 24.54 Voluntary Carbon Market in India, Historical Trends (Since 2020) and Forecasted Estimates (Till 2035) (USD Billion)
- Table 24.55 Voluntary Carbon Market in Japan, Historical Trends (Since 2020) and Forecasted Estimates (Till 2035) (USD Billion)
- Table 24.56 Voluntary Carbon Market in Indonesia, Historical Trends (Since 2020) and Forecasted Estimates (Till 2035) (USD Billion)
- Table 24.57 Voluntary Carbon Market in South Korea, Historical Trends (Since 2020) and Forecasted Estimates (Till 2035) (USD Billion)
- Table 24.58 Voluntary Carbon Market in Australia, Historical Trends (Since 2020) and Forecasted Estimates (Till 2035) (USD Billion)
- Table 24.59 Voluntary Carbon Market in Rest of the Asia-Pacific, Historical Trends (Since 2020) and Forecasted Estimates (Till 2035) (USD Billion)
- Table 24.60 Voluntary Carbon Market in Latin America, Historical Trends (Since 2020) and Forecasted Estimates (Till 2035) (USD Billion)
- Table 24.61 Voluntary Carbon Market in Argentina, Historical Trends (Since 2020) and Forecasted Estimates (Till 2035) (USD Billion)
- Table 24.62 Voluntary Carbon Market in Brazil, Historical Trends (Since 2020) and Forecasted Estimates (Till 2035) (USD Billion)
- Table 24.63 Voluntary Carbon Market in Mexico, Historical Trends (Since 2020) and Forecasted Estimates (Till 2035) (USD Billion)
- Table 24.64 Voluntary Carbon Market in Rest of Latin America, Historical Trends (Since 2020) and Forecasted Estimates (Till 2035) (USD Billion)
- Table 24.65 Voluntary Carbon Market in Middle East and Africa, Historical Trends (Since 2020) and Forecasted Estimates (Till 2035) (USD Billion)
- Table 24.66 Voluntary Carbon Market in Iran, Historical Trends (Since 2020) and Forecasted Estimates (Till 2035) (USD Billion)
- Table 24.67 Voluntary Carbon Market in Saudi Arabia, Historical Trends (Since 2020) and Forecasted Estimates (Till 2035) (USD Billion)
- Table 24.68 Voluntary Carbon Market in UAE, Historical Trends (Since 2020) and Forecasted Estimates (Till 2035) (USD Billion)
- Table 24.69 Voluntary Carbon Market in Israel, Historical Trends (Since 2020) and Forecasted Estimates (Till 2035) (USD Billion)
- Table 24.70 Voluntary Carbon Market in South Africa, Historical Trends (Since 2020) and Forecasted Estimates (Till 2035) (USD Billion)
- Table 24.71 Voluntary Carbon Market in Kuwait, Historical Trends (Since 2020) and Forecasted Estimates (Till 2035) (USD Billion)
- Table 24.72 Voluntary Carbon Market in Oman, Historical Trends (Since 2020) and Forecasted Estimates (Till 2035) (USD Billion)
- Table 24.73 Voluntary Carbon Market in Rest of the Middle East and Africa, Historical Trends (Since 2020) and Forecasted Estimates (Till 2035) (USD Billion)
List of Figures
- Figure 2.1 Research Methodology: Project Methodology
- Figure 2.2 Research Methodology: Data Sources for Secondary Research
- Figure 2.3 Research Methodology: Robust Quality Control
- Figure 3.1 Market Dynamics: Forecast Methodology
- Figure 3.2 Market Dynamics: Market Assessment Framework
- Figure 4.1 Lessons Learnt from Past Recessions
- Figure 5.1 Executive Summary: Market Landscape
- Figure 5.2 Executive Summary: Market Forecast and Opportunity Analysis
- Figure 7.1 Voluntary Carbon Credit Providers: Distribution by Year of Establishment
- Figure 7.2 Voluntary Carbon Credit Providers: Distribution by Company Size
- Figure 7.3 Voluntary Carbon Credit Providers: Distribution by Location of Headquarters (Region)
- Figure 7.4 Voluntary Carbon Credit Providers: Distribution by Location of Headquarters (Country)
- Figure 7.5 Voluntary Carbon Market: Distribution by Type of Credit
- Figure 7.6 Voluntary Carbon Market: Distribution by Health and Livelihood Credits
- Figure 7.7 Voluntary Carbon Market: Distribution by Nature-based Solution Credits
- Figure 7.8 Voluntary Carbon Market: Distribution by Sustainable Infrastructure Credits
- Figure 7.9 Voluntary Carbon Market: Distribution by End-user
- Figure 10.1 Voluntary Carbon Market: Growth Drivers
- Figure 10.2 Voluntary Carbon Market: Market Restraints
- Figure 10.3 Voluntary Carbon Market: Market Opportunities
- Figure 10.4 Voluntary Carbon Market: Market Challenges
- Figure 11.1 Voluntary Carbon Market, Historical Trends (Since 2020) and Forecasted Estimated (Till 2035) (USD Billion)
- Figure 11.2 Voluntary Carbon Market, Historical Trends (Since 2020) and Forecasted Estimated (Till 2035): Conservative Scenario (USD Billion)
- Figure 11.3 Voluntary Carbon Market, Historical Trends (Since 2020) and Forecasted Estimated (Till 2035): Optimistic Scenario (USD Billion)
- Figure 12.1 Voluntary Carbon Market: Distribution by Project
- Figure 12.2 Voluntary Carbon Market for Renewable Energy Projects, Historical Trends (Since 2020) and Forecasted Estimates (Till 2035) (USD Billion)
- Figure 12.3 Voluntary Carbon Market for Energy Efficiency Projects, Historical Trends (Since 2020) and Forecasted Estimates (Till 2035) (USD Billion)
- Figure 12.4 Voluntary Carbon Market for Forestry and Land Use Projects, Historical Trends (Since 2020) and Forecasted Estimates (Till 2035) (USD Billion)
- Figure 12.5 Voluntary Carbon Market for Methane Capture and Destruction Projects, Historical Trends (Since 2020) and Forecasted Estimates (Till 2035) (USD Billion)
- Figure 12.6 Voluntary Carbon Market for Other Projects, Historical Trends (Since 2020) and Forecasted Estimates (Till 2035) (USD Billion)
- Figure 13.1 Voluntary Carbon Market: Distribution by Type of Transaction
- Figure 13.2 Voluntary Carbon Market for Carbon Removal, Historical Trends (Since 2020) and Forecasted Estimates (Till 2035) (USD Billion)
- Figure 13.3 Voluntary Carbon Market for Carbon Reduction, Historical Trends (Since 2020) and Forecasted Estimates (Till 2035) (USD Billion)
- Figure 13.4 Voluntary Carbon Market for Mixed Transaction, Historical Trends (Since 2020) and Forecasted Estimates (Till 2035) (USD Billion)
- Figure 14.1 Voluntary Carbon Market: Distribution by Application Area
- Figure 14.2 Voluntary Carbon Market for Industrial Sector, Historical Trends (Since 2020) and Forecasted Estimates (Till 2035) (USD Billion)
- Figure 14.3 Voluntary Carbon Market for Household Sector, Historical Trends (Since 2020) and Forecasted Estimates (Till 2035) (USD Billion)
- Figure 14.4 Voluntary Carbon Market for Energy Sector, Historical Trends (Since 2020) and Forecasted Estimates (Till 2035) (USD Billion)
- Figure 14.5 Voluntary Carbon Market for Agriculture Sector, Historical Trends (Since 2020) and Forecasted Estimates (Till 2035) (USD Billion)
- Figure 14.6 Voluntary Carbon Market for Other Application Area, Historical Trends (Since 2020) and Forecasted Estimates (Till 2035) (USD Billion)
- Figure 15.1 Voluntary Carbon Market: Distribution by End-user
- Figure 15.2 Voluntary Carbon Market for Government Agencies / Organizations, Historical Trends (Since 2020) and Forecasted Estimates (Till 2035) (USD Billion)
- Figure 15.3 Voluntary Carbon Market for Non-Profit Organizations, Historical Trends (Since 2020) and Forecasted Estimates (Till 2035) (USD Billion)
- Figure 15.4 Voluntary Carbon Market for Private Companies, Historical Trends (Since 2020) and Forecasted Estimates (Till 2035) (USD Billion)
- Figure 15.5 Voluntary Carbon Market for Individuals, Historical Trends (Since 2020) and Forecasted Estimates (Till 2035) (USD Billion)
- Figure 16.1 Voluntary Carbon Market: Distribution by Geographical Regions
- Figure 16.2 Voluntary Carbon Market in North America, Historical Trends (Since 2020) and Forecasted Estimates (Till 2035) (USD Billion)
- Figure 16.3 Voluntary Carbon Market in the US, Historical Trends (Since 2020) and Forecasted Estimates (Till 2035) (USD Billion)
- Figure 16.4 Voluntary Carbon Market in Canada, Historical Trends (Since 2020) and Forecasted Estimates (Till 2035) (USD Billion)
- Figure 16.5 Voluntary Carbon Market in Europe, Historical Trends (Since 2020) and Forecasted Estimates (Till 2035) (USD Billion)
- Figure 16.6 Voluntary Carbon Market in Germany, Historical Trends (Since 2020) and Forecasted Estimates (Till 2035) (USD Billion)
- Figure 16.7 Voluntary Carbon Market in the France, Historical Trends (Since 2020) and Forecasted Estimates (Till 2035) (USD Billion)
- Figure 16.8 Voluntary Carbon Market in Italy, Historical Trends (Since 2020) and Forecasted Estimates (Till 2035) (USD Billion)
- Figure 16.9 Voluntary Carbon Market in Belgium, Historical Trends (Since 2020) and Forecasted Estimates (Till 2035) (USD Billion)
- Figure 16.10 Voluntary Carbon Market in Austria, Historical Trends (Since 2020) and Forecasted Estimates (Till 2035) (USD Billion)
- Figure 16.11 Voluntary Carbon Market in Spain, Historical Trends (Since 2020) and Forecasted Estimates (Till 2035) (USD Billion)
- Figure 16.12 Voluntary Carbon Market in Netherlands, Historical Trends (Since 2020) and Forecasted Estimates (Till 2035) (USD Billion)
- Figure 16.13 Voluntary Carbon Market in the UK, Historical Trends (Since 2020) and Forecasted Estimates (Till 2035) (USD Billion)
- Figure 16.14 Voluntary Carbon Market in Rest of the Europe, Historical Trends (Since 2020) and Forecasted Estimates (Till 2035) (USD Billion)
- Figure 16.15 Voluntary Carbon Market in Asia-Pacific, Historical Trends (Since 2020) and Forecasted Estimates (Till 2035) (USD Billion)
- Figure 16.16 Voluntary Carbon Market in China, Historical Trends (Since 2020) and Forecasted Estimates (Till 2035) (USD Billion)
- Figure 16.17 Voluntary Carbon Market in India, Historical Trends (Since 2020) and Forecasted Estimates (Till 2035) (USD Billion)
- Figure 16.18 Voluntary Carbon Market in Japan, Historical Trends (Since 2020) and Forecasted Estimates (Till 2035) (USD Billion)
- Figure 16.19 Voluntary Carbon Market in Indonesia, Historical Trends (Since 2020) and Forecasted Estimates (Till 2035) (USD Billion)
- Figure 16.20 Voluntary Carbon Market in South Korea, Historical Trends (Since 2020) and Forecasted Estimates (Till 2035) (USD Billion)
- Figure 16.21 Voluntary Carbon Market in Australia, Historical Trends (Since 2020) and Forecasted Estimates (Till 2035) (USD Billion)
- Figure 16.22 Voluntary Carbon Market in Rest of the Asia-Pacific, Historical Trends (Since 2020) and Forecasted Estimates (Till 2035) (USD Billion)
- Figure 16.23 Voluntary Carbon Market in Latin America, Historical Trends (Since 2020) and Forecasted Estimates (Till 2035) (USD Billion)
- Figure 16.24 Voluntary Carbon Market in Argentina, Historical Trends (Since 2020) and Forecasted Estimates (Till 2035) (USD Billion)
- Figure 16.25 Voluntary Carbon Market in Brazil, Historical Trends (Since 2020) and Forecasted Estimates (Till 2035) (USD Billion)
- Figure 16.26 Voluntary Carbon Market in Mexico, Historical Trends (Since 2020) and Forecasted Estimates (Till 2035) (USD Billion)
- Figure 16.27 Voluntary Carbon Market in Rest of Latin America, Historical Trends (Since 2020) and Forecasted Estimates (Till 2035) (USD Billion)
- Figure 16.28 Voluntary Carbon Market in Middle East and Africa, Historical Trends (Since 2020) and Forecasted Estimates (Till 2035) (USD Billion)
- Figure 16.29 Voluntary Carbon Market in Iran, Historical Trends (Since 2020) and Forecasted Estimates (Till 2035) (USD Billion)
- Figure 16.30 Voluntary Carbon Market in Saudi Arabia, Historical Trends (Since 2020) and Forecasted Estimates (Till 2035) (USD Billion)
- Figure 16.31 Voluntary Carbon Market in UAE, Historical Trends (Since 2020) and Forecasted Estimates (Till 2035) (USD Billion)
- Figure 16.32 Voluntary Carbon Market in Israel, Historical Trends (Since 2020) and Forecasted Estimates (Till 2035) (USD Billion)
- Figure 16.33 Voluntary Carbon Market in South Africa, Historical Trends (Since 2020) and Forecasted Estimates (Till 2035) (USD Billion)
- Figure 16.34 Voluntary Carbon Market in Kuwait, Historical Trends (Since 2020) and Forecasted Estimates (Till 2035) (USD Billion)
- Figure 16.35 Voluntary Carbon Market in Oman, Historical Trends (Since 2020) and Forecasted Estimates (Till 2035) (USD Billion)
- Figure 16.36 Voluntary Carbon Market in Rest of the Middle East and Africa, Historical Trends (Since 2020) and Forecasted Estimates (Till 2035) (USD Billion)
- Figure 16.37 Penetration Growth (P-G) Matrix: Geographical Regions
- Figure 16.38 Market Movement Analysis: Geographical Regions

