
PUBLISHER: Roots Analysis | PRODUCT CODE: 1869574

PUBLISHER: Roots Analysis | PRODUCT CODE: 1869574
Biologics Fill Finish Manufacturing Market: Industry Trends and Global Forecasts, Till 2035 - Distribution by Primary Packaging Container, Biologic Manufactured, Operation, Therapeutic Area, End User, Geographical Regions and Leading Players
BIOLOGICS FILL FINISH MANUFACTURING MARKET: OVERVIEW
As per Roots Analysis, the global biologics fill finish manufacturing market is estimated to grow from USD 4.4 billion in the current year to USD 8.4 billion by 2035, at a CAGR of 6.72% during the forecast period, till 2035.
The market sizing and opportunity analysis has been segmented across the following parameters:
Type of Primary Packaging Container
- Vials
- Syringes
- Ampoules
- Cartridges
Type of Biologic Manufactured
- Antibodies
- Recombinant Proteins
- Vaccines
- Cell Therapies
- Gene Therapies
- Nucleic Acids / Oligonucleotides
- Other Biologics
Scale of Operation
- Commercial
- Preclinical / Clinical
Therapeutic Area
- Oncological Disorders
- Cardiovascular Disorders
- Metabolic Diseases
- Infectious Diseases
- Autoimmune Disorders
- Other Disorders
End User
- Pharmaceutical / Biopharmaceutical Companies
- Contract Manufacturing Organizations / Others
Type of Player
- Industry
- Non-industry
Company Size
- Large Companies
- Mid-sized Companies
- Small Companies
Geographical Regions
- North America
- Europe
- Asia-Pacific
- Middle East and North Africa
- Latin America
BIOLOGICS FILL FINISH MANUFACTURING MARKET: GROWTH AND TRENDS
Biologics are complex therapeutic molecules comprising of various biomolecules, such as carbohydrates, proteins, nucleic acids or a combination of these substances. These drugs are typically obtained from living cells and are very responsive to different environmental factors, such as light, temperature, pH and oxygen levels. As a result, the production of these molecules is quite complex and necessitates advanced manufacturing processes, such as fermentation, sterile fill finish, and adequate storage with controlled temperatures.
Significantly, the fill finish of biologics is an essential phase in the downstream processing of biopharmaceuticals, wherein specific handling protocols must be followed in order to maintain the product's sterility during filling in final packaging containers (such as ampoules, cartridges, prefilled syringes, and vials). Also, any inconsistencies reported in production may lead to microbial contamination. This results in product loss, extended development schedules, and significant financial strain on drug developers.
Due to such complexities and challenges related to the fill / finish of biologics, more drug developers are shifting their focus towards contract manufacturing organizations (CMOs) and contract development and manufacturing organizations (CDMOs) for outsourcing their fill finish processes. It is important to mention that over 25% of pharmaceutical developers choose to outsource the fill finish processes. This increased trend of outsourcing in this sector can be attributed to the capability of biologics fill finish manufacturing firms having the required skills and advanced facilities with clean rooms, which are crucial for lowering contamination risks and ensuring accurate filling while decreasing product loss rates.
In addition, CMOs leverage cutting-edge technologies (such as automation, robotics and incorporation of artificial intelligence) that assist in enhancing the filling process, boosting yield, and adhering to quality standards, thereby accelerating the speed to reach the market and minimizing any potential risk of the product. Therefore, the growing demand for biologics along with technological advancements to improve the efficiency of fill finish process are likely to be the key drivers in the biologics fill finish manufacturing sector, contributing significantly to the market growth, during the forecast period.
BIOLOGICS FILL FINISH MANUFACTURING MARKET: KEY INSIGHTS
The report delves into the current state of the biologics fill finish manufacturing market and identifies potential growth opportunities within industry. Some key findings from the report include:
- Presently, close to 255 service providers are engaged in offering fill / finish services for various biologic drugs; of these, over 30% of the service providers are headquartered in the US.
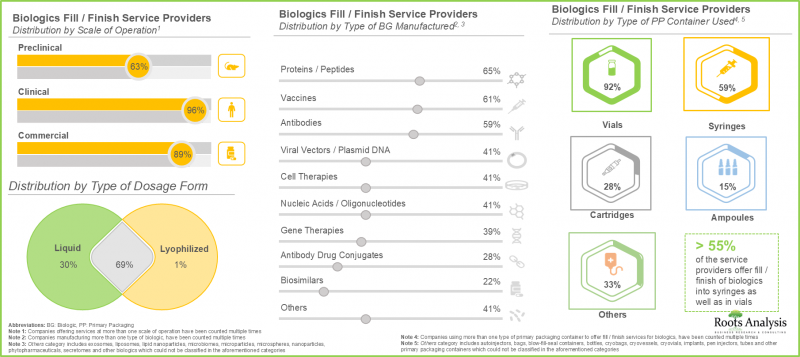
- Over 55% of the service providers operate at all scales of operation to cater to the diverse fill / finish requirements of their clients; notably, vials have emerged as the most adopted primary packaging container.
- In pursuit of gaining a competitive edge and to meet the evolving industry standards, stakeholders are actively enhancing their existing capabilities by improving their respective biologics fill / finish service portfolios.
- More than 30% of the deals inked in this domain are acquisitions; of these, majority of the agreements were intracontinental deals signed by the stakeholders to strengthen their regional footprint.
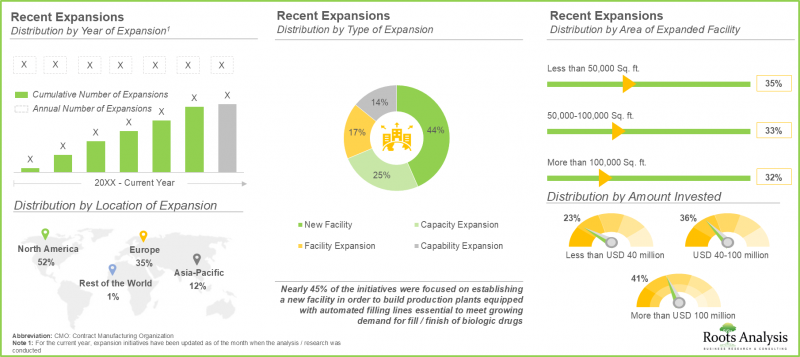
- Driven by the growing demand for biologics, CMOs have made considerable investments to expand their existing capacities and capabilities; with over 50% expansions, this trend is most pronounced in the US.
- The global installed biologics fill / finish capacity is well distributed across various geographies; interestingly, close to 80% of the total installed capacity is available in facilities owned by large and very large players.
- Given the growing pipeline of biologic drug products, the demand for fill / finish services has upsurged; by 2035, the demand is expected to grow at a CAGR of 12.11% over the next decade.
- Given the rapid increase in the demand of biologics for the treatment of chronic conditions, the biologics fill / finish manufacturing market is poised to grow at a CAGR of 6.72% till 2035.
- Large CMOs are likely to generate majority of the revenues in the biologics fill / finish domain; further, fill / finish market for biologics used in treatment of autoimmune disorders is anticipated to grow at a faster pace till 2035.
- Driven by numerous tangible factors, such as the presence of a large number of CMOs and easy access to advanced fill / finish technologies, the biologics fill / finish market in the US is likely to grow at CAGR of 5.18%.
BIOLOGICS FILL FINISH MANUFACTURING MARKET: KEY SEGMENTS
Contract Manufacturing Market for API is Likely to Dominate the Biologics Fill Finish Manufacturing Market During the Forecast Period
Based on the type of service(s) offered, the market is segmented into API and FDF. It is worth highlighting that majority of the current biologics fill finish manufacturing market is captured by APIs. This can be attributed to the fact that manufacturing of biopharmaceuticals API demand significant capital investments, which include facility costs (development and maintenance), material costs, labor costs and a number of other ancillary expenses. Therefore, stakeholders rely on the expertise of CMOs for API production.
Cell Therapies is the Fastest Growing Segment of the Biologics Fill Finish Manufacturing Market During the Forecast Period
Based on the type of biologic manufactured, the market is segmented into antibodies, cell therapies, vaccines and other biologics. It is worth highlighting the antibodies capture the maximum share within the biopharmaceutical contract manufacturing market. This can be attributed to the fact that more than 100 antibodies have been approved across the globe and an increasing number of clinical trials related to antibodies are also underway.
Mammalian Expression System is Expected to Capture the Highest Share of the Biologics Fill Finish Manufacturing Market During the Forecast Period
Based on the type of expression system used, the market is segmented into mammalian, microbial and others. It is worth highlighting that currently, the market is likely to be driven by revenues generated through biopharmaceutical projects employing mammalian expression systems. This can be attributed to the higher usage of such systems owing to their high protein yielding ability, enhanced folding and post-translational modifications, and improved batch-to-batch uniformity.
By Scale of Operation, Commercial Scale is Likely to Dominate the Biologics Fill Finish Manufacturing Market During the Forecast Period
Based on the scale of operation, the market is segmented into preclinical / clinical and commercial scale. Whilst commercial scale manufacturing is projected to be the primary driver of the overall market, it is worth highlighting that the biologics manufacturing market at preclinical / clinical scale is likely to grow at a relatively higher CAGR.
Large and Very Large Companies Hold Maximum Share within the Biologics Manufacturing Market
Based on company size, the market is segmented into small companies, mid-sized, and large and very large companies. While large and very large companies account for a relatively higher market share, it is worth highlighting that the Biologics Fill Finish Manufacturing Market for small companies is likely to witness substantial market growth in the coming years.
North America Accounts for the Largest Share of the Market
Based on key geographical regions, the market is segmented into North America, Europe, Asia-Pacific, Middle East and North Africa, and Latin America. It is worth highlighting that over the years, the market in Asia-Pacific is expected to grow at a higher CAGR.
Example Players in the Biologics Fill Finish Manufacturing Market
- AbbVie Contract Manufacturing
- Alcami
- Asymchem
- Boehringer Ingelheim BioXcellence
- Bushu Pharmaceuticals
- Catalent Biologics
- Cenexi
- Charles River
- CordenPharma
- Curia
- Elements Material Technology
- Evonik
- Fareva
- Fresenius Kabi
- Grand River Aseptic Manufacturing
- GSK
- Hetero
- Lifecore Biomedical
- Lonza
- Northway Biotechpharma
- Novocol Pharma
- Patheon pharma services
- Pharmaceutics International (Pii)
- Rechon Life Science
- Recipharm
- Syngene
- WACKER
- WuXi Biologics
Primary Research Overview
The opinions and insights presented in this study were influenced by discussions conducted with multiple stakeholders. The research report features detailed transcripts of interviews held with the following industry stakeholders:
- Senior Director Drug Product Sales, Large Company, US
- Business Development Manager, Mid-sized Company, Netherlands
- Marketing Specialist, Mid-sized Company, Poland
- Vice President and Head of Formulations, Very Large Company, India
- Former Vice President, Business Development and Marketing, Mid-sized Company, US
- Former Technology Watch Manager, Mid-sized Company, France
- Head of Business Development, Mid-sized Company, Czech Republic
- Former Chief Commercial Officer, Large Company, Germany
- Former Global Business Development Manager, Mid-sized Company, Netherlands
BIOLOGICS FILL FINISH MANUFACTURING MARKET: RESEARCH COVERAGE
- Market Sizing and Opportunity Analysis: The report features a thorough analysis of the global biologics fill finish manufacturing market, in terms of the key market segments, including [A] type of primary packaging container, [B] type of biologic manufactured, [C] scale of operation, [D] therapeutic area, [E] end user, [F] type of player, [G] Company Size, and [H] geographical regions.
- Market Landscape: An in-depth assessment of the companies involved in biologics fill finish manufacturing market, based on several relevant parameters, such as [A] year of establishment, [B] company size, [C] location of headquarters, [D] location of fill / finish facilities , [E] scale of operation [F] type of biologic manufactured, [G] presence of cytostatic or cytotoxic or highly potent substance filling capability, [H] type of dosage form [I] type of primary packaging container used and [J] additional services offered.
- Company Competitive Analysis: A comprehensive analysis of biologics fill / finish service providers based across the key geographical regions, such as [A] North America [B] Europe and [C] Asia-Pacific, and rest of the world.
- Company Profiles: Detailed profiles of key service providers across North America, Europe and Asia-Pacific engaged in the biologics fill finish manufacturing market, focused on parameters such as [A] company overview, [B] financial information (if available), [C] service portfolio, [D] manufacturing facilities and [E] recent developments and an informed future outlook.
- Partnerships and Collaborations: An in-depth analysis of the partnership's activity reported in this domain, based on parameters such as [A] year of partnership, [B] type of partnership [C] scale of operation, and [D] type of partner company.
- Recent Expansions: A detailed analysis of expansion initiatives undertaken by biologics fill finish service provider, during the period along with information on several relevant parameters, such as [A] year of expansion, [B] type of expansion, [C] area of expanded facility and [D] scale of operation.
- Strategic Outsourcing in Biopharmaceutical Fill / Finish Operations: A comprehensive framework to evaluate the capability gaps within the biologics fill finish manufacturing market highlighting information on the key trends observed across [A] small companies [B] mid-sized companies, [C] large companies and [D] very large companies.
- Capacity Analysis: An estimate of the overall installed capacity for the manufacturing of biologics, highlighting the distribution of the available capacity, based on [A] biologics fill / finish capacity for ampoules, [B] biologics fill / finish capacity for cartridges and [C] biologics fill / finish capacity for syringes, [D] biologics fill / finish capacity for vials.
- Demand Analysis: An informed estimate of the annual demand for biologics, based on various relevant parameters, such as [A] scale of operation, [B] type of primary packaging container used and [C] geography.
- Regional Capability Analysis: A detailed regional analysis of biologics fill finish manufacturers based on various parameters across [A] North America, [B] Europe, [C] Asia-Pacific and rest of the World.
KEY QUESTIONS ANSWERED IN THIS REPORT
- How many companies are currently engaged in this market?
- Which are the leading companies in this market?
- What factors are likely to influence the evolution of this market?
- What is the current and future market size?
- What is the CAGR of this market?
- How is the current and future market opportunity likely to be distributed across key market segments?
REASONS TO BUY THIS REPORT
- The report provides a comprehensive market analysis, offering detailed revenue projections of the overall market and its specific sub-segments. This information is valuable to both established market leaders and emerging entrants.
- Stakeholders can leverage the report to gain a deeper understanding of the competitive dynamics within the market. By analyzing the competitive landscape, businesses can make informed decisions to optimize their market positioning and develop effective go-to-market strategies.
- The report offers stakeholders a comprehensive overview of the market, including key drivers, barriers, opportunities, and challenges. This information empowers stakeholders to stay abreast of market trends and make data-driven decisions to capitalize on growth prospects.
ADDITIONAL BENEFITS
- Complimentary PPT Insights Packs
- Complimentary Excel Data Packs for all Analytical Modules in the Report
- 15% Free Content Customization
- Detailed Report Walkthrough Session with Research Team
- Free Updated report if the report is 6-12 months old or older
TABLE OF CONTENTS
SECTION I: REPORT OVERVIEW
1. PREFACE
- 1.1. Introduction
- 1.2. Market Share Insights
- 1.3. Key Market Insights
- 1.4. Report Coverage
- 1.5. Key Questions Answered
- 1.6. Chapter Outlines
2. RESEARCH METHODOLOGY
- 2.1. Chapter Overview
- 2.2. Research Assumptions
- 2.2.1. Market Landscape and Market Trends
- 2.2.2. Market Forecast and Opportunity Analysis
- 2.2.3. Comparative Analysis
- 2.3. Database Building
- 2.3.1. Data Collection
- 2.3.2. Data Validation
- 2.3.3. Data Analysis
- 2.4. Project Methodology
- 2.4.1. Secondary Research
- 2.4.1.1. Annual Reports
- 2.4.1.2. Academic Research Papers
- 2.4.1.3. Company Websites
- 2.4.1.4. Investor Presentations
- 2.4.1.5. Regulatory Filings
- 2.4.1.6. White Papers
- 2.4.1.7. Industry Publications
- 2.4.1.8. Conferences and Seminars
- 2.4.1.9. Government Portals
- 2.4.1.10. Media and Press Releases
- 2.4.1.11. Newsletters
- 2.4.1.12. Industry Databases
- 2.4.1.13. Roots Proprietary Databases
- 2.4.1.14. Paid Databases and Sources
- 2.4.1.15. Social Media Portals
- 2.4.1.16. Other Secondary Sources
- 2.4.2. Primary Research
- 2.4.2.1. Types of Primary Research
- 2.4.2.1.1. Qualitative Research
- 2.4.2.1.2. Quantitative Research
- 2.4.2.1.3. Hybrid Approach
- 2.4.2.2. Advantages of Primary Research
- 2.4.2.3. Techniques for Primary Research
- 2.4.2.3.1. Interviews
- 2.4.2.3.2. Surveys
- 2.4.2.3.3. Focus Groups
- 2.4.2.3.4. Observational Research
- 2.4.2.3.5. Social Media Interactions
- 2.4.2.4. Key Opinion Leaders Considered in Primary Research
- 2.4.2.4.1. Company Executives (CXOs)
- 2.4.2.4.2. Board of Directors
- 2.4.2.4.3. Company Presidents and Vice Presidents
- 2.4.2.4.4. Research and Development Heads
- 2.4.2.4.5. Technical Experts
- 2.4.2.4.6. Subject Matter Experts
- 2.4.2.4.7. Scientists
- 2.4.2.4.8. Doctors and Other Healthcare Providers
- 2.4.2.5. Ethics and Integrity
- 2.4.2.5.1. Research Ethics
- 2.4.2.5.2. Data Integrity
- 2.4.2.1. Types of Primary Research
- 2.4.3. Analytical Tools and Databases
- 2.4.1. Secondary Research
- 2.5. Robust Quality Control
3. MARKET DYNAMICS
- 3.1. Chapter Overview
- 3.2. Forecast Methodology
- 3.2.1. Top-down Approach
- 3.2.2. Bottom-up Approach
- 3.2.3. Hybrid Approach
- 3.3. Market Assessment Framework
- 3.3.1. Total Addressable Market (TAM)
- 3.3.2. Serviceable Addressable Market (SAM)
- 3.3.3. Serviceable Obtainable Market (SOM)
- 3.3.4. Currently Acquired Market (CAM)
- 3.4. Forecasting Tools and Techniques
- 3.4.1. Qualitative Forecasting
- 3.4.2. Correlation
- 3.4.3. Regression
- 3.4.4. Extrapolation
- 3.4.5. Convergence
- 3.4.6. Sensitivity Analysis
- 3.4.7. Scenario Planning
- 3.4.8. Data Visualization
- 3.4.9. Time Series Analysis
- 3.4.10. Forecast Error Analysis
- 3.5. Key Considerations
- 3.5.1. Demographics
- 3.5.2. Government Regulations
- 3.5.3. Reimbursement Scenarios
- 3.5.4. Market Access
- 3.5.5. Supply Chain
- 3.5.6. Industry Consolidation
- 3.5.7. Pandemic / Unforeseen Disruptions Impact
- 3.6. Limitations
4. MACRO-ECONOMIC INDICATORS
- 4.1. Chapter Overview
- 4.2. Market Dynamics
- 4.2.1. Time Period
- 4.2.1.1. Historical Trends
- 4.2.1.2. Current and Forecasted Estimates
- 4.2.2. Currency Coverage
- 4.2.2.1. Major Currencies Affecting the Market
- 4.2.2.2. Factors Affecting Currency Fluctuations
- 4.2.2.3. Impact of Currency Fluctuations on the Industry
- 4.2.3. Foreign Currency Exchange Rate
- 4.2.3.1. Impact of Foreign Exchange Rate Volatility on the Market
- 4.2.3.2. Strategies for Mitigating Foreign Exchange Risk
- 4.2.4. Recession
- 4.2.4.1. Assessment of Current Economic Conditions and Potential Impact on the Market
- 4.2.4.2. Historical Analysis of Past Recessions and Lessons Learnt
- 4.2.5. Inflation
- 4.2.5.1. Measurement and Analysis of Inflationary Pressures in the Economy
- 4.2.5.2. Potential Impact of Inflation on the Market Evolution
- 4.2.6. Interest Rates
- 4.2.6.1. Interest Rates and Their Impact on the Market
- 4.2.6.2. Strategies for Managing Interest Rate Risk
- 4.2.7. Commodity Flow Analysis
- 4.2.7.1. Type of Commodity
- 4.2.7.2. Origins and Destinations
- 4.2.7.3. Value and Weights
- 4.2.7.4. Modes of Transportation
- 4.2.8. Global Trade Dynamics
- 4.2.8.1. Import Scenario
- 4.2.8.2. Export Scenario
- 4.2.8.3. Trade Policies
- 4.2.8.4. Strategies for Mitigating the Risks Associated with Trade Barriers
- 4.2.8.5. Impact of Trade Barriers on the Market
- 4.2.9. War Impact Analysis
- 4.2.9.1. Russian-Ukraine War
- 4.2.9.2. Israel-Hamas War
- 4.2.10. COVID Impact / Related Factors
- 4.2.10.1. Global Economic Impact
- 4.2.10.2. Industry-specific Impact
- 4.2.10.3. Government Response and Stimulus Measures
- 4.2.10.4. Future Outlook and Adaptation Strategies
- 4.2.11. Other Indicators
- 4.2.11.1. Fiscal Policy
- 4.2.11.2. Consumer Spending
- 4.2.11.3. Gross Domestic Product (GDP)
- 4.2.11.4. Employment
- 4.2.11.5. Taxes
- 4.2.11.6. Stock Market Performance
- 4.2.11.7. Cross-Border Dynamics
- 4.2.1. Time Period
- 4.3. Conclusion
SECTION II: QUALITATIVE INSIGHTS
5. EXECUTIVE SUMMARY
6. INTRODUCTION
- 6.1. Chapter Overview
- 6.2. Introduction to Biologics
- 6.3. Need for Outsourcing Biologics-related Operations
- 6.4. Role of Contract Manufacturers in the Biopharmaceutical Industry
- 6.5. Commonly Outsourced Operations in the Biopharmaceutical Industry
- 6.5.1. Biologics Fill / Finish Operations
- 6.6. Key Considerations while Selecting a Fill / Finish Service Provider
- 6.7. Advantages of Outsourcing Fill / Finish Operations
- 6.8. Risks and Challenges associated with Outsourcing Fill / Finish Operations
- 6.9. Conclusion
SECTION III: MARKET OVERVIEW
7. MARKET LANDSCAPE
- 7.1. Chapter Overview
- 7.2. Biologics Fill / Finish Service Providers: Overall Market Landscape
- 7.2.1. Analysis by Year of Establishment
- 7.2.2. Analysis by Company Size
- 7.2.3. Analysis by Location of Headquarters
- 7.2.4. Analysis by Location of Fill / Finish Facilities
- 7.2.5. Analysis by Scale of Operation
- 7.2.6. Analysis by Type of Biologic Manufactured
- 7.2.7. Analysis by Presence of Cytostatic or Cytotoxic or Highly Potent Substance Filling Capability
- 7.2.8. Analysis by Type of Dosage Form
- 7.2.9. Analysis by Type of Primary Packaging Container Used
- 7.2.10. Analysis by Additional Services Offered
8. COMPANY COMPETITIVENESS ANALYSIS
- 8.1. Chapter Overview
- 8.2. Assumptions and Key Parameters
- 8.3. Methodology
- 8.4. Overview of Peer Groups
- 8.5. Biologics Fill / Finish Service Providers: Company Competitiveness Analysis
- 8.5.1. Biologics Fill / Finish Service Providers based in North America (Peer Group I)
- 8.5.2. Biologics Fill / Finish Service Providers based in Europe (Peer Group II)
- 8.5.3. Biologics Fill / Finish Service Providers based in Asia-Pacific and Rest of the World (Peer Group III)
SECTION IV: COMPANY PROFILES
9. COMPANY PROFILES: BIOLOGICS FILL / FINISH SERVICE PROVIDERS IN NORTH AMERICA
- 9.1. Chapter Overview
- 9.2. AbbVie Contract Manufacturing
- 9.2.1. Company Overview
- 9.2.2. Financial Information
- 9.2.3. Biologics Fill / Finish Service Portfolio
- 9.2.4. Recent Developments and Future Outlook
- 9.3. Alcami
- 9.4. Catalent Biologics
- 9.5. Charles River
- 9.6. Curia
- 9.7. Grand River Aseptic Manufacturing
- 9.8. Lifecore Biomedical
- 9.9. Novocol Pharma
- 9.10. Patheon pharma services
- 9.11. Pharmaceutics International (Pii)
10. COMPANY PROFILES: BIOLOGICS FILL / FINISH SERVICE PROVIDERS IN EUROPE
- 10.1. Chapter Overview
- 10.2. Boehringer Ingelheim BioXcellence
- 10.2.1. Company Overview
- 10.2.2. Financial Information
- 10.2.3. Biologics Fill / Finish Service Portfolio
- 10.2.4. Recent Developments and Future Outlook
- 10.3. Cenexi
- 10.4. CordenPharma
- 10.5. Element Materials Technology
- 10.6. Evonik
- 10.7. Fareva
- 10.8. Fresenius Kabi
- 10.9. GSK
- 10.10. Lonza
- 10.11. Northway Biotechpharma
- 10.12. Rechon Life Science
- 10.13. Recipharm
- 10.14. WACKER
11. COMPANY PROFILES: BIOLOGICS FILL / FINISH SERVICE PROVIDERS IN ASIA-PACIFIC
- 11.1. Chapter Overview
- 11.2. Asymchem
- 11.2.1. Company Overview
- 11.2.2. Financial Information
- 11.2.3. Biologics Fill / Finish Service Portfolio
- 11.2.4. Recent Developments and Future Outlook
- 11.3. Bushu Pharmaceuticals
- 11.4. Hetero
- 11.5. Syngene
- 11.6. WuXi Biologics
SECTION V: MARKET TRENDS
12. PARTNERSHIPS AND COLLABORATIONS
- 12.1. Chapter Overview
- 12.2. Partnership Models
- 12.3. Biologics Fill / Finish Service Providers: Partnerships and Collaborations
- 12.3.1. Analysis by Year of Partnership
- 12.3.2. Analysis by Type of Partnership
- 12.3.3. Analysis by Year and Type of Partnership
- 12.3.4. Analysis by Scale of Operation
- 12.3.5. Analysis by Type of Partner Company
- 12.3.6. Most Active Players: Analysis by Number of Partnerships
- 12.3.7. Analysis by Geography
- 12.3.7.1. Local and International Agreements
- 12.3.7.2. Intracontinental and Intercontinental Agreements
13. RECENT EXPANSIONS
- 13.1. Chapter Overview
- 13.2. Expansion Models
- 13.3. Biologics Fill / Finish Service Providers: Recent Expansions
- 13.3.1. Analysis by Year of Expansion
- 13.3.2. Analysis by Type of Expansion
- 13.3.3. Analysis by Year and Type of Expansion
- 13.3.4. Analysis by Location of Expanded Facility
- 13.3.5. Analysis by Type of Expansion and Location of Expanded Facility
- 13.3.6. Analysis by Area of Expanded Facility
- 13.3.7. Analysis by Scale of Operation
- 13.3.8. Analysis by Type of Primary Packaging Container Used
- 13.3.9. Analysis by Type of Expansion and Type of Primary Packaging Container Used
- 13.3.10. Analysis by Amount Invested
- 13.3.11. Most Active Players: Analysis by Number of Expansion Initiatives
14. STRATEGIC OUTSOURCING IN BIOPHARMACEUTICAL FILL / FINISH OPERATIONS: EVALUATING THE CAPABILITY GAPS
- 14.1. Chapter Overview
- 14.2. Scope and Methodology
- 14.3. Key Insights
- 14.3.1. Trends Observed across Small Companies
- 14.3.2. Trends Observed across Mid-sized Companies
- 14.3.3. Trends Observed across Large Companies
- 14.3.4. Trends Observed across Very Large Companies
- 14.4. Conclusion
15. CAPACITY ANALYSIS
- 15.1. Chapter Overview
- 15.2. Global Installed Biologics Fill / Finish Capacity for Ampoules (Number of Units / Batch)
- 15.2.1. Key Assumptions and Methodologies
- 15.2.2. Analysis by Company Size
- 15.2.3. Analysis by Geography
- 15.2.3.1. Analysis of Biologics Fill / Finish Capacity for Ampoules in North America
- 15.2.3.2. Analysis of Biologics Fill / Finish Capacity for Ampoules in Europe
- 15.2.3.3. Analysis of Biologics Fill / Finish Capacity for Ampoules in Asia-Pacific
- 15.2.3.4. Analysis of Biologics Fill / Finish Capacity for Ampoules in Rest of the World
- 15.3. Global Installed Biologics Fill / Finish Capacity for Cartridges (Number of Units / Batch)
- 15.3.1. Key Assumptions and Methodologies
- 15.3.2. Analysis by Company Size
- 15.3.3. Analysis by Geography
- 15.3.3.1. Analysis of Biologics Fill / Finish Capacity for Cartridges in North America
- 15.3.3.2. Analysis of Biologics Fill / Finish Capacity for Cartridges in Europe
- 15.3.3.3. Analysis of Biologics Fill / Finish Capacity for Cartridges in Asia-Pacific
- 15.3.3.4. Analysis of Biologics Fill / Finish Capacity for Cartridges in Rest of the World
- 15.4. Global Installed Biologics Fill / Finish Capacity for Syringes (Number of Units / Batch)
- 15.4.1. Key Assumptions and Methodologies
- 15.4.2. Analysis by Company Size
- 15.4.3. Analysis by Geography
- 15.4.3.1. Analysis of Biologics Fill / Finish Capacity for Syringes in North America
- 15.4.3.2. Analysis of Biologics Fill / Finish Capacity for Syringes in Europe
- 15.4.3.3. Analysis of Biologics Fill / Finish Capacity for Syringes in Asia-Pacific
- 15.4.3.4. Analysis of Biologics Fill / Finish Capacity for Syringes in Rest of the World
- 15.5. Global Installed Biologics Fill / Finish Capacity for Vials (Number of Units / Batch)
- 15.5.1. Key Assumptions and Methodologies
- 15.5.2. Analysis by Company Size
- 15.5.3. Analysis by Geography
- 15.5.3.1. Analysis of Biologics Fill / Finish Capacity for Vials in North America
- 15.5.3.2. Analysis of Biologics Fill / Finish Capacity for Vials in Europe
- 15.5.3.3. Analysis of Biologics Fill / Finish Capacity for Vials in Asia-Pacific
- 15.5.3.4. Analysis of Biologics Fill / Finish Capacity for Vials in Rest of the World
- 15.6. Concluding Remarks
16. DEMAND ANALYSIS
- 16.1. Chapter Overview
- 16.2. Assumptions and Methodology
- 16.3. Global Annual Demand for Biologics Fill / Finish Manufacturing (in Million Liters)
- 16.3.1. Analysis by Scale of Operation
- 16.3.2. Analysis by Type of Primary Packaging Container Used
- 16.3.3. Analysis by Geography
17. REGIONAL CAPABILITY ANALYSIS
- 17.1. Chapter Overview
- 17.2. Key Assumptions and Parameters
- 17.3. Biologics Fill / Finish Manufacturing Capabilities in North America
- 17.4. Biologics Fill / Finish Manufacturing Capabilities in Europe
- 17.5. Biologics Fill / Finish Manufacturing Capabilities in Asia-Pacific and Rest of the World
SECTION VI: MARKET OPPORTUNITY ANALYSIS
18. MARKET IMPACT ANALYSIS
- 18.1. Chapter Overview
- 18.2. Market Drivers
- 18.3. Market Restraints
- 18.4. Market Opportunities
- 18.5. Market Challenges
- 18.6. Conclusion
19. GLOBAL BIOLOGICS FILL / FINISH MANUFACTURING MARKET
- 19.1. Chapter Overview
- 19.2. Key Assumptions and Methodology
- 19.3. Global Biologics Fill / Finish Manufacturing Market, Forecasted Estimates, Till 2035
- 19.3.1. Roots Analysis Perspective on Market Growth
- 19.3.2. Multivariate Scenario Analysis
- 19.3.2.1. Conservative Scenario
- 19.3.2.2. Optimistic Scenario
- 19.4. Key Market Segmentations
20. BIOLOGICS FILL / FINISH MANUFACTURING MARKET, BY TYPE OF PRIMARY PACKAGING CONTAINER USED
- 20.1. Chapter Overview
- 20.2. Key Assumptions and Methodology
- 20.3. Biologics Fill / Finish Manufacturing Market: Distribution by Type of Primary Packaging Container Used
- 20.3.1. Biologics Fill / Finish Manufacturing Market for Vials, Historical Trends (since 2018) and Forecasted Estimates (till 2035)
- 20.3.2. Biologics Fill / Finish Manufacturing Market for Syringes, Historical Trends (since 2018) and Forecasted Estimates (till 2035)
- 20.3.3. Biologics Fill / Finish Manufacturing Market for Ampoules, Historical Trends (since 2018) and Forecasted Estimates (till 2035)
- 20.3.4. Biologics Fill / Finish Manufacturing Market for Cartridges, Historical Trends (since 2018) and Forecasted Estimates (till 2035)
- 20.4. Biologics Fill / Finish Manufacturing Market, by Type of Primary Packaging Container Used: Market Dynamics Assessment
- 20.4.1. Market Movement Analysis
- 20.4.2. Penetration-Growth (P-G) Matrix
- 20.5. Data Triangulation and Validation
21. BIOLOGICS FILL / FINISH MANUFACTURING MARKET, BY TYPE OF BIOLOGIC MANUFACTURED
- 21.1. Chapter Overview
- 21.2. Key Assumptions and Methodology
- 21.3. Biologics Fill / Finish Manufacturing Market: Distribution by Type of Biologic Manufactured
- 21.3.1. Biologics Fill / Finish Manufacturing Market for Antibodies, Historical Trends (since 2018) and Forecasted Estimates (till 2035)
- 21.3.2. Biologics Fill / Finish Manufacturing Market for Recombinant Proteins, Historical Trends (since 2018) and Forecasted Estimates (till 2035)
- 21.3.3. Biologics Fill / Finish Manufacturing Market for Vaccines, Historical Trends (since 2018) and Forecasted Estimates (till 2035)
- 21.3.4. Biologics Fill / Finish Manufacturing Market for Cell Therapies, Historical Trends (since 2018) and Forecasted Estimates (till 2035)
- 21.3.5. Biologics Fill / Finish Manufacturing Market for Gene Therapies, Historical Trends (since 2018) and Forecasted Estimates (till 2035)
- 21.3.6. Biologics Fill / Finish Manufacturing Market for Nucleic Acids / Oligonucleotides, Historical Trends (since 2018) and Forecasted Estimates (till 2035)
- 21.3.7. Biologics Fill / Finish Manufacturing Market for Other Biologics, Historical Trends (since 2018) and Forecasted Estimates (till 2035)
- 21.4. Data Triangulation and Validation
22. BIOLOGICS FILL / FINISH MANUFACTURING MARKET, BY SCALE OF OPERATION
- 22.1. Chapter Overview
- 22.2. Key Assumptions and Methodology
- 22.3. Biologics Fill / Finish Manufacturing Market: Distribution by Scale of Operation
- 22.3.1. Biologics Fill / Finish Manufacturing Market for Commercial Scale, Historical Trends (since 2018) and Forecasted Estimates (till 2035)
- 22.3.2. Biologics Fill / Finish Manufacturing Market for Preclinical / Clinical Scale, Historical Trends (since 2018) and Forecasted Estimates (till 2035)
- 22.4. Data Triangulation and Validation
23. BIOLOGICS FILL / FINISH MANUFACTURING MARKET, BY THERAPEUTIC AREA
- 23.1. Chapter Overview
- 23.2. Key Assumptions and Methodology
- 23.3. Biologics Fill / Finish Manufacturing Market: Distribution by Therapeutic Area
- 23.3.1. Biologics Fill / Finish Manufacturing Market for Oncological Disorders, Historical Trends (since 2018) and Forecasted Estimates (till 2035)
- 23.3.2. Biologics Fill / Finish Manufacturing Market for Cardiovascular Disorders, Historical Trends (since 2018) and Forecasted Estimates (till 2035)
- 23.3.3. Biologics Fill / Finish Manufacturing Market for Metabolic Disorders, Historical Trends (since 2018) and Forecasted Estimates (till 2035)
- 23.3.4. Biologics Fill / Finish Manufacturing Market for Infectious Diseases, Historical Trends (since 2018) and Forecasted Estimates (till 2035)
- 23.3.5. Biologics Fill / Finish Manufacturing Market for Autoimmune Disorders, Historical Trends (since 2018) and Forecasted Estimates (till 2035)
- 23.3.6. Biologics Fill / Finish Manufacturing Market for Other Disorders, Historical Trends (since 2018) and Forecasted Estimates (till 2035)
- 23.4. Data Triangulation and Validation
24. BIOLOGICS FILL / FINISH MANUFACTURING MARKET, BY END USER
- 24.1. Chapter Overview
- 24.2. Key Assumptions and Methodology
- 24.3. Biologics Fill / Finish Manufacturing Market: Distribution by End User
- 24.3.1. Biologics Fill / Finish Manufacturing Market for Pharmaceutical / Biopharmaceutical Companies, Historical Trends (since 2018) and Forecasted Estimates (till 2035)
- 24.3.2. Biologics Fill / Finish Manufacturing Market for Contract Manufacturing Organizations and Others, Historical Trends (since 2018) and Forecasted Estimates (till 2035)
- 24.4. Data Triangulation and Validation
25. BIOLOGICS FILL / FINISH MANUFACTURING MARKET, BY TYPE OF PLAYER
- 25.1. Chapter Overview
- 25.2. Key Assumptions and Methodology
- 25.3. Biologics Fill / Finish Manufacturing Market: Distribution by Type of Player
- 25.3.1. Biologics Fill / Finish Manufacturing Market for Industry Players, Historical Trends (since 2018) and Forecasted Estimates (till 2035)
- 25.3.2. Biologics Fill / Finish Manufacturing Market for Non-Industry Players, Historical Trends (since 2018) and Forecasted Estimates (till 2035)
- 25.4. Data Triangulation and Validation
26. BIOLOGICS FILL / FINISH MANUFACTURING MARKET, BY COMPANY SIZE
- 26.1. Chapter Overview
- 26.2. Key Assumptions and Methodology
- 26.3. Biologics Fill / Finish Manufacturing Market: Distribution by Company Size
- 26.3.1. Biologics Fill / Finish Manufacturing Market for Large Companies, Historical Trends (since 2018) and Forecasted Estimates (till 2035)
- 26.3.2. Biologics Fill / Finish Manufacturing Market for Mid-sized Companies, Historical Trends (since 2018) and Forecasted Estimates (till 2035)
- 26.3.3. Biologics Fill / Finish Manufacturing Market for Small Companies, Historical Trends (since 2018) and Forecasted Estimates (till 2035)
- 26.4. Data Triangulation and Validation
27. BIOLOGICS FILL / FINISH MANUFACTURING MARKET IN NORTH AMERICA**
- 27.1. Chapter Overview
- 27.2. Key Assumptions and Methodology
- 27.3. Biologics Fill / Finish Manufacturing Market in North America, Historical Trends (since 2018) and Forecasted Estimates (till 2035)
- 27.3.1. Biologics Fill / Finish Manufacturing Market in North America: Distribution by Country
- 27.3.1.1. Biologics Fill / Finish Manufacturing Market in the US, Historical Trends (since 2018) and Forecasted Estimates (till 2035)
- 27.3.1.2. Biologics Fill / Finish Manufacturing Market in Canada, Historical Trends (since 2018) and Forecasted Estimates (till 2035)
- 27.3.1.3. Biologics Fill / Finish Manufacturing Market in Mexico, Historical Trends (since 2018) and Forecasted Estimates (till 2035)
- 27.3.2. Biologics Fill / Finish Manufacturing Market in North America: Distribution by Type of Primary Packaging Container Used
- 27.3.2.1. Biologics Fill / Finish Manufacturing Market in North America for Vials, Historical Trends (since 2018) and Forecasted Estimates (till 2035)
- 27.3.2.2. Biologics Fill / Finish Manufacturing Market in North America for Syringes, Historical Trends (since 2018) and Forecasted Estimates (till 2035)
- 27.3.2.3. Biologics Fill / Finish Manufacturing Market in North America for Ampoules, Historical Trends (since 2018) and Forecasted Estimates (till 2035)
- 27.3.2.4. Biologics Fill / Finish Manufacturing Market in North America for Cartridges, Historical Trends (since 2018) and Forecasted Estimates (till 2035)
- 27.3.3. Biologics Fill / Finish Manufacturing Market in North America: Distribution by Type of Biologic Manufactured
- 27.3.3.1. Biologics Fill / Finish Manufacturing Market in North America for Antibodies, Historical Trends (since 2018) and Forecasted Estimates (till 2035)
- 27.3.3.2. Biologics Fill / Finish Manufacturing Market in North America for Recombinant Proteins, Historical Trends (since 2018) and Forecasted Estimates (till 2035)
- 27.3.3.3. Biologics Fill / Finish Manufacturing Market in North America for Vaccines, Historical Trends (since 2018) and Forecasted Estimates (till 2035)
- 27.3.3.4. Biologics Fill / Finish Manufacturing Market in North America for Cell Therapies, Historical Trends (since 2018) and Forecasted Estimates (till 2035)
- 27.3.3.5. Biologics Fill / Finish Manufacturing Market in North America for Gene Therapies, Historical Trends (since 2018) and Forecasted Estimates (till 2035)
- 27.3.3.6. Biologics Fill / Finish Manufacturing Market in North America for Nucleic Acids / Oligonucleotides, Historical Trends (since 2018) and Forecasted Estimates (till 2035)
- 27.3.3.7. Biologics Fill / Finish Manufacturing Market in North America for Other Biologics, Historical Trends (since 2018) and Forecasted Estimates (till 2035)
- 27.3.4. Biologics Fill / Finish Manufacturing Market in North America: Distribution by Scale of Operation
- 27.3.4.1. Biologics Fill / Finish Manufacturing Market in North America for Commercial Scale, Historical Trends (since 2018) and Forecasted Estimates (till 2035)
- 27.3.4.2. Biologics Fill / Finish Manufacturing Market in North America for Preclinical / Clinical Scale, Historical Trends (since 2018) and Forecasted Estimates (till 2035)
- 27.3.5. Biologics Fill / Finish Manufacturing Market in North America: Distribution by Therapeutic Area
- 27.3.5.1. Biologics Fill / Finish Manufacturing Market in North America for Oncological Disorders, Historical Trends (since 2018) and Forecasted Estimates (till 2035)
- 27.3.5.2. Biologics Fill / Finish Manufacturing Market in North America for Cardiovascular Disorders, Historical Trends (since 2018) and Forecasted Estimates (till 2035)
- 27.3.5.3. Biologics Fill / Finish Manufacturing Market in North America for Metabolic Disorders, Historical Trends (since 2018) and Forecasted Estimates (till 2035)
- 27.3.5.4. Biologics Fill / Finish Manufacturing Market in North America for Infectious Diseases, Historical Trends (since 2018) and Forecasted Estimates (till 2035)
- 27.3.5.5. Biologics Fill / Finish Manufacturing Market in North America for Autoimmune Disorders, Historical Trends (since 2018) and Forecasted Estimates (till 2035)
- 27.3.5.6. Biologics Fill / Finish Manufacturing Market in North America for Other Disorders, Historical Trends (since 2018) and Forecasted Estimates (till 2035)
- 27.3.6. Biologics Fill / Finish Manufacturing Market in North America: Distribution by End User
- 27.3.6.1. Biologics Fill / Finish Manufacturing Market in North America for Pharmaceutical / Biopharmaceutical Companies, Historical Trends (since 2018) and Forecasted Estimates (till 2035)
- 27.3.6.2. Biologics Fill / Finish Manufacturing Market in North America for Contract Manufacturing Organizations and Others, Historical Trends (since 2018) and Forecasted Estimates (till 2035)
- 27.3.7. Biologics Fill / Finish Manufacturing Market in North America: Distribution by Type of Player
- 27.3.7.1. Biologics Fill / Finish Manufacturing Market in North America for Industry Players, Historical Trends (since 2018) and Forecasted Estimates (till 2035)
- 27.3.7.2. Biologics Fill / Finish Manufacturing Market in North America for Non- Industry Players, Historical Trends (since 2018) and Forecasted Estimates (till 2035)
- 27.3.8. Biologics Fill / Finish Manufacturing Market in North America: Distribution by Company Size
- 27.3.8.1. Biologics Fill / Finish Manufacturing Market in North America for Large Companies, Historical Trends (since 2018) and Forecasted Estimates (till 2035)
- 27.3.8.2. Biologics Fill / Finish Manufacturing Market in North America for Mid-sized Companies, Historical Trends (since 2018) and Forecasted Estimates (till 2035)
- 27.3.8.3. Biologics Fill / Finish Manufacturing Market in North America for Small Companies, Historical Trends (since 2018) and Forecasted Estimates (till 2035)
- 27.3.1. Biologics Fill / Finish Manufacturing Market in North America: Distribution by Country
- 27.4. Data Triangulation and Validation
28. BIOLOGICS FILL / FINISH MANUFACTURING MARKET IN EUROPE**
- 28.1. Chapter Overview
- 28.2. Key Assumptions and Methodology
- 28.3. Biologics Fill / Finish Manufacturing Market in Europe, Historical Trends (since 2018) and Forecasted Estimates (till 2035)
- 28.3.1. Biologics Fill / Finish Manufacturing Market in Europe: Distribution by Country
- 28.3.1.1. Biologics Fill / Finish Manufacturing Market in Germany, Historical Trends (since 2018) and Forecasted Estimates (till 2035)
- 28.3.1.2. Biologics Fill / Finish Manufacturing Market in France, Historical Trends (since 2018) and Forecasted Estimates (till 2035)
- 28.3.1.3. Biologics Fill / Finish Manufacturing Market in the UK, Historical Trends (since 2018) and Forecasted Estimates (till 2035)
- 28.3.1.4. Biologics Fill / Finish Manufacturing Market in Switzerland, Historical Trends (since 2018) and Forecasted Estimates (till 2035)
- 28.3.1.5. Biologics Fill / Finish Manufacturing Market in Belgium, Historical Trends (since 2018) and Forecasted Estimates (till 2035)
- 28.3.1.6. Biologics Fill / Finish Manufacturing Market in Italy, Historical Trends (since 2018) and Forecasted Estimates (till 2035)
- 28.3.1.7. Biologics Fill / Finish Manufacturing Market in Austria, Historical Trends (since 2018) and Forecasted Estimates (till 2035)
- 28.3.1.8. Biologics Fill / Finish Manufacturing Market in Spain, Historical Trends (since 2018) and Forecasted Estimates (till 2035)
- 28.3.1.9. Biologics Fill / Finish Manufacturing Market in Netherlands, Historical Trends (since 2018) and Forecasted Estimates (till 2035)
- 28.3.1.10. Biologics Fill / Finish Manufacturing Market in Poland, Historical Trends (since 2018) and Forecasted Estimates (till 2035)
- 28.3.1.11. Biologics Fill / Finish Manufacturing Market in Portugal, Historical Trends (since 2018) and Forecasted Estimates (till 2035)
- 28.3.1.12. Biologics Fill / Finish Manufacturing Market in Rest of Europe, Historical Trends (since 2018) and Forecasted Estimates (till 2035)
- 28.3.2. Biologics Fill / Finish Manufacturing Market in Europe: Distribution by Type of Primary Packaging Container Used
- 28.3.2.1. Biologics Fill / Finish Manufacturing Market in Europe for Vials, Historical Trends (since 2018) and Forecasted Estimates (till 2035)
- 28.3.2.2. Biologics Fill / Finish Manufacturing Market in Europe for Syringes, Historical Trends (since 2018) and Forecasted Estimates (till 2035)
- 28.3.2.3. Biologics Fill / Finish Manufacturing Market in Europe for Ampoules, Historical Trends (since 2018) and Forecasted Estimates (till 2035)
- 28.3.2.4. Biologics Fill / Finish Manufacturing Market in Europe for Cartridges, Historical Trends (since 2018) and Forecasted Estimates (till 2035)
- 28.3.3. Biologics Fill / Finish Manufacturing Market in Europe: Distribution by Type of Biologic Manufactured
- 28.3.3.1. Biologics Fill / Finish Manufacturing Market in Europe for Antibodies, Historical Trends (since 2018) and Forecasted Estimates (till 2035)
- 28.3.3.2. Biologics Fill / Finish Manufacturing Market in Europe for Recombinant Proteins, Historical Trends (since 2018) and Forecasted Estimates (till 2035)
- 28.3.3.3. Biologics Fill / Finish Manufacturing Market in Europe for Vaccines, Historical Trends (since 2018) and Forecasted Estimates (till 2035)
- 28.3.3.4. Biologics Fill / Finish Manufacturing Market in Europe for Cell Therapies, Historical Trends (since 2018) and Forecasted Estimates (till 2035)
- 28.3.3.5. Biologics Fill / Finish Manufacturing Market in Europe for Gene Therapies, Historical Trends (since 2018) and Forecasted Estimates (till 2035)
- 28.3.3.6. Biologics Fill / Finish Manufacturing Market in Europe for Nucleic Acids / Oligonucleotides, Historical Trends (since 2018) and Forecasted Estimates (till 2035)
- 28.3.3.7. Biologics Fill / Finish Manufacturing Market in Europe for Other Biologics, Historical Trends (since 2018) and Forecasted Estimates (till 2035)
- 28.3.4. Biologics Fill / Finish Manufacturing Market in Europe: Distribution by Scale of Operation
- 28.3.4.1. Biologics Fill / Finish Manufacturing Market in Europe for Commercial Scale, Historical Trends (since 2018) and Forecasted Estimates (till 2035)
- 28.3.4.2. Biologics Fill / Finish Manufacturing Market in Europe for Preclinical / Clinical Scale, Historical Trends (since 2018) and Forecasted Estimates (till 2035)
- 28.3.5. Biologics Fill / Finish Manufacturing Market in Europe: Distribution by Therapeutic Area
- 28.3.5.1. Biologics Fill / Finish Manufacturing Market in Europe for Oncological Disorders, Historical Trends (since 2018) and Forecasted Estimates (till 2035)
- 28.3.5.2. Biologics Fill / Finish Manufacturing Market in Europe for Cardiovascular Disorders, Historical Trends (since 2018) and Forecasted Estimates (till 2035)
- 28.3.5.3. Biologics Fill / Finish Manufacturing Market in Europe for Metabolic Disorders, Historical Trends (since 2018) and Forecasted Estimates (till 2035)
- 28.3.5.4. Biologics Fill / Finish Manufacturing Market in Europe for Infectious Diseases, Historical Trends (since 2018) and Forecasted Estimates (till 2035)
- 28.3.5.5. Biologics Fill / Finish Manufacturing Market in Europe for Autoimmune Disorders, Historical Trends (since 2018) and Forecasted Estimates (till 2035)
- 28.3.5.6. Biologics Fill / Finish Manufacturing Market in Europe for Other Disorders, Historical Trends (since 2018) and Forecasted Estimates (till 2035)
- 28.3.6. Biologics Fill / Finish Manufacturing Market in Europe: Distribution by End User
- 28.3.6.1. Biologics Fill / Finish Manufacturing Market in Europe for Pharmaceutical / Biopharmaceutical Companies, Historical Trends (since 2018) and Forecasted Estimates (till 2035)
- 28.3.6.2. Biologics Fill / Finish Manufacturing Market in Europe for Contract Manufacturing Organizations and Others, Historical Trends (since 2018) and Forecasted Estimates (till 2035)
- 28.3.7. Biologics Fill / Finish Manufacturing Market in Europe: Distribution by Type of Player
- 28.3.7.1. Biologics Fill / Finish Manufacturing Market in Europe for Industry Players, Historical Trends (since 2018) and Forecasted Estimates (till 2035)
- 28.3.7.2. Biologics Fill / Finish Manufacturing Market in Europe for Non- Industry Players, Historical Trends (since 2018) and Forecasted Estimates (till 2035)
- 28.3.8. Biologics Fill / Finish Manufacturing Market in Europe: Distribution by Company Size
- 28.3.8.1. Biologics Fill / Finish Manufacturing Market in Europe for Large Companies, Historical Trends (since 2018) and Forecasted Estimates (till 2035)
- 28.3.8.2. Biologics Fill / Finish Manufacturing Market in Europe for Mid-sized Companies, Historical Trends (since 2018) and Forecasted Estimates (till 2035)
- 28.3.8.3. Biologics Fill / Finish Manufacturing Market in Europe for Small Companies, Historical Trends (since 2018) and Forecasted Estimates (till 2035)
- 28.3.1. Biologics Fill / Finish Manufacturing Market in Europe: Distribution by Country
- 28.4. Data Triangulation and Validation
29. BIOLOGICS FILL / FINISH MANUFACTURING MARKET IN ASIA-PACIFIC**
- 29.1. Chapter Overview
- 29.2. Key Assumptions and Methodology
- 29.3. Biologics Fill / Finish Manufacturing Market in Asia-Pacific, Historical Trends (since 2018) and Forecasted Estimates (till 2035)
- 29.3.1. Biologics Fill / Finish Manufacturing Market in Asia-Pacific: Distribution by Country
- 29.3.1.1. Biologics Fill / Finish Manufacturing Market in China, Historical Trends (since 2018) and Forecasted Estimates (till 2035)
- 29.3.1.2. Biologics Fill / Finish Manufacturing Market in India, Historical Trends (since 2018) and Forecasted Estimates (till 2035)
- 29.3.1.3. Biologics Fill / Finish Manufacturing Market in South Korea, Historical Trends (since 2018) and Forecasted Estimates (till 2035)
- 29.3.1.4. Biologics Fill / Finish Manufacturing Market in Taiwan, Historical Trends (since 2018) and Forecasted Estimates (till 2035)
- 29.3.1.5. Biologics Fill / Finish Manufacturing Market in Japan, Historical Trends (since 2018) and Forecasted Estimates (till 2035)
- 29.3.1.6. Biologics Fill / Finish Manufacturing Market in Singapore, Historical Trends (since 2018) and Forecasted Estimates (till 2035)
- 29.3.1.7. Biologics Fill / Finish Manufacturing Market in Australia, Historical Trends (since 2018) and Forecasted Estimates (till 2035)
- 29.3.1.8. Biologics Fill / Finish Manufacturing Market in Rest of Asia-Pacific, Historical Trends (since 2018) and Forecasted Estimates
- 29.3.1. Biologics Fill / Finish Manufacturing Market in Asia-Pacific: Distribution by Country
List of Tables
- Table 7.1 Biologics Fill / Finish Service Providers: Information on Year of Establishment, Company Size, Location of Headquarters, Number and Location of Fill / Finish Facilities
- Table 7.2 Biologics Fill / Finish Service Providers: Information on Scale of Operation and Type of Biologic Manufactured
- Table 7.3 Biologics Fill / Finish Service Providers: Information on Presence of Cytostatic or Cytotoxic or Highly Potent Substance Filling Capability, Type of Dosage Form and Type of Primary Packaging Container Used
- Table 7.4 Biologics Fill / Finish Service Providers: Information on Additional Services Offered
- Table 9.1 Biologics Fill / Finish Service Providers in North America: List of Companies Profiled
- Table 9.2 AbbVie Contract Manufacturing: Company Overview
- Table 9.3 AbbVie Contract Manufacturing: Biologics Fill / Finish Service Portfolio
- Table 9.4 AbbVie Contract Manufacturing: Recent Developments and Future Outlook
- Table 9.5 Alcami: Company Overview
- Table 9.6 Alcami: Biologics Fill / Finish Service Portfolio
- Table 9.7 Alcami: Recent Developments and Future Outlook
- Table 9.8 Catalent Biologics: Company Overview
- Table 9.9 Catalent Biologics: Biologics Fill / Finish Service Portfolio
- Table 9.10 Catalent Biologics: Recent Developments and Future Outlook
- Table 9.11 Charles River: Company Overview
- Table 9.12 Charles River: Biologics Fill / Finish Service Portfolio
- Table 9.13 Curia: Company Overview
- Table 9.14 Curia: Biologics Fill / Finish Service Portfolio
- Table 9.15 Curia: Recent Developments and Future Outlook
- Table 9.16 Grand River Aseptic Manufacturing: Company Overview
- Table 9.17 Grand River Aseptic Manufacturing: Biologics Fill / Finish Service Portfolio
- Table 9.18 Grand River Aseptic Manufacturing: Recent Developments and Future Outlook
- Table 9.19 Lifecore Biomedical: Company Overview
- Table 9.20 Lifecore Biomedical: Biologics Fill / Finish Service Portfolio
- Table 9.21 Lifecore Biomedical: Recent Developments and Future Outlook
- Table 9.22 Novocol Pharma: Company Overview
- Table 9.23 Novocol Pharma: Biologics Fill / Finish Service Portfolio
- Table 9.24 Novocol Pharma: Recent Developments and Future Outlook
- Table 9.25 Patheon pharma services: Company Overview
- Table 9.26 Patheon pharma services: Biologics Fill / Finish Service Portfolio
- Table 9.27 Patheon pharma services: Recent Developments and Future Outlook
- Table 9.28 Pharmaceutics International (Pii): Company Overview
- Table 9.29 Pharmaceutics International (Pii): Biologics Fill / Finish Service Portfolio
- Table 9.30 Pharmaceutics International (Pii): Recent Developments and Future Outlook
- Table 10.1 Biologics Fill / Finish Service Providers in Europe: List of Companies Profiled
- Table 10.2 Boehringer Ingelheim BioXcellence: Company Overview
- Table 10.3 Boehringer Ingelheim BioXcellence: Biologics Fill / Finish Service Portfolio
- Table 10.4 Boehringer Ingelheim BioXcellence: Recent Developments and Future Outlook
- Table 10.5 Cenexi: Company Overview
- Table 10.6 Cenexi: Biologics Fill / Finish Service Portfolio
- Table 10.7 Cenexi: Recent Developments and Future Outlook
- Table 10.8 CordenPharma: Company Overview
- Table 10.9 CordenPharma: Biologics Fill / Finish Service Portfolio
- Table 10.10 CordenPharma: Recent Developments and Future Outlook
- Table 10.11 Element Materials Technology: Company Overview
- Table 10.12 Element Materials Technology: Biologics Fill / Finish Service Portfolio
- Table 10.13 Evonik: Company Overview
- Table 10.14 Evonik: Biologics Fill / Finish Service Portfolio
- Table 10.15 Fareva: Company Overview
- Table 10.16 Fareva: Biologics Fill / Finish Service Portfolio
- Table 10.17 Fresenius Kabi: Company Overview
- Table 10.18 Fresenius Kabi: Biologics Fill / Finish Service Portfolio
- Table 10.19 Fresenius Kabi: Recent Developments and Future Outlook
- Table 10.20 GSK: Company Overview
- Table 10.21 GSK: Biologics Fill / Finish Service Portfolio
- Table 10.22 Lonza: Company Overview
- Table 10.23 Lonza: Biologics Fill / Finish Service Portfolio
- Table 10.24 Lonza: Recent Developments and Future Outlook
- Table 10.25 Northway Biotechpharma: Company Overview
- Table 10.26 Northway Biotechpharma: Biologics Fill / Finish Service Portfolio
- Table 10.27 Northway Biotechpharma: Recent Developments and Future Outlook
- Table 10.28 Rechon Life Science: Company Overview
- Table 10.29 Rechon Life Science: Biologics Fill / Finish Service Portfolio
- Table 10.30 Rechon Life Science: Recent Developments and Future Outlook
- Table 10.31 Recipharm: Company Overview
- Table 10.32 Recipharm: Biologics Fill / Finish Service Portfolio
- Table 10.33 Recipharm: Recent Developments and Future Outlook
- Table 10.34 WACKER: Company Overview
- Table 10.35 WACKER: Biologics Fill / Finish Service Portfolio
- Table 10.36 WACKER: Recent Developments and Future Outlook
- Table 11.1 Biologics Fill / Finish Service Providers in Asia Pacific: List of Companies Profiled
- Table 11.2 Asymchem: Company Overview
- Table 11.3 Asymchem: Biologics Fill / Finish Service Portfolio
- Table 11.4 Asymchem: Recent Developments and Future Outlook
- Table 11.5 Bushu Pharmaceuticals: Company Overview
- Table 11.6 Bushu Pharmaceuticals: Biologics Fill / Finish Service Portfolio
- Table 11.7 Bushu Pharmaceuticals: Recent Developments and Future Outlook
- Table 11.8 Hetero: Company Overview
- Table 11.9 Hetero: Biologics Fill / Finish Service Portfolio
- Table 11.10 Syngene: Company Overview
- Table 11.11 Syngene: Biologics Fill / Finish Service Portfolio
- Table 11.12 WuXi Biologics: Company Overview
- Table 11.13 WuXi Biologics: Biologics Fill / Finish Service Portfolio
- Table 11.14 WuXi Biologics: Recent Developments and Future Outlook
- Table 12.1 Biologics Fill / Finish Service Providers: List of Partnerships and Collaborations, Since 2023
- Table 12.2 Partnerships and Collaborations: Information on Scale of Operation and Type of Agreement
- Table 13.1 Biologics Fill / Finish Service Providers: List of Recent Expansions, Since 2019
- Table 15.1 Biologics Fill / Finish Service Providers: Information on Total Installed Capacity for Ampoules (Sample Data Set)
- Table 15.2 Biologics Fill / Finish Service Providers: Average Capacity per Facility for Ampoules, by Company Size (Sample Dataset)
- Table 15.3 Global Installed Biologics Fill / Finish Capacity for Ampoules, by Company Size (in terms of units / batch)
- Table 15.4 Biologics Fill / Finish Service Providers: Information on Total Installed Capacity for Cartridges (Sample Data Set)
- Table 15.5 Biologics Fill / Finish Service Providers: Average Capacity per Facility for Cartridges by Company Size (Sample Dataset)
- Table 15.6 Global Installed Biologics Fill / Finish Capacity for Cartridges, by Company Size (in terms of units / batch)
- Table 15.7 Biologics Fill / Finish Service Providers: Information on Total Installed Capacity for Syringes (Sample Data Set)
- Table 15.8 Biologics Fill / Finish Service Providers: Average Capacity per Facility for Syringes by Company Size (Sample Dataset)
- Table 15.9 Global Installed Biologics Fill / Finish Capacity for Syringes, by Company Size (in terms of units / batch)
- Table 15.10 Biologics Fill / Finish Service Providers: Information on Total Installed Capacity for Vials (Sample Data Set)
- Table 15.11 Biologics Fill / Finish Service Providers: Average Capacity per Facility for Vials by Company Size (Sample Dataset)
- Table 15.12 Global Installed Biologics Fill / Finish Capacity for Vials, by Company Size (in terms of units / batch)
- Table 27.1 Biologics Fill / Finish Manufacturing Market in North America: Distribution by Type of Primary Packaging Container Used
- Table 27.2 Biologics Fill / Finish Manufacturing Market in North America: Distribution by Type of Biologic Manufactured
- Table 27.3 Biologics Fill / Finish Manufacturing Market in North America: Distribution by Scale of Operation
- Table 27.4 Biologics Fill / Finish Manufacturing Market in North America: Distribution by Therapeutic Area
- Table 27.5 Biologics Fill / Finish Manufacturing Market in North America: Distribution by End User
- Table 27.6 Biologics Fill / Finish Manufacturing Market in North America: Distribution by Type of Player
- Table 27.7 Biologics Fill / Finish Manufacturing Market in North America: Distribution by Company Size
- Table 28.1 Biologics Fill / Finish Manufacturing Market in Europe: Distribution by Type of Primary Packaging Container Used
- Table 28.2 Biologics Fill / Finish Manufacturing Market in Europe: Distribution by Type of Biologic Manufactured
- Table 28.3 Biologics Fill / Finish Manufacturing Market in Europe: Distribution by Scale of Operation
- Table 28.4 Biologics Fill / Finish Manufacturing Market in Europe: Distribution by Therapeutic Area
- Table 28.5 Biologics Fill / Finish Manufacturing Market in Europe: Distribution by End User
- Table 28.6 Biologics Fill / Finish Manufacturing Market in Europe: Distribution by Type of Player
- Table 28.7 Biologics Fill / Finish Manufacturing Market in Europe: Distribution by Company Size
- Table 29.1 Biologics Fill / Finish Manufacturing Market in Asia-Pacific: Distribution by Type of Primary Packaging Container Used
- Table 29.2 Biologics Fill / Finish Manufacturing Market in Asia-Pacific: Distribution by Type of Biologic Manufactured
- Table 29.3 Biologics Fill / Finish Manufacturing Market in Asia-Pacific: Distribution by Scale of Operation
- Table 29.4 Biologics Fill / Finish Manufacturing Market in Asia-Pacific: Distribution by Therapeutic Area
- Table 29.5 Biologics Fill / Finish Manufacturing Market in Asia-Pacific: Distribution by End User
- Table 29.6 Biologics Fill / Finish Manufacturing Market in Asia-Pacific: Distribution by Type of Player
- Table 29.7 Biologics Fill / Finish Manufacturing Market in Asia-Pacific: Distribution by Company Size
- Table 30.1 Biologics Fill / Finish Manufacturing Market in Middle East and North Africa: Distribution by Type of Primary Packaging Container Used
- Table 30.2 Biologics Fill / Finish Manufacturing Market in Middle East and North Africa: Distribution by Type of Biologic Manufactured
- Table 30.3 Biologics Fill / Finish Manufacturing Market in Middle East and North Africa: Distribution by Scale of Operation
- Table 30.4 Biologics Fill / Finish Manufacturing Market in Middle East and North Africa: Distribution by Therapeutic Area
- Table 30.5 Biologics Fill / Finish Manufacturing Market in Middle East and North Africa: Distribution by End User
- Table 30.6 Biologics Fill / Finish Manufacturing Market in Middle East and North Africa: Distribution by Type of Player
- Table 30.7 Biologics Fill / Finish Manufacturing Market in Middle East and North Africa: Distribution by Company Size
- Table 31.1 Biologics Fill / Finish Manufacturing Market in Latin America: Distribution by Type of Primary Packaging Container Used
- Table 31.2 Biologics Fill / Finish Manufacturing Market in Latin America: Distribution by Type of Biologic Manufactured
- Table 31.3 Biologics Fill / Finish Manufacturing Market in Latin America: Distribution by Scale of Operation
- Table 31.4 Biologics Fill / Finish Manufacturing Market in Latin America: Distribution by Therapeutic Area
- Table 31.5 Biologics Fill / Finish Manufacturing Market in Latin America: Distribution by End User
- Table 31.6 Biologics Fill / Finish Manufacturing Market in Latin America: Distribution by Type of Player
- Table 31.7 Biologics Fill / Finish Manufacturing Market in Latin America: Distribution by Company Size
- *Detailed information on Tables 27.1-31.7 is available in the Excel Data Packs shared along with the report**
- Table 34.1 Biologics Fill / Finish Service Providers: Information on Fill / Finish Equipment Used
- Table 34.2 List of Pharmaceutical Robotics Manufacturers
- Table 34.3 Isolator based Aseptic Filling Systems: Information on Compatible Primary Containers
- Table 35.1 List of Companies Supplying Ready-to-Use Packaging Components
- Table 38.1 Biologics Fill / Finish Service Providers: Distribution by Year of Establishment
- Table 38.2 Biologics Fill / Finish Service Providers: Distribution by Company Size
- Table 38.3 Biologics Fill / Finish Service Providers: Distribution by Location of Headquarters
- Table 38.4 Biologics Fill / Finish Service Providers: Distribution by Location of Fill / Finish Facilities
- Table 38.5 Biologics Fill / Finish Service Providers: Distribution by Scale of Operation
- Table 38.6 Biologics Fill / Finish Service Providers: Distribution by Type of Biologic Manufactured
- Table 38.7 Biologics Fill / Finish Service Providers: Distribution by Presence of Cytostatic or Cytotoxic or Highly Potent Substance Filling Capability
- Table 38.8 Biologics Fill / Finish Service Providers: Distribution by Type of Dosage Form
- Table 38.9 Biologics Fill / Finish Service Providers: Distribution by Type of Primary Packaging Container Used
- Table 38.10 Biologics Fill / Finish Service Providers: Distribution by Additional Services Offered
- Table 38.11 AbbVie (Parent Company of AbbVie Contract Manufacturing): Annual Revenues, FY 2019 onwards (USD Billion)
- Table 38.12 Catalent (Parent Company of Catalent Biologics): Annual Revenues, FY 2019 onwards (USD Billion)
- Table 38.13 Lifecore Biomedical: Annual Revenues, FY 2021 onwards (USD Million)
- Table 38.14 Thermo Fisher Scientific (Parent Company of Patheon pharma services): Annual Revenues, FY 2019 onwards (USD Billion)
- Table 38.15 Boehringer Ingelheim (Parent Company of Boehringer Ingelheim BioXcellence): Annual Revenues, FY 2019 onwards (EUR Billion)
- Table 38.16 CordenPharma: Annual Revenues, FY 2021 onwards (EUR Million)
- Table 38.17 Fresenius Kabi: Annual Revenues, FY 2019 onwards (EUR Billion)
- Table 38.18 Lonza: Annual Revenues, FY 2019 onwards (CHF Billion)
- Table 38.19 Recipharm: Annual Revenues, FY 2019 onwards (EUR Million)
- Table 38.20 WACKER: Annual Revenues, FY 2019 onwards (EUR Billion)
- Table 38.21 Asymchem: Annual Revenues, FY 2019 onwards (RMB Billion)
- Table 38.22 WuXi Biologics: Annual Revenues, FY 2019 onwards (RMB Billion)
- Table 38.23 Partnerships and Collaborations: Cumulative Year-wise Trend, Since 2023
- Table 38.24 Partnerships and Collaborations: Distribution by Type of Partnership
- Table 38.25 Partnerships and Collaborations: Distribution by Type and Year of Partnership, Since 2023
- Table 38.26 Partnerships and Collaborations: Distribution by Scale of Operation
- Table 38.27 Partnerships and Collaborations: Distribution by Type of Partner Company
- Table 38.28 Most Active Players: Distribution by Number of Partnerships
- Table 38.29 Partnerships and Collaborations: Distribution by Local and International Agreements
- Table 38.30 Partnerships and Collaborations: Distribution by Intracontinental and Intercontinental Agreements
- Table 38.31 Recent Expansions: Cumulative Year-wise Trend, Since 2019
- Table 38.32 Recent Expansions: Distribution by Type of Expansion
- Table 38.33 Recent Expansions: Distribution by Type and Year of Expansion, Since 2019
- Table 38.34 Recent Expansions: Distribution by Location of Expanded Facility
- Table 38.35 Recent Expansions: Distribution by Type of Expansion and Location of Expanded Facility
- Table 38.36 Recent Expansions: Distribution by Area of Expanded Facility (sq. ft.)
- Table 38.37 Recent Expansions: Distribution by Scale of Operation
- Table 38.38 Recent Expansions: Distribution by Type of Primary Packaging Container Used
- Table 38.39 Recent Expansions: Distribution by Type of Expansion and Type of Primary Packaging Container Used
- Table 38.40 Recent Expansions: Distribution by Amount Invested (USD Million)
- Table 38.41 Most Active Players: Distribution by Number of Recent Expansions
- Table 38.42 Global Installed Biologics Fill / Finish Capacity for Ampoules: Distribution by Company Size
- Table 38.43 Global Installed Biologics Fill / Finish Capacity for Ampoules: Distribution by Location of Fill / Finish Facility
- Table 38.44 Biologics Fill / Finish Capacity for Ampoules in North America
- Table 38.45 Biologics Fill / Finish Capacity for Ampoules in Europe
- Table 38.46 Biologics Fill / Finish Capacity for Ampoules in Asia-Pacific
- Table 38.47 Biologics Fill / Finish Capacity for Ampoules in Rest of the World
- Table 38.48 Global Installed Biologics Fill / Finish Capacity for Cartridges: Distribution by Company Size
- Table 38.49 Global Installed Biologics Fill / Finish Capacity for Cartridges: Distribution by Location of Fill / Finish Facility
- Table 38.50 Biologics Fill / Finish Capacity for Cartridges in North America
- Table 38.51 Biologics Fill / Finish Capacity for Cartridges in Europe
- Table 38.52 Biologics Fill / Finish Capacity for Cartridges in Asia-Pacific
- Table 38.53 Biologics Fill / Finish Capacity for Cartridges in Rest of the World
- Table 38.54 Global Installed Biologics Fill / Finish Capacity for Syringes: Distribution by Company Size
- Table 38.55 Global Installed Biologics Fill / Finish Capacity for Syringes: Distribution by Location of Fill / Finish Facility
- Table 38.56 Biologics Fill / Finish Capacity for Syringes in North America
- Table 38.57 Biologics Fill / Finish Capacity for Syringes in Europe
- Table 38.58 Biologics Fill / Finish Capacity for Syringes in Asia-Pacific
- Table 38.59 Biologics Fill / Finish Capacity for Syringes in Rest of the World
- Table 38.60 Global Installed Biologics Fill / Finish Capacity for Vials: Distribution by Company Size
- Table 38.61 Global Installed Biologics Fill / Finish Capacity for Vials: Distribution by Location of Fill / Finish Facility
- Table 38.62 Biologics Fill / Finish Capacity for Vials in North America
- Table 38.63 Biologics Fill / Finish Capacity for Vials in Europe
- Table 38.64 Biologics Fill / Finish Capacity for Vials in Asia-Pacific
- Table 38.65 Biologics Fill / Finish Capacity for Vials in Rest of the World
- Table 38.66 Global Annual Demand for Biologics Fill / Finish Manufacturing, Since 2025 (in million liters)
- Table 38.67 Global Demand for Biologics Fill / Finish Manufacturing: Distribution by Scale of Operation (in million liters)
- Table 38.68 Global Demand for Biologics Fill / Finish Manufacturing: Distribution by Type of Primary Packaging Container Used (in million liters)
- Table 38.69 Global Demand for Biologics Fill / Finish Manufacturing: Distribution by Geography (in million liters)
- Table 38.70 Global Biologics Fill / Finish Manufacturing Market, Historical Trends (Since 2018) and Forecasted Estimates (Till 2035) (USD Billion)
- Table 38.71 Global Biologics Fill / Finish Manufacturing Market, Forecasted Estimates (Till 2035): Conservative Case (USD Billion)
- Table 38.72 Global Biologics Fill / Finish Manufacturing Market, Forecasted Estimates (Till 2035): Optimistic Case (USD Billion)
- Table 38.73 Biologics Fill / Finish Manufacturing Market: Distribution by Type of Primary Packaging Container Used
- Table 38.74 Biologics Fill / Finish Manufacturing Market for Vials, Historical Trends (Since 2018) and Forecasted Estimates (Till 2035): Conservative, Base and Optimistic Scenario (USD Billion)
- Table 38.75 Biologics Fill / Finish Manufacturing Market for Syringes, Historical Trends (Since 2018) and Forecasted Estimates (Till 2035): Conservative, Base and Optimistic Scenario (USD Billion)
- Table 38.76 Biologics Fill / Finish Manufacturing Market for Ampoules, Historical Trends (Since 2018) and Forecasted Estimates (Till 2035): Conservative, Base and Optimistic Scenario (USD Billion)
- Table 38.77 Biologics Fill / Finish Manufacturing Market for Cartridges, Historical Trends (Since 2018) and Forecasted Estimates (Till 2035): Conservative, Base and Optimistic Scenario (USD Billion)
- Table 38.78 Biologics Fill / Finish Manufacturing Market: Distribution by Type of Biologics Manufactured
- Table 38.79 Biologics Fill / Finish Manufacturing Market for Antibodies, Historical Trends (Since 2018) and Forecasted Estimates (Till 2035): Conservative, Base and Optimistic Scenario (USD Billion)
- Table 38.80 Biologics Fill / Finish Manufacturing Market for Recombinant Proteins, Historical Trends (Since 2018) and Forecasted Estimates (Till 2035): Conservative, Base and Optimistic Scenario (USD Billion)
- Table 38.81 Biologics Fill / Finish Manufacturing Market for Vaccines, Historical Trends (Since 2018) and Forecasted Estimates (Till 2035): Conservative, Base and Optimistic Scenario (USD Billion)
- Table 38.82 Biologics Fill / Finish Manufacturing Market for Cell Therapies, Historical Trends (Since 2018) and Forecasted Estimates (Till 2035): Conservative, Base and Optimistic Scenario (USD Billion)
- Table 38.83 Biologics Fill / Finish Manufacturing Market for Gene Therapies, Historical Trends (Since 2018) and Forecasted Estimates (Till 2035): Conservative, Base and Optimistic Scenario (USD Billion)
- Table 38.84 Biologics Fill / Finish Manufacturing Market for Nucleic Acids / Oligonucleotides, Historical Trends (Since 2018) and Forecasted Estimates (Till 2035): Conservative, Base and Optimistic Scenario (USD Billion)
- Table 38.85 Biologics Fill / Finish Manufacturing Market for Other Biologics, Historical Trends (Since 2018) and Forecasted Estimates (Till 2035): Conservative, Base and Optimistic Scenario (USD Billion)
- Table 38.86 Biologics Fill / Finish Manufacturing Market: Distribution by Scale of Operation
- Table 38.87 Biologics Fill / Finish Manufacturing Market for Commercial Scale, Historical Trends (Since 2018) and Forecasted Estimates (Till 2035): Conservative, Base and Optimistic Scenario (USD Billion)
- Table 38.88 Biologics Fill / Finish Manufacturing Market for Preclinical / Clinical Scale, Historical Trends (Since 2018) and Forecasted Estimates (Till 2035): Conservative, Base and Optimistic Scenario (USD Billion)
- Table 38.89 Biologics Fill / Finish Manufacturing Market: Distribution by Therapeutic Area
- Table 38.90 Biologics Fill / Finish Manufacturing Market for Oncological Disorders, Historical Trends (Since 2018) and Forecasted Estimates (Till 2035): Conservative, Base and Optimistic Scenario (USD Billion)
- Table 38.91 Biologics Fill / Finish Manufacturing Market for Cardiovascular Disorders, Historical Trends (Since 2018) and Forecasted Estimates (Till 2035): Conservative, Base and Optimistic Scenario (USD Billion)
- Table 38.92 Biologics Fill / Finish Manufacturing Market for Metabolic Disorders, Historical Trends (Since 2018) and Forecasted Estimates (Till 2035): Conservative, Base and Optimistic Scenario (USD Billion)
- Table 38.93 Biologics Fill / Finish Manufacturing Market for Infectious Diseases, Historical Trends (Since 2018) and Forecasted Estimates (Till 2035): Conservative, Base and Optimistic Scenario (USD Billion)
- Table 38.94 Biologics Fill / Finish Manufacturing Market for Autoimmune Disorders, Historical Trends (Since 2018) and Forecasted Estimates (Till 2035): Conservative, Base and Optimistic Scenario (USD Billion)
- Table 38.95 Biologics Fill / Finish Manufacturing Market for Other Disorders, Historical Trends (Since 2018) and Forecasted Estimates (Till 2035): Conservative, Base and Optimistic Scenario (USD Billion)
- Table 38.96 Biologics Fill / Finish Manufacturing Market: Distribution by End User
- Table 38.97 Biologics Fill / Finish Manufacturing Market for Pharmaceutical / Biopharmaceutical Companies, Historical Trends (Since 2018) and Forecasted Estimates (Till 2035): Conservative, Base and Optimistic Scenario (USD Billion)
- Table 38.98 Biologics Fill / Finish Manufacturing Market for Contract Manufacturing Organizations and Others, Historical Trends (Since 2018) and Forecasted Estimates (Till 2035): Conservative, Base and Optimistic Scenario (USD Billion)
- Table 38.99 Biologics Fill / Finish Manufacturing Market: Distribution by Type of Player
- Table 38.100 Biologics Fill / Finish Manufacturing Market for Industry Players, Historical Trends (Since 2018) and Forecasted Estimates (Till 2035): Conservative, Base and Optimistic Scenario (USD Billion)
- Table 38.101 Biologics Fill / Finish Manufacturing Market for Non-Industry Players, Historical Trends (Since 2018) and Forecasted Estimates (Till 2035): Conservative, Base and Optimistic Scenario (USD Billion)
- Table 38.102 Biologics Fill / Finish Manufacturing Market: Distribution by Company Size
- Table 38.103 Biologics Fill / Finish Manufacturing Market for Large Companies, Historical Trends (Since 2018) and Forecasted Estimates (Till 2035): Conservative, Base and Optimistic Scenario (USD Billion)
- Table 38.104 Biologics Fill / Finish Manufacturing Market for Mid-sized Companies, Historical Trends (Since 2018) and Forecasted Estimates (Till 2035): Conservative, Base and Optimistic Scenario (USD Billion)
- Table 38.105 Biologics Fill / Finish Manufacturing Market for Small Companies, Historical Trends (Since 2018) and Forecasted Estimates (Till 2035): Conservative, Base and Optimistic Scenario (USD Billion)
- Table 38.106 Biologics Fill / Finish Manufacturing Market in North America, Historical Trends (Since 2018) and Forecasted Estimates (Till 2035): Conservative, Base and Optimistic Scenario (USD Billion)
- Table 38.107 Biologics Fill / Finish Manufacturing Market in the US, Historical Trends (Since 2018) and Forecasted Estimates (Till 2035): Conservative, Base and Optimistic Scenario (USD Billion)
- Table 38.108 Biologics Fill / Finish Manufacturing Market in Canada, Historical Trends (Since 2018) and Forecasted Estimates (Till 2035): Conservative, Base and Optimistic Scenario (USD Billion)
- Table 38.109 Biologics Fill / Finish Manufacturing Market in Mexico, Historical Trends (Since 2018) and Forecasted Estimates (Till 2035): Conservative, Base and Optimistic Scenario (USD Billion)
- Table 38.110 Biologics Fill / Finish Manufacturing Market in Europe, Historical Trends (Since 2018) and Forecasted Estimates (Till 2035): Conservative, Base and Optimistic Scenario (USD Billion)
- Table 38.111 Biologics Fill / Finish Manufacturing Market in Germany, Historical Trends (Since 2018) and Forecasted Estimates (Till 2035): Conservative, Base and Optimistic Scenario (USD Billion)
- Table 38.112 Biologics Fill / Finish Manufacturing Market in France, Historical Trends (Since 2018) and Forecasted Estimates (Till 2035): Conservative, Base and Optimistic Scenario (USD Billion)
- Table 38.113 Biologics Fill / Finish Manufacturing Market in the UK, Historical Trends (Since 2018) and Forecasted Estimates (Till 2035): Conservative, Base and Optimistic Scenario (USD Billion)
- Table 38.114 Biologics Fill / Finish Manufacturing Market in Switzerland, Historical Trends (Since 2018) and Forecasted Estimates (Till 2035): Conservative, Base and Optimistic Scenario (USD Billion)
- Table 38.115 Biologics Fill / Finish Manufacturing Market in Belgium, Historical Trends (Since 2018) and Forecasted Estimates (Till 2035): Conservative, Base and Optimistic Scenario (USD Billion)
- Table 38.116 Biologics Fill / Finish Manufacturing Market in Italy, Historical Trends (Since 2018) and Forecasted Estimates (Till 2035): Conservative, Base and Optimistic Scenario (USD Billion)
- Table 38.117 Biologics Fill / Finish Manufacturing Market in Austria, Historical Trends (Since 2018) and Forecasted Estimates (Till 2035): Conservative, Base and Optimistic Scenario (USD Billion)
- Table 38.118 Biologics Fill / Finish Manufacturing Market in Spain, Historical Trends (Since 2018) and Forecasted Estimates (Till 2035): Conservative, Base and Optimistic Scenario (USD Billion)
- Table 38.119 Biologics Fill / Finish Manufacturing Market in Netherlands, Historical Trends (Since 2018) and Forecasted Estimates (Till 2035): Conservative, Base and Optimistic Scenario (USD Billion)
- Table 38.120 Biologics Fill / Finish Manufacturing Market in Poland, Historical Trends (Since 2018) and Forecasted Estimates (Till 2035): Conservative, Base and Optimistic Scenario (USD Billion)
- Table 38.121 Biologics Fill / Finish Manufacturing Market in Portugal, Historical Trends (Since 2018) and Forecasted Estimates (Till 2035): Conservative, Base and Optimistic Scenario (USD Billion)
- Table 38.122 Biologics Fill / Finish Manufacturing Market in Rest of Europe, Historical Trends (Since 2018) and Forecasted Estimates (Till 2035): Conservative, Base and Optimistic Scenario (USD Billion)
- Table 38.123 Biologics Fill / Finish Manufacturing Market in Asia Pacific, Historical Trends (Since 2018) and Forecasted Estimates (Till 2035): Conservative, Base and Optimistic Scenario (USD Billion)
- Table 38.124 Biologics Fill / Finish Manufacturing Market in China, Historical Trends (Since 2018) and Forecasted Estimates (Till 2035): Conservative, Base and Optimistic Scenario (USD Billion)
- Table 38.125 Biologics Fill / Finish Manufacturing Market in India, Historical Trends (Since 2018) and Forecasted Estimates (Till 2035): Conservative, Base and Optimistic Scenario (USD Billion)
- Table 38.126 Biologics Fill / Finish Manufacturing Market in South Korea, Historical Trends (Since 2018) and Forecasted Estimates (Till 2035): Conservative, Base and Optimistic Scenario (USD Billion)
- Table 38.127 Biologics Fill / Finish Manufacturing Market in Japan, Historical Trends (Since 2018) and Forecasted Estimates (Till 2035): Conservative, Base and Optimistic Scenario (USD Billion)
- Table 38.128 Biologics Fill / Finish Manufacturing Market in Singapore, Historical Trends (Since 2018) and Forecasted Estimates (Till 2035): Conservative, Base and Optimistic Scenario (USD Billion)
- Table 38.129 Biologics Fill / Finish Manufacturing Market in Australia, Historical Trends (Since 2018) and Forecasted Estimates (Till 2035): Conservative, Base and Optimistic Scenario (USD Billion)
- Table 38.130 Biologics Fill / Finish Manufacturing Market in Rest of Asia Pacific, Historical Trends (Since 2018) and Forecasted Estimates (Till 2035): Conservative, Base and Optimistic Scenario (USD Billion)
- Table 38.131 Biologics Fill / Finish Manufacturing Market in Middle East and North Africa, Historical Trends (Since 2018) and Forecasted Estimates (Till 2035): Conservative, Base and Optimistic Scenario (USD Billion)
- Table 38.132 Biologics Fill / Finish Manufacturing Market in Israel, Historical Trends (Since 2018) and Forecasted Estimates (Till 2035): Conservative, Base and Optimistic Scenario (USD Billion)
- Table 38.133 Biologics Fill / Finish Manufacturing Market in Bahrain, Historical Trends (Since 2018) and Forecasted Estimates (Till 2035): Conservative, Base and Optimistic Scenario (USD Billion)
- Table 38.134 Biologics Fill / Finish Manufacturing Market in Saudi Arabia, Historical Trends (Since 2018) and Forecasted Estimates (Till 2035): Conservative, Base and Optimistic Scenario (USD Billion)
- Table 38.135 Biologics Fill / Finish Manufacturing Market in Iran, Historical Trends (Since 2018) and Forecasted Estimates (Till 2035): Conservative, Base and Optimistic Scenario (USD Billion)
- Table 38.136 Biologics Fill / Finish Manufacturing Market in Latin America, Historical Trends (Since 2018) and Forecasted Estimates (Till 2035): Conservative, Base and Optimistic Scenario (USD Billion)
- Table 38.137 Biologics Fill / Finish Manufacturing Market in South Africa, Historical Trends (Since 2018) and Forecasted Estimates (Till 2035): Conservative, Base and Optimistic Scenario (USD Billion)
- Table 38.138 Biologics Fill / Finish Manufacturing Market in Argentina, Historical Trends (Since 2018) and Forecasted Estimates (Till 2035): Conservative, Base and Optimistic Scenario (USD Billion)
List of Figures
- Figure 2.1 Research Methodology: Project Methodology
- Figure 2.2 Research Methodology: Data Sources for Secondary Research
- Figure 2.3 Research Methodology: Robust Quality Control
- Figure 3.1 Market Dynamics: Forecast Methodology
- Figure 3.2 Market Dynamics: Market Assessment Framework
- Figure 4.1 Lessons Learnt from Past Recessions
- Figure 5.1 Executive Summary: Market Landscape
- Figure 5.2 Executive Summary: Partnerships and Collaborations
- Figure 5.3 Executive Summary: Recent Expansions
- Figure 5.4 Executive Summary: Capacity Analysis
- Figure 5.5 Executive Summary: Demand Analysis
- Figure 5.6 Executive Summary: Market Sizing and Opportunity Analysis
- Figure 6.1 Types of Biologics
- Figure 6.2 Commonly Outsourced Operations in Biopharmaceutical Industry
- Figure 6.3 Steps Involved in Fill / Finish of Biologics
- Figure 6.4 Key Considerations while Selecting a Fill / Finish Service Provider
- Figure 6.5 Advantages of Outsourcing Biologics Fill / Finish Operations
- Figure 7.1 Biologics Fill / Finish Service Providers: Distribution by Year of Establishment
- Figure 7.2 Biologics Fill / Finish Service Providers: Distribution by Company Size
- Figure 7.3 Biologics Fill / Finish Service Providers: Distribution by Location of Headquarters
- Figure 7.4 Biologics Fill / Finish Service Providers: Distribution by Location of Fill / Finish Facilities
- Figure 7.5 Biologics Fill / Finish Service Providers: Distribution by Scale of Operation
- Figure 7.6 Biologics Fill / Finish Service Providers: Distribution by Type of Biologic Manufactured
- Figure 7.7 Biologics Fill / Finish Service Providers: Distribution by Presence of Cytostatic or Cytotoxic or Highly Potent Substance Filling Capability
- Figure 7.8 Biologics Fill / Finish Service Providers: Distribution by Type of Dosage Form
- Figure 7.9 Biologics Fill / Finish Service Providers: Distribution by Type of Primary Packaging Container Used
- Figure 7.10 Biologics Fill / Finish Service Providers: Distribution by Additional Services Offered
- Figure 8.1 Company Competitiveness Analysis: Biologics Fill / Finish Service Providers based in North America (Peer Group I)
- Figure 8.2 Company Competitiveness Analysis: Biologics Fill / Finish Service Providers based in Europe (Peer Group II)
- Figure 8.3 Company Competitiveness Analysis: Biologics Fill / Finish Service Providers based in Asia-Pacific and Rest of the World (Peer Group III)
- Figure 9.1 AbbVie (Parent Company of AbbVie Contract Manufacturing): Annual Revenues, FY 2019 onwards (USD Billion)
- Figure 9.2 Catalent (Parent Company of Catalent Biologics): Annual Revenues, FY 2019 onwards (USD Billion)
- Figure 9.3 Lifecore Biomedical: Annual Revenues, FY 2021 onwards (USD Million)
- Figure 9.4 Thermo Fisher Scientific (Parent Company of Patheon pharma services): Annual Revenues, FY 2019 onwards (USD Billion)
- Figure 10.1 Boehringer Ingelheim (Parent Company of Boehringer Ingelheim BioXcellence): Annual Revenues, FY 2019 onwards (EUR Billion)
- Figure 10.2 CordenPharma: Annual Revenues, FY 2021 onwards (EUR Million)
- Figure 10.3 Fresenius Kabi: Annual Revenues, FY 2019 onwards (EUR Billion)
- Figure 10.4 Lonza: Annual Revenues, FY 2019 onwards (CHF Billion)
- Figure 10.5 Recipharm: Annual Revenues, FY 2019 onwards (EUR Million)
- Figure 10.6 WACKER: Annual Revenues, FY 2019 onwards (EUR Billion)
- Figure 11.1 Asymchem: Annual Revenues, FY 2019 onwards (RMB Billion)
- Figure 11.2 WuXi Biologics: Annual Revenues, FY 2019 onwards (RMB Billion)
- Figure 12.1 Partnerships and Collaborations: Cumulative Year-wise Trend, Since 2023
- Figure 12.2 Partnerships and Collaborations: Distribution by Type of Partnership
- Figure 12.3 Partnerships and Collaborations: Distribution by Type and Year of Partnership, Since 2023
- Figure 12.4 Partnerships and Collaborations: Distribution by Scale of Operation
- Figure 12.5 Partnerships and Collaborations: Distribution by Type of Partner Company
- Figure 12.6 Most Active Players: Distribution by Number of Partnerships
- Figure 12.7 Partnerships and Collaborations: Distribution by Local and International Agreements
- Figure 12.8 Partnerships and Collaborations: Distribution by Intracontinental and Intercontinental Agreements
- Figure 13.1 Recent Expansions: Cumulative Year-wise Trend, Since 2019
- Figure 13.2 Recent Expansions: Distribution by Type of Expansion
- Figure 13.3 Recent Expansions: Distribution by Type and Year of Expansion, Since 2019
- Figure 13.4 Recent Expansions: Distribution by Location of Expanded Facility
- Figure 13.5 Recent Expansions: Distribution by Type of Expansion and Location of Expanded Facility
- Figure 13.6 Recent Expansions: Distribution by Area of Expanded Facility (sq. ft.)
- Figure 13.7 Recent Expansions: Distribution by Scale of Operation
- Figure 13.8 Recent Expansions: Distribution by Type of Primary Packaging Container Used
- Figure 13.9 Recent Expansions: Distribution by Type of Expansion and Type of Primary Packaging Container Used
- Figure 13.10 Recent Expansions: Distribution by Amount Invested (USD Million)
- Figure 13.11 Most Active Players: Distribution by Number of Recent Expansions
- Figure 15.1 Global Installed Biologics Fill / Finish Capacity for Ampoules: Distribution by Company Size
- Figure 15.2 Global Installed Biologics Fill / Finish Capacity for Ampoules: Distribution by Location of Fill / Finish Facility
- Figure 15.3 Biologics Fill / Finish Capacity for Ampoules in North America
- Figure 15.4 Biologics Fill / Finish Capacity for Ampoules in Europe
- Figure 15.5 Biologics Fill / Finish Capacity for Ampoules in Asia-Pacific
- Figure 15.6 Biologics Fill / Finish Capacity for Ampoules in Rest of the World
- Figure 15.7 Global Installed Biologics Fill / Finish Capacity for Cartridges: Distribution by Company Size
- Figure 15.8 Global Installed Biologics Fill / Finish Capacity for Cartridges: Distribution by Location of Fill / Finish Facility
- Figure 15.9 Biologics Fill / Finish Capacity for Cartridges in North America
- Figure 15.10 Biologics Fill / Finish Capacity for Cartridges in Europe
- Figure 15.11 Biologics Fill / Finish Capacity for Cartridges in Asia-Pacific
- Figure 15.12 Biologics Fill / Finish Capacity for Cartridges in Rest of the World
- Figure 15.13 Global Installed Biologics Fill / Finish Capacity for Syringes: Distribution by Company Size
- Figure 15.14 Global Installed Biologics Fill / Finish Capacity for Syringes: Distribution by Location of Fill / Finish Facility
- Figure 15.15 Biologics Fill / Finish Capacity for Syringes in North America
- Figure 15.16 Biologics Fill / Finish Capacity for Syringes in Europe
- Figure 15.17 Biologics Fill / Finish Capacity for Syringes in Asia-Pacific
- Figure 15.18 Biologics Fill / Finish Capacity for Syringes in Rest of the World
- Figure 15.19 Global Installed Biologics Fill / Finish Capacity for Vials: Distribution by Company Size
- Figure 15.20 Global Installed Biologics Fill / Finish Capacity for Vials: Distribution by Location of Fill / Finish Facility
- Figure 15.21 Biologics Fill / Finish Capacity for Vials in North America
- Figure 15.22 Biologics Fill / Finish Capacity for Vials in Europe
- Figure 15.23 Biologics Fill / Finish Capacity for Vials in Asia-Pacific
- Figure 15.24 Biologics Fill / Finish Capacity for Vials in Rest of the World
- Figure 16.1 Global Annual Demand for Biologics Fill / Finish Manufacturing, Since 2024 (in million liters)
- Figure 16.2 Global Demand for Biologics Fill / Finish Manufacturing: Distribution by Scale of Operation (in million liters)
- Figure 16.3 Global Demand for Biologics Fill / Finish Manufacturing: Distribution by Type of Primary Packaging Container Used (in million liters)
- Figure 16.4 Global Demand for Biologics Fill / Finish Manufacturing: Distribution by Geography (in million liters)
- Figure 17.1 Regional Capability Analysis: Biologics Fill / Finish Manufacturing Capabilities in North America
- Figure 17.2 Regional Capability Analysis: Biologics Fill / Finish Manufacturing Capabilities in Europe
- Figure 17.3 Regional Capability Analysis: Biologics Fill / Finish Manufacturing Capabilities in Asia-Pacific and Rest of the World
- Figure 19.1 Global Biologics Fill / Finish Manufacturing Market, Historical Trends (Since 2018) and Forecasted Estimates (Till 2035) (USD Billion)
- Figure 19.2 Global Biologics Fill / Finish Manufacturing Market, Forecasted Estimates (Till 2035): Conservative Case (USD Billion)
- Figure 19.3 Global Biologics Fill / Finish Manufacturing Market, Forecasted Estimates (Till 2035): Optimistic Case (USD Billion)
- Figure 20.1 Biologics Fill / Finish Manufacturing Market: Distribution by Type of Primary Packaging Container Used
- Figure 20.2 Biologics Fill / Finish Manufacturing Market for Vials, Historical Trends (Since 2018) and Forecasted Estimates (Till 2035) (USD Billion)
- Figure 20.3 Biologics Fill / Finish Manufacturing Market for Syringes, Historical Trends (Since 2018) and Forecasted Estimates (Till 2035) (USD Billion)
- Figure 20.4 Biologics Fill / Finish Manufacturing Market for Ampoules, Historical Trends (Since 2018) and Forecasted Estimates (Till 2035) (USD Billion)
- Figure 20.5 Biologics Fill / Finish Manufacturing Market for Cartridges, Historical Trends (Since 2018) and Forecasted Estimates (Till 2035) (USD Billion)
- Figure 20.6 Market Movement Analysis: Type of Primary Packaging Container Used
- Figure 20.7 Penetration-Growth (P-G) Matrix: Type of Primary Packaging Container Used
- Figure 21.1 Biologics Fill / Finish Manufacturing Market: Distribution by Type of Biologics Manufactured
- Figure 21.2 Biologics Fill / Finish Manufacturing Market for Antibodies, Historical Trends (Since 2018) and Forecasted Estimates (Till 2035) (USD Billion)
- Figure 21.3 Biologics Fill / Finish Manufacturing Market for Recombinant Proteins, Historical Trends (Since 2018) and Forecasted Estimates (Till 2035) (USD Billion)
- Figure 21.4 Biologics Fill / Finish Manufacturing Market for Vaccines, Historical Trends (Since 2018) and Forecasted Estimates (Till 2035) (USD Billion)
- Figure 21.5 Biologics Fill / Finish Manufacturing Market for Cell Therapies, Historical Trends (Since 2018) and Forecasted Estimates (Till 2035) (USD Billion)
- Figure 21.6 Biologics Fill / Finish Manufacturing Market for Gene Therapies, Historical Trends (Since 2018) and Forecasted Estimates (Till 2035) (USD Billion)
- Figure 21.7 Biologics Fill / Finish Manufacturing Market for Nucleic Acids / Oligonucleotides, Historical Trends (Since 2018) and Forecasted Estimates (Till 2035) (USD Billion)
- Figure 21.8 Biologics Fill / Finish Manufacturing Market for Other Biologics, Historical Trends (Since 2018) and Forecasted Estimates (Till 2035) (USD Billion)
- Figure 22.1 Biologics Fill / Finish Manufacturing Market: Distribution by Scale of Operation
- Figure 22.2 Biologics Fill / Finish Manufacturing Market for Commercial Scale, Historical Trends (Since 2018) and Forecasted Estimates (Till 2035) (USD Billion)
- Figure 22.3 Biologics Fill / Finish Manufacturing Market for Preclinical / Clinical Scale, Historical Trends (Since 2018) and Forecasted Estimates (Till 2035) (USD Billion)
- Figure 23.1 Biologics Fill / Finish Manufacturing Market: Distribution by Therapeutic Area
- Figure 23.2 Biologics Fill / Finish Manufacturing Market for Oncological Disorders, Historical Trends (Since 2018) and Forecasted Estimates (Till 2035) (USD Billion)
- Figure 23.3 Biologics Fill / Finish Manufacturing Market for Cardiovascular Disorders, Historical Trends (Since 2018) and Forecasted Estimates (Till 2035) (USD Billion)
- Figure 23.4 Biologics Fill / Finish Manufacturing Market for Metabolic Disorders, Historical Trends (Since 2018) and Forecasted Estimates (Till 2035) (USD Billion)
- Figure 23.5 Biologics Fill / Finish Manufacturing Market for Infectious Diseases, Historical Trends (Since 2018) and Forecasted Estimates (Till 2035) (USD Billion)
- Figure 23.6 Biologics Fill / Finish Manufacturing Market for Autoimmune Disorders, Historical Trends (Since 2018) and Forecasted Estimates (Till 2035) (USD Billion)
- Figure 23.7 Biologics Fill / Finish Manufacturing Market for Other Disorders, Historical Trends (Since 2018) and Forecasted Estimates (Till 2035) (USD Billion)
- Figure 24.1 Biologics Fill / Finish Manufacturing Market: Distribution by End User
- Figure 24.2 Biologics Fill / Finish Manufacturing Market for Pharmaceutical / Biopharmaceutical Companies, Historical Trends (Since 2018) and Forecasted Estimates (Till 2035) (USD Billion)
- Figure 24.3 Biologics Fill / Finish Manufacturing Market for Contract Manufacturing Organizations and Others, Historical Trends (Since 2018) and Forecasted Estimates (Till 2035) (USD Billion)
- Figure 25.1 Biologics Fill / Finish Manufacturing Market: Distribution by Type of Player
- Figure 25.2 Biologics Fill / Finish Manufacturing Market for Industry Players, Historical Trends (Since 2018) and Forecasted Estimates (Till 2035) (USD Billion)
- Figure 25.3 Biologics Fill / Finish Manufacturing Market for Non-Industry Players, Historical Trends (Since 2018) and Forecasted Estimates (Till 2035) (USD Billion)
- Figure 26.1 Biologics Fill / Finish Manufacturing Market: Distribution by Company Size
- Figure 26.2 Biologics Fill / Finish Manufacturing Market for Large Companies, Historical Trends (Since 2018) and Forecasted Estimates (Till 2035) (USD Billion)
- Figure 26.3 Biologics Fill / Finish Manufacturing Market for Mid-sized Companies, Historical Trends (Since 2018) and Forecasted Estimates (Till 2035) (USD Billion)
- Figure 26.4 Biologics Fill / Finish Manufacturing Market for Small Companies, Historical Trends (Since 2018) and Forecasted Estimates (Till 2035) (USD Billion)
- Figure 27.1 Biologics Fill / Finish Manufacturing Market in North America, Historical Trends (Since 2018) and Forecasted Estimates (Till 2035) (USD Billion)
- Figure 27.2 Biologics Fill / Finish Manufacturing Market in the US, Historical Trends (Since 2018) and Forecasted Estimates (Till 2035) (USD Billion)
- Figure 27.3 Biologics Fill / Finish Manufacturing Market in Canada, Historical Trends (Since 2018) and Forecasted Estimates (Till 2035) (USD Billion)
- Figure 27.4 Biologics Fill / Finish Manufacturing Market in Mexico, Historical Trends (Since 2018) and Forecasted Estimates (Till 2035) (USD Billion)
- Figure 28.1 Biologics Fill / Finish Manufacturing Market in Europe, Historical Trends (Since 2018) and Forecasted Estimates (Till 2035) (USD Billion)
- Figure 28.2 Biologics Fill / Finish Manufacturing Market in Germany, Historical Trends (Since 2018) and Forecasted Estimates (Till 2035) (USD Billion)
- Figure 28.3 Biologics Fill / Finish Manufacturing Market in France, Historical Trends (Since 2018) and Forecasted Estimates (Till 2035) (USD Billion)
- Figure 28.4 Biologics Fill / Finish Manufacturing Market in the UK, Historical Trends (Since 2018) and Forecasted Estimates (Till 2035) (USD Billion)
- Figure 28.5 Biologics Fill / Finish Manufacturing Market in Switzerland, Historical Trends (Since 2018) and Forecasted Estimates (Till 2035) (USD Billion)
- Figure 28.6 Biologics Fill / Finish Manufacturing Market in Belgium, Historical Trends (Since 2018) and Forecasted Estimates (Till 2035) (USD Billion)
- Figure 28.7 Biologics Fill / Finish Manufacturing Market in Italy, Historical Trends (Since 2018) and Forecasted Estimates (Till 2035) (USD Billion)
- Figure 28.8 Biologics Fill / Finish Manufacturing Market in Austria, Historical Trends (Since 2018) and Forecasted Estimates (Till 2035) (USD Billion)
- Figure 28.9 Biologics Fill / Finish Manufacturing Market in Spain, Historical Trends (Since 2018) and Forecasted Estimates (Till 2035) (USD Billion)
- Figure 28.10 Biologics Fill / Finish Manufacturing Market in Netherlands, Historical Trends (Since 2018) and Forecasted Estimates (Till 2035) (USD Billion)
- Figure 28.11 Biologics Fill / Finish Manufacturing Market in Poland, Historical Trends (Since 2018) and Forecasted Estimates (Till 2035) (USD Billion)
- Figure 28.12 Biologics Fill / Finish Manufacturing Market in Portugal, Historical Trends (Since 2018) and Forecasted Estimates (Till 2035) (USD Billion)
- Figure 28.13 Biologics Fill / Finish Manufacturing Market in Rest of Europe, Historical Trends (Since 2018) and Forecasted Estimates (Till 2035) (USD Billion)
- Figure 29.1 Biologics Fill / Finish Manufacturing Market in Asia Pacific, Historical Trends (Since 2018) and Forecasted Estimates (Till 2035) (USD Billion)
- Figure 29.2 Biologics Fill / Finish Manufacturing Market in China, Historical Trends (Since 2018) and Forecasted Estimates (Till 2035) (USD Billion)
- Figure 29.3 Biologics Fill / Finish Manufacturing Market in India, Historical Trends (Since 2018) and Forecasted Estimates (Till 2035) (USD Billion)
- Figure 29.4 Biologics Fill / Finish Manufacturing Market in South Korea, Historical Trends (Since 2018) and Forecasted Estimates (Till 2035) (USD Billion)
- Figure 29.5 Biologics Fill / Finish Manufacturing Market in Japan, Historical Trends (Since 2018) and Forecasted Estimates (Till 2035) (USD Billion)
- Figure 29.6 Biologics Fill / Finish Manufacturing Market in Singapore, Historical Trends (Since 2018) and Forecasted Estimates (Till 2035) (USD Billion)
- Figure 29.7 Biologics Fill / Finish Manufacturing Market in Australia, Historical Trends (Since 2018) and Forecasted Estimates (Till 2035) (USD Billion)
- Figure 29.8 Biologics Fill / Finish Manufacturing Market in Rest of Asia Pacific, Historical Trends (Since 2018) and Forecasted Estimates (Till 2035) (USD Billion)
- Figure 30.1 Biologics Fill / Finish Manufacturing Market in Middle East and North Africa, Historical Trends (Since 2018) and Forecasted Estimates (Till 2035) (USD Billion)
- Figure 30.2 Biologics Fill / Finish Manufacturing Market in Israel, Historical Trends (Since 2018) and Forecasted Estimates (Till 2035) (USD Billion)
- Figure 30.3 Biologics Fill / Finish Manufacturing Market in Bahrain, Historical Trends (Since 2018) and Forecasted Estimates (Till 2035) (USD Billion)
- Figure 30.4 Biologics Fill / Finish Manufacturing Market in Saudi Arabia, Historical Trends (Since 2018) and Forecasted Estimates (Till 2035) (USD Billion)
- Figure 30.5 Biologics Fill / Finish Manufacturing Market in Iran, Historical Trends (Since 2018) and Forecasted Estimates (Till 2035) (USD Billion)
- Figure 31.1 Biologics Fill / Finish Manufacturing Market in Latin America, Historical Trends (Since 2018) and Forecasted Estimates (Till 2035) (USD Billion)
- Figure 31.2 Biologics Fill / Finish Manufacturing Market in South Africa, Historical Trends (Since 2018) and Forecasted Estimates (Till 2035) (USD Billion)
- Figure 31.3 Biologics Fill / Finish Manufacturing Market in Argentina, Historical Trends (Since 2018) and Forecasted Estimates (Till 2035) (USD Billion)
- Figure 33.1 Biologics Manufacturing and Fill / Finish: Key Performance Indicators (KPIs)
- Figure 33.2 Financial Indicators: Comparative Analysis of KPIs Considered by Big Pharma Companies
- Figure 33.3 Financial Indicators: Big Pharma Perspective
- Figure 33.4 Financial Indicators: Contract Manufacturers Perspective
- Figure 33.5 Process and Capability Indicators: Comparative Analysis of KPI of Big Pharma Companies
- Figure 33.6 Process/ Capability-related Indicators: Big Pharma Perspective
- Figure 33.7 Process/ Capability-related Indicators: Contract Manufacturers Perspective
- Figure 33.8 Market Reputation Indicators: Comparative Analysis of KPI of Big Pharma Companies
- Figure 33.9 Market Reputation-related Indicators: Big Pharma Perspective
- Figure 33.10 Market Reputation-related Indicators: Contract Manufacturers Perspective
- Figure 33.11 Other Important Performance Indicators: Contract Manufacturers Perspective
- Figure 34.1 Key Considerations for Selecting a Robotic System
- Figure 34.2 Advantages of Robotic Systems in Fill / Finish Operations
- Figure 35.1 Key Drivers of Ready-to-Use Platform
- Figure 37.1 Report Conclusion: Market Landscape
- Figure 37.2 Report Conclusion: Partnerships and Collaborations
- Figure 37.3 Report Conclusion: Recent Expansions
- Figure 37.4 Report Conclusion: Capacity Analysis
- Figure 37.5 Report Conclusion: Demand Analysis
- Figure 37.6 Report Conclusion: Market Forecast and Opportunity Analysis (I / II)
- Figure 37.7 Report Conclusion: Market Forecast and Opportunity Analysis (II / II)

