
PUBLISHER: Roots Analysis | PRODUCT CODE: 1869575

PUBLISHER: Roots Analysis | PRODUCT CODE: 1869575
Continuous Manufacturing Market: Industry Trends and Global Forecasts, Till 2035 - Distribution by Drug Molecule, Stage of Bioprocessing, Product Manufactured, Scale of Operation, Purpose of Manufacturing, Company Size, and Key Geographical Regions
CONTINUOUS MANUFACTURING MARKET
The continuous manufacturing market is estimated to reach USD 2.6 billion in the current year and is likely to reach USD 4.2 billion by 2040, representing a higher CAGR of 4.9% during the forecast period.
The market opportunity has been distributed across the following segments:
Type of Drug Molecule
- Biologics
- Small Molecules
Stage of Bioprocessing
- Upstream Bioprocessing
- Downstream Bioprocessing
Type of Product Manufactured
- Active Pharmaceutical Ingredients
- Finished Dosage Forms
Scale of Operation
- Preclinical / Clinical
- Commercial
Purpose of Manufacturing
- In-House Manufacturing
- Contract Manufacturing
- Both
Company Size
- Small
- Mid-sized
- Large
Key Geographical Regions
- North America
- Europe
- Asia-Pacific
CONTINUOUS MANUFACTURING MARKET: GROWTH AND TRENDS
Conventional drug production by pharmaceutical manufacturers is associated with various challenges, including prolonged production timelines, inefficiencies in resource utilization, higher costs, and supply chain complexities. To circumvent the above-mentioned challenges, industry and non-industry players are increasingly investing in R&D initiatives for transforming pharmaceutical manufacturing from batch processes to continuous methods. Among these options, continuous manufacturing has become a highly favored method for large-scale production of biologics and small molecules. Continuous manufacturing helps in generating the desired product through an ongoing process by consistently adding raw materials and reagents during one production cycle. This ongoing process reduces downtime and optimizes equipment usage, resulting in increased efficiency and productivity, lowered unit costs by (~40-50%), and faster drug commercialization.
Additionally, the implementation of continuous manufacturing provides multiple benefits, including enhanced productivity, improved operational efficiency, and uniform product quality. Interestingly, stakeholders are enhancing these procedures by incorporating automation and real-time monitoring, with an aim to minimize human errors and reduce inconsistencies in the process. Furthermore, regulatory agencies, such as the FDA actively endorses continuous manufacturing by providing guidelines that accelerate the approval process for drugs developed through this technique.
High labor expenses, significant downtime, and variability between batches in traditional manufacturing have driven the demand for continuous pharmaceutical production to guarantee consistent product quality and enhanced cost-effectiveness. Moreover, the implementation advanced real-time monitoring and automation technologies has driven pharmaceutical firms to transition from multi-step batch production techniques to fast and efficient continuous manufacturing
CONTINUOUS MANUFACTURING MARKET: KEY INSIGHTS
The report delves into the current state of the continuous manufacturing market and identifies potential growth opportunities within industry. The key takeaways of the report are:
1. The current market landscape of continuous biologic manufacturers is highly fragmented, featuring the presence of both new entrants and established players; majority of these players are based in the US.
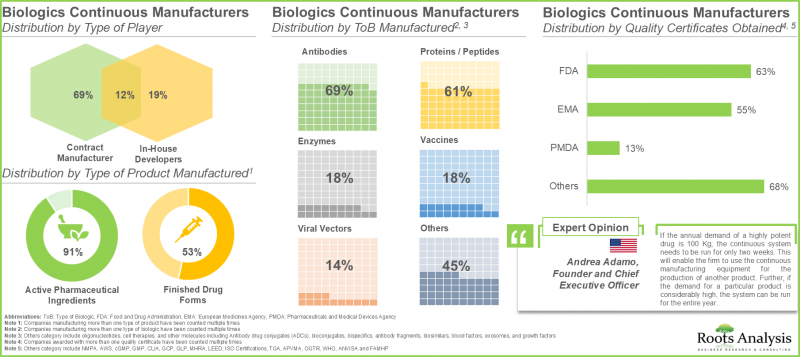
2. More than 45 players offer contract manufacturing services for biologics using continuous manufacturing across the globe; of these, 80% of the players manufacture active pharmaceutical ingredients.
3. Owing to the rising demand for biologics, companies are upgrading their technical expertise in continuous manufacturing techniques to efficiently manufacture high quality products.
4. Close to 50 manufacturers claim to have expertise in continuous manufacturing of small molecules; more than 80% of these players are large and very large firms.
5. Over 80% of the continuous small molecule manufacturers are focused on synthesizing APIs by utilizing flow technology to enhance the safety, efficiency, and cost effectiveness of the production process.
6. Around 55% of the total partnerships and collaborations in the continuous manufacturing domain were inked in past three years; of these, most of the deals were manufacturing agreements.
7. Close to 35% of players have established new facilities; of these, around 50% are focused on both clinical and commercial scale continuous manufacturing of biologics and small molecules.
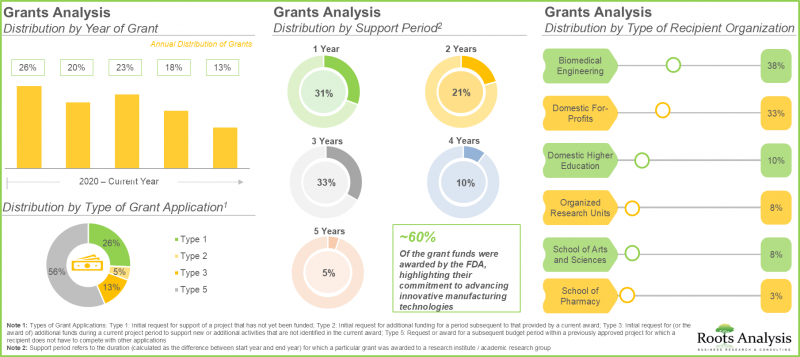
8. Grants worth USD 25 million have been awarded for research related to continuous manufacturing; ~30% of these grants extend a support period of up to three years.
9. Around 80 patents have been granted related to continuous manufacturing since 2020; further, majority of the patents have 17 years left until they lose their exclusivity.
10. Presently, the global installed biologics continuous manufacturing is estimated to be around 225,000 liters; around 40% of this capacity is installed in the facilities of players based in Europe.
11. Across Europe, nearly 50% of the total capacity is housed in large manufacturers' facilities that offer both clinical and commercial scale manufacturing.
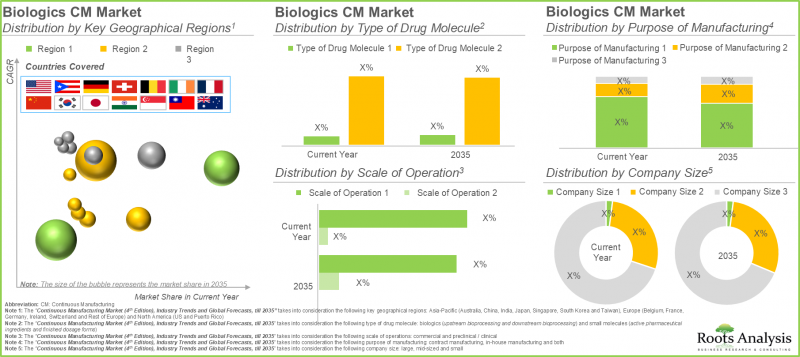
12. The continuous biologics manufacturing market is likely to grow at a CAGR of 4.9%, till 2035; presently, majority of the market share is occupied by upstream bioprocessing followed by downstream bioprocessing
13. In the current year, small molecules account for over 65% of the overall continuous manufacturing market; By 2035, North America is expected to capture the majority share, exceeding 90% of the market.
CONTINUOUS MANUFACTURING MARKET: KEY SEGMENTS
Small Molecule Segment Holds the Largest Share of the Continuous Manufacturing Market
The continuous manufacturing market is segmented across biologics and small molecules. In the current year, small molecules segment captures the majority of the market share (>65%). This can be attributed to the simple production process of small molecules due to its chemical nature, in comparison to biologics, that require more complex extraction procedures from living cells. It is important to highlight that the biologics segment is likely to grow at a higher CAGR during the forecast period, driven by several advantages, such as high target specificity and fewer drug interactions which facilitate their application in treating various disorders, including cancer and rare disorders.
Upstream Bioprocessing is the Most Used Stage of Continuous Manufacturing Market
The global market by stage of continuous manufacturing is segmented across upstream bioprocessing and downstream bioprocessing. Based on our findings, the upstream bioprocessing holds the major share (~95%) in the current year. Upstream processing lays the foundation for downstream processing, which involves purification and formulation of the final product. Thus, efficiency and quality of the upstream processes significantly influence the yield and quality of the final product.
Finished Dosage Forms Dominates the Largest Share of the Continuous Manufacturing Market
The small molecules continuous manufacturing market based on products manufactured is segmented across active pharmaceutical ingredients and finished dosage forms. Finished dosage forms hold the largest share (~65%) in the present year. This is a result of the increase in the approvals for the commercialization of finished doses to end-user. Further, active pharmaceutical ingredients segment shows higher growth potential, during the forecast period.
Commercial Scale Segment Holds the Largest Share of the Continuous Manufacturing Market
In terms of scale of operation, the continuous manufacturing market is segmented across preclinical / clinical and commercial operations. It is worth highlighting that the commercial scale of operation for biologics and small molecules captures majority of the continuous manufacturing market share (~90%), currently. Owing to the increased industrial adoption of perfusion based continuous bioprocessing technologies, these technologies are preferred option for manufacturing of biologic APIs that are unstable under production conditions. Moreover, incorporation of these processes in the current workflow enables regular separation of the final product from by-products that may cause degradation.
Contract Manufacturing Segment Dominates the Continuous Manufacturing Market
In terms of purpose of manufacturing, the continuous manufacturing market is segmented across in-house manufacturing, contract manufacturing and both. It is worth highlighting that the contract manufacturing segment dominates (>70%) the market for both biologics and small molecules in the current year. This is due to the enhanced capability of contract manufacturers in delivering customized solutions, enabling manufacturers to concentrate on their core strengths instead of allocating resources to establish their own manufacturing facilities for the production process Further, in-house manufacturing segment is likely to grow at a higher CAGR during the forecast period.
By Company Size, Large Players Holds the Largest Share of the Continuous Manufacturing Market
In terms of company size, the continuous manufacturing market is based on the company size, such small, mid-sized and large. Large company segments hold majority continuous manufacturing market size (with >70% share) in 2025. This is a result of dedicated resources and capabilities with the large biologics / small molecule manufacturers which allows for rapid implementation of market trends in their manufacturing workflow as compared to mid-sized or small manufacturers. Further, mid-sized companies are undertaking continuous investments to expand their capabilities and streamline continuous manufacturing operations. As a result, they are likely to grow at a notable growth rate.
Asia-Pacific to Propel in the Continuous Manufacturing Sector in the Coming Years
This segment highlights the distribution of market across various geographies, such as North America, Europe, and Asia-Pacific. As per our findings, Europe is likely to capture majority share in both biologics (~40%) and small molecules (>50%) continuous manufacturing market. This is a result of the efforts of researchers in R&D activities to expedite the implementation of continuous manufacturing technologies across their facilities. It is worth highlighting that the small molecule continuous manufacturing market will grow at a relatively faster pace in Asia-Pacific. This is due to increasing adoption of flexible ecosystem by various industry players to facilitate the implementation of continuous manufacturing technologies and support the development of high-quality pharmaceutical products.
Primary Research Overview
Discussions with multiple stakeholders in this domain influenced the opinions and insights presented in this study. The market report includes detailed transcripts of interviews conducted with the following individuals:
- Founder and Chief Executive Officer, Small Organization, US
- Co-Founder and Chief Business Officer, Mid-sized Organization, US
- Chief Executive Officer, Large Organization, India
- Vice President Process Chemistry and Technology, Very Large Organization, US
- General Site Manager, Small Organization, US
- Technical Project Manager, Continuous Manufacturing and Crystallization, Very Large Organization, UK
Example Players in the Continuous Manufacturing Market
- AbbVie Contract Manufacturing
- Abzena
- AGC Biologics
- Boehringer Ingelheim
- Corden Pharma
- Glatt
- Kaneka
- Phlow
- Wuxi Biologics
CONTINUOUS MANUFACTURING MARKET: RESEARCH COVERAGE
The report on continuous manufacturing market features insights into various sections, including:
- Market Sizing and Opportunity Analysis: An in-depth analysis of current market opportunity and the future growth potential of continuous manufacturing market, focusing on key market segments, including [A] type of drug molecule, [B] stage of bioprocessing, [C] type of product manufactured, and [D] geographical regions.
- Market Landscape: A comprehensive evaluation of service providers engaged in the continuous manufacturing market based on several relevant parameters, such as [A] type of player, [B] scale of operation, [C] type of dosage form, and [D] type of product manufactured, [E] year of establishment, [F] company size, and [G] location of headquarters.
- Company Competitiveness Analysis: An insightful technology competitiveness and benchmarking analysis, based on various relevant parameters, such as [A] company strength, and [B] portfolio strength.
- Company Profiles: Comprehensive profiles of leading service providers, featuring information on [A] company overview, [B] financial information (if available), [C] continuous manufacturing service portfolio, [D] continuous manufacturing facilities, [E] recent developments, and [E] future outlook statements.
- Partnerships and Collaborations: A detailed analysis of partnerships inked between stakeholders in the continuous manufacturing market, based on several relevant parameters, such as [A] year of partnership, [B] type of partnership, [C] type of partner, [D] type of drug molecule, [E] type of product, [F] scale of operation, and [G] geography.
- Recent Expansions: An in-depth analysis of expansions reported in the continuous manufacturing market, based on several relevant parameters, [A] year of expansion, [B] type of expansion, [C] scale of operation, [D] type of drug molecule, [E] type of product, [F] amount invested, and [G] facility area.
- Grant Analysis: A detailed analysis of the various grants reported in the continuous manufacturing domain with relevant information across parameters, such as [A] year of grants award, [B] amount awarded, [C] funding institute center, [D] support period, [E] type of grant application, [F] purpose of grant award, [G] activity code, and [H] study section involved.
- Patent Analysis: A detailed analysis of the various patents filed / granted in the continuous manufacturing domain, based on various mbols, [E] type of applicant, and [F] patent benchmarking analysis. parameters, such as [A] patent publication year, [B] patent application year, [C] patent jurisdiction, [D] CPC Sy
- Gaps Associated with Continuous Bioprocessing: A detailed overview of various technology gaps related to continuous downstream bioprocessing that are currently preventing its implementation, including gaps related to bioburden control, continuous multi-column chromatography, continuous viral inactivation process, continuous viral filtration process, continuous ultrafiltration / diafiltration, continuous buffer supply considerations and continuous monitoring of downstream process.
- Initiatives of Companies with In-House Continuous Capabilities: An overview of various initiatives taken by the leading pharmaceutical companies (in terms of revenues), covering both partnered as well as in-house projects.
- Case Study - Continuous Manufacturing Equipment for Biologics: A case study of the companies offering technologies / equipment that can potentially be used in continuous manufacturing of biologics, providing information on the [A] geographical location of potential stakeholders and [B] the type of technology / equipment provided.
- Case Study - Roadmap for the Adoption of Continuous Manufacturing Processes: A case study on the roadmap for the adoption of continuous manufacturing technique, discussing different strategies that can be followed by the company in order to adopt this technology or transition from batch manufacturing to continuous manufacturing.
- Case Study - Modular Facilities in Pharmaceutical / Biotechnology Industry: A brief description on the concept of modularization, types of modules used in modular buildings and an overview of the modular building construction process
- Capacity Analysis: A detailed analysis on the global installed continuous upstream bioprocessing capacity and global installed continuous small molecule API manufacturing capacity of various small, mid-sized, large, and very large companies engaged in this domain based on parameters such as [A] company size, [B] scale of operation, [C] type of player and [D] key geographical regions.
- Market Impact Analysis: A thorough analysis of various factors, such as [A] drivers, [B] restraints, [C] opportunities, and [D] existing challenges that are likely to impact market growth.
KEY QUESTIONS ANSWERED IN THIS REPORT
- How many companies are currently engaged in this market?
- Which are the leading companies in this market?
- What factors are likely to influence the evolution of this market?
- What is the current and future market size?
- What is the CAGR of this market?
- How is the current and future market opportunity likely to be distributed across key market segments?
REASONS TO BUY THIS REPORT
- The report provides a comprehensive market analysis, offering detailed revenue projections of the overall market and its specific sub-segments. This information is valuable to both established market leaders and emerging entrants.
- Stakeholders can leverage the report to gain a deeper understanding of the competitive dynamics within the market. By analyzing the competitive landscape, businesses can make informed decisions to optimize their market positioning and develop effective go-to-market strategies.
- The report offers stakeholders a comprehensive overview of the market, including key drivers, barriers, opportunities, and challenges. This information empowers stakeholders to stay abreast of market trends and make data-driven decisions to capitalize on growth prospects.
ADDITIONAL BENEFITS
- Complimentary PPT Insights Packs
- Complimentary Excel Data Packs for all Analytical Modules in the Report
- 15% Free Content Customization
- Detailed Report Walkthrough Session with Research Team
- Free Updated report if the report is 6-12 months old or older
TABLE OF CONTENTS
SECTION I: REPORT OVERVIEW
1. PREFACE
- 1.1. Introduction
- 1.2. Market Share Insights
- 1.3. Key Market Insights
- 1.4. Report Coverage
- 1.5. Key Questions Answered
- 1.6. Chapter Outlines
2. RESEARCH METHODOLOGY
- 2.1. Chapter Overview
- 2.2. Research Assumptions
- 2.2.1. Market Landscape and Market Trends
- 2.2.2. Market Forecast and Opportunity Analysis
- 2.2.3. Comparative Analysis
- 2.3. Database Building
- 2.3.1. Data Collection
- 2.3.2. Data Validation
- 2.3.3. Data Analysis
- 2.4. Project Methodology
- 2.4.1. Secondary Research
- 2.4.1.1. Annual Reports
- 2.4.1.2. Academic Research Papers
- 2.4.1.3. Company Websites
- 2.4.1.4. Investor Presentations
- 2.4.1.5. Regulatory Filings
- 2.4.1.6. White Papers
- 2.4.1.7. Industry Publications
- 2.4.1.8. Conferences and Seminars
- 2.4.1.9. Government Portals
- 2.4.1.10. Media and Press Releases
- 2.4.1.11. Newsletters
- 2.4.1.12. Industry Databases
- 2.4.1.13. Roots Proprietary Databases
- 2.4.1.14. Paid Databases and Sources
- 2.4.1.15. Social Media Portals
- 2.4.1.16. Other Secondary Sources
- 2.4.2. Primary Research
- 2.4.2.1. Types of Primary Research
- 2.4.2.1.1. Qualitative Research
- 2.4.2.1.2. Quantitative Research
- 2.4.2.1.3. Hybrid Approach
- 2.4.2.2. Advantages of Primary Research
- 2.4.2.3. Techniques for Primary Research
- 2.4.2.3.1. Interviews
- 2.4.2.3.2. Surveys
- 2.4.2.3.3. Focus Groups
- 2.4.2.3.4. Observational Research
- 2.4.2.3.5. Social Media Interactions
- 2.4.2.4. Key Opinion Leaders Considered in Primary Research
- 2.4.2.4.1. Company Executives (CXOs)
- 2.4.2.4.2. Board of Directors
- 2.4.2.4.3. Company Presidents and Vice Presidents
- 2.4.2.4.4. Research and Development Heads
- 2.4.2.4.5. Technical Experts
- 2.4.2.4.6. Subject Matter Experts
- 2.4.2.4.7. Scientists
- 2.4.2.4.8. Doctors and Other Healthcare Providers
- 2.4.2.5. Ethics and Integrity
- 2.4.2.5.1. Research Ethics
- 2.4.2.5.2. Data Integrity
- 2.4.2.1. Types of Primary Research
- 2.4.3. Analytical Tools and Databases
- 2.4.1. Secondary Research
- 2.5. Robust Quality Control
3. MARKET DYNAMICS
- 3.1. Chapter Overview
- 3.2. Forecast Methodology
- 3.2.1. Top-down Approach
- 3.2.2. Bottom-up Approach
- 3.2.3. Hybrid Approach
- 3.3. Market Assessment Framework
- 3.3.1. Total Addressable Market (TAM)
- 3.3.2. Serviceable Addressable Market (SAM)
- 3.3.3. Serviceable Obtainable Market (SOM)
- 3.3.4. Currently Acquired Market (CAM)
- 3.4. Forecasting Tools and Techniques
- 3.4.1. Qualitative Forecasting
- 3.4.2. Correlation
- 3.4.3. Regression
- 3.4.4. Extrapolation
- 3.4.5. Convergence
- 3.4.6. Sensitivity Analysis
- 3.4.7. Scenario Planning
- 3.4.8. Data Visualization
- 3.4.9. Time Series Analysis
- 3.4.10. Forecast Error Analysis
- 3.5. Key Considerations
- 3.5.1. Demographics
- 3.5.2. Government Regulations
- 3.5.3. Reimbursement Scenarios
- 3.5.4. Market Access
- 3.5.5. Supply Chain
- 3.5.6. Industry Consolidation
- 3.5.7. Pandemic / Unforeseen Disruptions Impact
- 3.6. Limitations
4. MACRO-ECONOMIC INDICATORS
- 4.1. Chapter Overview
- 4.2. Market Dynamics
- 4.2.1. Time Period
- 4.2.1.1. Historical Trends
- 4.2.1.2. Current and Forecasted Estimates
- 4.2.2. Currency Coverage
- 4.2.2.1. Major Currencies Affecting the Market
- 4.2.2.2. Factors Affecting Currency Fluctuations
- 4.2.2.3. Impact of Currency Fluctuations on the Industry
- 4.2.3. Foreign Currency Exchange Rate
- 4.2.3.1. Impact of Foreign Exchange Rate Volatility on the Market
- 4.2.3.2. Strategies for Mitigating Foreign Exchange Risk
- 4.2.4. Recession
- 4.2.4.1. Assessment of Current Economic Conditions and Potential Impact on the Market
- 4.2.4.2. Historical Analysis of Past Recessions and Lessons Learnt
- 4.2.5. Inflation
- 4.2.5.1. Measurement and Analysis of Inflationary Pressures in the Economy
- 4.2.5.2. Potential Impact of Inflation on the Market Evolution
- 4.2.6. Interest Rates
- 4.2.6.1. Interest Rates and Their Impact on the Market
- 4.2.6.2. Strategies for Managing Interest Rate Risk
- 4.2.7. Commodity Flow Analysis
- 4.2.7.1. Type of Commodity
- 4.2.7.2. Origins and Destinations
- 4.2.7.3. Values and Weights
- 4.2.7.4. Modes of Transportation
- 4.2.8. Global Trade Dynamics
- 4.2.8.1. Import Scenario
- 4.2.8.2. Export Scenario
- 4.2.8.3. Trade Policies
- 4.2.8.4. Strategies for Mitigating the Risks Associated with Trade Barriers
- 4.2.8.5. Impact of Trade Barriers on the Market
- 4.2.9. War Impact Analysis
- 4.2.9.1. Russian-Ukraine War
- 4.2.9.2. Israel-Hamas War
- 4.2.10. COVID Impact / Related Factors
- 4.2.10.1. Global Economic Impact
- 4.2.10.2. Industry-specific Impact
- 4.2.10.3. Government Response and Stimulus Measures
- 4.2.10.4. Future Outlook and Adaptation Strategies
- 4.2.11. Other Indicators
- 4.2.11.1. Fiscal Policy
- 4.2.11.2. Consumer Spending
- 4.2.11.3. Gross Domestic Product (GDP)
- 4.2.11.4. Employment
- 4.2.11.5. Taxes
- 4.2.11.6. Stock Market Performance
- 4.2.11.7. Cross-Border Dynamics
- 4.2.1. Time Period
- 4.3. Conclusion
SECTION II: QUALITATIVE INSIGHTS
5. EXECUTIVE SUMMARY
6. INTRODUCTION
- 6.1. Chapter Overview
- 6.2. Historical Evolution of Continuous Manufacturing
- 6.3. Continuous Manufacturing in the Pharmaceutical Industry
- 6.3.1. Regulatory Landscape
- 6.3.2. Early Adopters of Continuous Manufacturing
- 6.3.3. Anticipated Shift to Continuous Manufacturing
- 6.3.4. Batch Manufacturing versus Continuous Manufacturing
- 6.3.5. Key Challenges Associated with Continuous Manufacturing
- 6.3.6. Future Perspectives
SECTION III: MARKET OVERVIEW
7. MARKET LANDSCAPE: BIOLOGICS CONTINUOUS MANUFACTURERS
- 7.1. Chapter Overview
- 7.2. Biologics Continuous Manufacturers: Overall Market Landscape
- 7.2.1. Analysis by Year of Establishment
- 7.2.2. Analysis by Company Size
- 7.2.3. Analysis by Location of Headquarters
- 7.2.4. Analysis by Type of Player
- 7.2.5. Analysis by Scale of Operation
- 7.2.6. Analysis by Type of Biologic Manufactured
- 7.2.7. Analysis by Type of Product Manufactured
- 7.2.8. Analysis by Location of Continuous Manufacturing Facilities
- 7.2.9. Analysis by Type of Continuous Manufacturing Facility
- 7.2.10. Analysis by Stage of Bioprocessing
- 7.2.11. Analysis by Stage of Upstream Bioprocessing
- 7.2.12. Analysis by Stage of Downstream Bioprocessing
- 7.2.13. Analysis by Quality Certificates Obtained
- 7.2.14. Analysis by Range of Installed Capacity
8. COMPANY COMPETITIVENESS ANALYSIS: CONTINUOUS BIOLOGIC MANUFACTURERS
- 8.1. Chapter Overview
- 8.2. Assumptions and Key Parameters
- 8.3. Methodology
- 8.4. Company Competitiveness Analysis: Continuous Biologics Manufacturers
- 8.4.1. Biologics Continuous Manufacturers based in North America
- 8.4.2. Biologics Continuous Manufacturers based in Europe
- 8.4.3. Biologics Continuous Manufacturers based in Asia-Pacific
9. MARKET LANDSCAPE: SMALL MOLECULES CONTINUOUS MANUFACTURERS
- 9.1. Chapter Overview
- 9.2. Small Molecule Continuous Manufacturers: Overall Market Landscape
- 9.2.1. Analysis by Year of Establishment
- 9.2.2. Analysis by Company Size
- 9.2.3. Analysis by Location of Headquarters
- 9.2.4. Analysis by Type of Player
- 9.2.5. Analysis by Scale of Operation
- 9.2.6. Analysis by Type of Dosage Form
- 9.2.7. Analysis by Type of Product Manufactured
- 9.2.8. Analysis by Location of Continuous Manufacturing Facilities
- 9.2.9. Analysis by Type of Continuous Manufacturing Process
- 9.2.10. Analysis by Stage of API Manufacturing
- 9.2.11. Analysis by Stage of FDF Manufacturing
- 9.2.12. Analysis by Quality Certificates Obtained
10. COMPANY COMPETITIVENESS ANALYSIS: CONTINUOUS SMALL MOLECULE MANUFACTURERS
- 10.1. Chapter Overview
- 10.2. Assumptions and Key Parameters
- 10.3. Methodology
- 10.4. Company Competitiveness Analysis: Continuous Small Molecule Manufacturers
- 10.4.1. Small Molecules Continuous Manufacturers based in North America
- 10.4.2. Small Molecules Continuous Manufacturers based in Europe
- 10.4.3. Small Molecules Continuous Manufacturers based in Asia-Pacific
SECTION IV: COMPANY PROFILES
11. COMPANY PROFILES: CONTINUOUS MANUFACTURING SERVICE PROVIDERS BASED IN NORTH AMERICA
- 11.1. Chapter Overview
- 11.2. AbbVie Contract Manufacturing
- 11.2.1. Company Overview
- 11.2.2. Financial Information
- 11.2.3. Continuous Manufacturing Service Portfolio
- 11.2.4. Continuous Manufacturing Facilities
- 11.2.5. Recent Developments and Future Outlook
- 11.3. Abzena
- 11.3.1. Company Overview
- 11.3.2. Continuous Manufacturing Service Portfolio
- 11.3.3. Continuous Manufacturing Facilities
- 11.3.4. Recent Developments and Future Outlook
- 11.4. AGC Biologics
- 11.4.1. Company Overview
- 11.4.2. Financial Information
- 11.4.3. Continuous Manufacturing Service Portfolio
- 11.4.4. Continuous Manufacturing Facilities
- 11.4.5. Recent Developments and Future Outlook
- 11.5. Phlow
- 11.5.1. Company Overview
- 11.5.2. Continuous Manufacturing Service Portfolio
- 11.5.3. Continuous Manufacturing Facilities
- 11.5.4. Recent Developments and Future Outlook
12. COMPANY PROFILES: CONTINUOUS MANUFACTURING SERVICE PROVIDERS BASED IN EUROPE
- 12.1. Chapter Overview
- 12.2. Boehringer Ingelheim
- 12.2.1. Company Overview
- 12.2.2. Financial Information
- 12.2.3. Continuous Manufacturing Service Portfolio
- 12.2.4. Continuous Manufacturing Facilities
- 12.2.5. Recent Developments and Future Outlook
- 12.3. Corden Pharma
- 12.3.1. Company Overview
- 12.3.2. Continuous Manufacturing Service Portfolio
- 12.3.3. Continuous Manufacturing Facilities
- 12.3.4. Recent Developments and Future Outlook
- 12.4. Glatt
- 12.4.1. Company Overview
- 12.4.2. Continuous Manufacturing Service Portfolio
- 12.4.3. Continuous Manufacturing Facilities
- 12.4.4. Recent Developments and Future Outlook
13. COMPANY PROFILES: CONTINUOUS MANUFACTURING SERVICE PROVIDERS BASED IN ASIA-PACIFIC
- 13.1. Chapter Overview
- 13.2. Kaneka
- 13.2.1. Company Overview
- 13.2.2. Financial Information
- 13.2.3. Continuous Manufacturing Service Portfolio
- 13.2.4. Continuous Manufacturing Facilities
- 13.2.5. Recent Developments and Future Outlook
- 13.3. WuXi Biologics
- 13.3.1. Company Overview
- 13.3.2. Financial Information
- 13.3.3. Continuous Manufacturing Service Portfolio
- 13.3.4. Continuous Manufacturing Facilities
- 13.3.5. Recent Developments and Future Outlook
SECTION V: MARKET TRENDS
14. PARTNERSHIPS AND COLLABORATIONS
- 14.1. Chapter Overview
- 14.2. Partnership Models
- 14.3. Continuous Manufacturing: Partnerships and Collaborations
- 14.3.1. Analysis by Year of Partnership
- 14.3.2. Analysis by Type of Partnership
- 14.3.3. Analysis by Year and Type of Partnership
- 14.3.4. Analysis by Type of Partner
- 14.3.5. Analysis by Type of Drug Molecule
- 14.3.6. Analysis by Type of Product
- 14.3.7. Analysis by Scale of Operation
- 14.3.8. Most Active Players: Analysis by Number of Partnerships
- 14.3.9. Analysis by Geography
- 14.3.9.1. Analysis by Country
- 14.3.9.2. Analysis by Continent
15. RECENT EXPANSIONS
- 15.1. Chapter Overview
- 15.2. Continuous Manufacturing: Recent Expansions
- 15.2.1. Analysis by Year of Expansion
- 15.2.2. Analysis by Type of Expansion
- 15.2.3. Analysis by Year and Type of Expansion
- 15.2.4. Analysis by Scale of Operation
- 15.2.5. Analysis by Type of Expansion and Scale of Operation
- 15.2.6. Analysis by Type of Drug Molecule
- 15.2.7. Analysis by Type of Expansion and Type of Drug Molecule
- 15.2.8. Analysis by Type of Product
- 15.2.9. Analysis by Amount Invested
- 15.2.10. Analysis by Facility Area
- 15.2.11. Most Active Players: Analysis by Number of Recent Expansions
- 15.2.12. Analysis by Location of Expansion
- 15.2.12.1. Analysis by Country
- 15.2.12.2. Analysis by Continent
- 15.2.13. Analysis by Location of Expansion (Continent) and Type of Expansion
16. GRANT ANALYSIS
- 16.1. Chapter Overview
- 16.2. Scope and Methodology
- 16.3. Continuous Manufacturing: Grants Analysis
- 16.3.1. Analysis by Year of Grants Award
- 16.3.2. Analysis by Amount Awarded
- 16.3.3. Analysis by Funding Institute Center
- 16.3.4. Analysis by Support Period
- 16.3.5. Analysis by Type of Grant Application
- 16.3.6. Analysis by Purpose of Grant Award
- 16.3.7. Analysis by Activity Code
- 16.3.8. Analysis by Study Section Involved
- 16.3.9. Popular NIH Departments: Analysis by Number of Grants
- 16.3.10. Analysis by Type of Recipient Organization
- 16.3.11. Prominent Program Officers: Analysis by Number of Grants
- 16.3.12. Popular Recipient Organizations: Analysis by Number of Grants
- 16.3.13. Popular Recipient Organizations: Analysis by Grant Amount
- 16.3.14. Analysis by Region of Recipient Organization
17. PATENT ANALYSIS
- 17.1. Chapter Overview
- 17.2. Scope and Methodology
- 17.3. Continuous Manufacturing: Patent Analysis
- 17.3.1. Analysis by Patent Publication Year
- 17.3.2. Analysis by Type of Patent and Publication Year
- 17.3.3. Analysis by Patent Application Year
- 17.3.4. Analysis by Patent Jurisdiction
- 17.3.5. Analysis by CPC Symbols
- 17.3.6. Analysis by Type of Applicant
- 17.3.7. Leading Industry Players: Analysis by Number of Patents
- 17.3.8. Leading Non-Industry Players: Analysis by Number of Patents
- 17.4. Patent Benchmarking Analysis
- 17.4.1. Analysis by Patent Characteristics
- 17.5. Patent Valuation
- 17.6. Leading Patents by Number of Citations
18. GAPS ASSOCIATED WITH CONTINUOUS BIOPROCESSING
- 18.1. Chapter Overview
- 18.2. Technological Gaps in Continuous Bioprocessing
- 18.2.1. Gaps related to Bioburden Control
- 18.2.2. Gaps related to Continuous Multi Column Chromatography
- 18.2.2.1. Continuous Chromatography Systems
- 18.2.2.2. Continuous Protein A Chromatography
- 18.2.2.3. Continuous Anion Exchange Chromatography
- 18.2.2.4. Continuous Flow-Through Processing
- 18.2.2.5. Continuous Chromatography Media
- 18.2.3. Gaps related to Continuous Viral Inactivation
- 18.2.3.1. Continuous Viral Inactivation in a Tubular Reactor
- 18.2.3.2. Continuous Viral Inactivation Through Column Chromatography
- 18.2.3.3. Continuous Viral Inactivation using Alternating Hold-Bags
- 18.2.4. Gaps related to Continuous Viral Filtration
- 18.2.5. Gaps related to Continuous Ultrafiltration / Diafiltration
- 18.2.6. Gaps related to Continuous Buffer Supply
- 18.2.7. Gaps related to Continuous On-line Monitoring
- 18.3. Other Gaps Associated with Continuous Bioprocessing
- 18.3.1. Gaps Related to Single-Use Technologies
- 18.3.2. Gaps Related to Process Automation
- 18.3.3. Regulatory Requirements
- 18.4. Concluding Remarks
19. INITIATIVES OF COMPANIES WITH IN-HOUSE CONTINUOUS CAPABILITIES
- 19.1. Chapter Overview
- 19.2. Continuous Manufacturing Initiatives undertaken by Leading Companies
- 19.2.1. Amgen
- 19.2.1.1. In-House Initiatives
- 19.2.2. Boehringer Ingelheim
- 19.2.2.1. In-House Initiatives
- 19.2.3. Bristol-Myers Squibb
- 19.2.3.1. In-House Initiatives
- 19.2.3.2. Partnered Initiatives
- 19.2.4. GSK
- 19.2.4.1. In-House Initiatives
- 19.2.4.2. Partnered Initiatives
- 19.2.5. Merck KGaA
- 19.2.5.1. In-House Initiatives
- 19.2.5.2. Partnered Initiatives
- 19.2.6. Novartis
- 19.2.6.1. In-House Initiatives
- 19.2.6.2. Partnered Initiatives
- 19.2.7. Pfizer
- 19.2.7.1. In-House Initiatives
- 19.2.7.2. Partnered Initiatives
- 19.2.8. Sanofi
- 19.2.8.1. In-House Initiatives
- 19.2.8.2. Partnered Initiatives
- 19.2.1. Amgen
20. CASE STUDY 1: CONTINUOUS MANUFACTURING EQUIPMENT FOR BIOLOGICS
- 20.1. Chapter Overview
- 20.2. Biologics Continuous Manufacturing Equipment: Overall Market Landscape
- 20.2.1. Analysis by Type of Equipment
- 20.2.2. Analysis by Type of Manufacturing Process
- 20.2.3. Analysis by Stage of Bioprocessing
- 20.2.4. Analysis by Scale of Operation
- 20.3. Biologics Continuous Manufacturing Equipment: Developer Landscape
- 20.3.1. Analysis by Year of Establishment
- 20.3.2. Analysis by Company Size
- 20.3.3. Analysis by Location of Headquarters
- 20.3.4. Most Active Players: Analysis by Number of Biologics Continuous Manufacturing Equipment Offered
21. CASE STUDY 2: ROADMAP FOR THE ADOPTION OF CONTINUOUS MANUFACTURING PROCESSES
- 21.1. Chapter Overview
- 21.2. Challenges Associated with the Adoption of Continuous Manufacturing Processes
- 21.3. Key Strategies for the Adoption of Continuous Manufacturing Processes
- 21.3.1. Phase I: Process Development and Implementation
- 21.3.2. Phase II: Equipment / Technology Development and Installation
- 21.3.3. Phase III: Facility / Plant Development and Establishment
- 21.3.4. Phase IV: Product Development and Manufacturing
22. CASE STUDY 3: MODULAR FACILITIES IN PHARMACEUTICAL / BIOTECHNOLOGY INDUSTRY
- 22.1. Chapter Overview
- 22.2. Historical Background
- 22.3. The Concept of Modularization
- 22.3.1. Types of Modular Constructs
- 22.3.2. Modular Construction Process
- 22.4. Modular Construction in the Pharmaceutical Industry
- 22.4.1. Advantages of Modular Construction in the Pharmaceutical Industry
- 22.5. Modular Facility Manufacturers
- 22.5.1. Analysis by Type of Industry Served
- 22.5.2. Analysis by Geographical Coverage
- 22.5.3. Analysis by Type of Modular Construction
- 22.6. Modular Pharmaceutical Cleanrooms
- 22.6.1. Cleanroom Classifications and Current Standards
- 22.6.2. Regulations and Standards Concerning Modular Cleanroom Construction
- 22.6.3. Advantages of Modular Cleanrooms
- 22.7. Modular Cleanroom Providers
- 22.7.1. Analysis by Year of Establishment
- 22.7.2. Analysis by Location of Headquarters
- 22.7.3. Analysis by Type of Modular Cleanroom Offered
- 22.8. Conclusion
23. CAPACITY ANALYSIS: CONTINUOUS BIOLOGIC MANUFACTURERS
- 23.1. Chapter Overview
- 23.2. Key Assumptions and Methodology
- 23.2.1. Analysis by Range of Installed Capacity
- 23.2.2. Analysis by Company Size
- 23.2.3. Analysis by Scale of Operation
- 23.2.4. Analysis by Type of Player
- 23.2.5. Analysis by Location of Biologics Continuous Manufacturing Facility
- 23.2.5.1. Analysis of Biologics Continuous Manufacturing Capacity Installed in North America
- 23.2.5.2. Analysis of Biologics Continuous Manufacturing Capacity Installed in Europe
- 23.2.5.3. Analysis of Biologics Continuous Manufacturing Capacity Installed in Asia-Pacific
- 23.2.6. Concluding Remarks
24. CAPACITY ANALYSIS: CONTINUOUS SMALL MOLECULES MANUFACTURERS
- 24.1. Chapter Overview
- 24.2. Key Assumptions and Methodology
- 24.2.1. Analysis by Range of Installed Capacity
- 24.2.2. Analysis by Company Size
- 24.2.3. Analysis by Scale of Operation
- 24.2.4. Analysis by Type of Player
- 24.2.5. Analysis by Location of Small Molecules Continuous Manufacturing Facility
- 24.2.5.1. Analysis of Small Molecules Continuous Manufacturing Capacity Installed in North America
- 24.2.5.2. Analysis of Small Molecules Continuous Manufacturing Capacity Installed in Europe
- 24.2.5.3. Analysis of Small Molecules Continuous Manufacturing Capacity Installed in Asia-Pacific
- 24.2.6. Concluding Remarks
SECTION VI: MARKET FORECAST AND OPPORTUNITY ANALYSIS
25. GLOBAL CONTINUOUS MANUFACTURING MARKET
- 25.1. Chapter Overview
- 25.2. Assumptions and Methodology
- 25.3. Global Continuous Manufacturing Market, Historical Trends (Since 2021) and Forecasted Estimates (Till 2035)
- 25.3.1. Scenario Analysis
- 25.3.1.1. Conservative Scenario
- 25.3.1.2. Optimistic Scenario
- 25.3.1. Scenario Analysis
- 25.4. Key Market Segmentations
26. CONTINUOUS MANUFACTURING MARKET, BY TYPE OF DRUG MOLECULE
- 26.1. Chapter Overview
- 26.2. Key Assumptions and Methodology
- 26.3. Continuous Manufacturing Market: Distribution by Type of Drug Molecule
- 26.3.1. Continuous Manufacturing Market for Biologics, Historical Trends (Since 2021) and Forecasted Estimates (Till 2035)
- 26.3.1.1. Biologics Continuous Manufacturing Market for Upstream Bioprocessing, Historical Trends (Since 2021) and Forecasted Estimates (Till 2035)
- 26.3.1.2. Biologics Continuous Manufacturing Market for Downstream Bioprocessing, Historical Trends (Since 2021) and Forecasted Estimates (Till 2035)
- 26.3.2. Continuous Manufacturing Market for Small Molecules, Historical Trends (Since 2021) and Forecasted Estimates (Till 2035)
- 26.3.2.1. Small Molecules Continuous Manufacturing Market for Active Pharmaceutical Ingredients, Historical Trends (Since 2021) and Forecasted Estimates (Till 2035)
- 26.3.2.2. Small Molecules Continuous Manufacturing Market for Finished Dosage Forms, Historical Trends (Since 2021) and Forecasted Estimates (Till 2035)
- 26.3.1. Continuous Manufacturing Market for Biologics, Historical Trends (Since 2021) and Forecasted Estimates (Till 2035)
- 26.4. Data Triangulation and Validation
27. CONTINUOUS MANUFACTURING MARKET, BY SCALE OF OPERATION
- 27.1. Chapter Overview
- 27.2. Key Assumptions and Methodology
- 27.3. Biologics Continuous Manufacturing Market: Distribution by Scale of Operation
- 27.3.1. Biologics Continuous Manufacturing Market for Preclinical / Clinical Scale Operations, Historical Trends (Since 2021) and Forecasted Estimates (Till 2035)
- 27.3.2. Biologics Continuous Manufacturing Market for Commercial Scale Operations, Historical Trends (Since 2021) and Forecasted Estimates (Till 2035)
- 27.4. Small Molecules Continuous Manufacturing Market: Distribution by Scale of Operation
- 27.4.1. Small Molecules Continuous Manufacturing Market for Preclinical / Clinical Scale Operations, Historical Trends (Since 2021) and Forecasted Estimates (Till 2035)
- 27.4.2. Small Molecules Continuous Manufacturing Market for Commercial Scale Operations, Historical Trends (Since 2021) and Forecasted Estimates (Till 2035)
- 27.5. Data Triangulation and Validation
28. CONTINUOUS MANUFACTURING MARKET, BY PURPOSE OF MANUFACTURING
- 28.1. Chapter Overview
- 28.2. Key Assumptions and Methodology
- 28.3. Biologics Continuous Manufacturing Market: Distribution by Purpose of Manufacturing
- 28.3.1. Biologics Continuous Manufacturing Market for Contract Manufacturing, Historical Trends (Since 2021) and Forecasted Estimates (Till 2035)
- 28.3.2. Biologics Continuous Manufacturing Market for In-house Manufacturing, Historical Trends (Since 2021) and Forecasted Estimates (Till 2035)
- 28.3.3. Biologics Continuous Manufacturing Market for Both, Historical Trends (Since 2021) and Forecasted Estimates (Till 2035)
- 28.4. Small Molecules Continuous Manufacturing Market: Distribution by Purpose of Manufacturing
- 28.4.1. Small Molecules Continuous Manufacturing Market for Contract Manufacturing, Historical Trends (Since 2021) and Forecasted Estimates (Till 2035)
- 28.4.2. Small Molecules Continuous Manufacturing Market In-house Manufacturing, Historical Trends (Since 2021) and Forecasted Estimates (Till 2035)
- 28.4.3. Small Molecules Continuous Manufacturing Market for Both, Historical Trends (Since 2021) and Forecasted Estimates (Till 2035)
- 28.5. Data Triangulation and Validation
29. CONTINUOUS MANUFACTURING MARKET, BY COMPANY SIZE
- 29.1. Chapter Overview
- 29.2. Key Assumptions and Methodology
- 29.3. Biologics Continuous Manufacturing Market: Distribution by Company Size
- 29.3.1. Biologics Continuous Manufacturing Market for Small Companies, Historical Trends (Since 2021) and Forecasted Estimates (Till 2035)
- 29.3.2. Biologics Continuous Manufacturing Market for Mid-sized Companies, Historical Trends (Since 2021) and Forecasted Estimates (Till 2035)
- 29.3.3. Biologics Continuous Manufacturing Market for Large Companies, Historical Trends (Since 2021) and Forecasted Estimates (Till 2035)
- 29.4. Small Molecules Continuous Manufacturing Market: Distribution by Company Size
- 29.4.1. Small Molecules Continuous Manufacturing Market for Small Companies, Historical Trends (Since 2021) and Forecasted Estimates (Till 2035)
- 29.4.2. Small Molecules Continuous Manufacturing Market for Mid-sized Companies, Historical Trends (Since 2021) and Forecasted Estimates (Till 2035)
- 29.4.3. Small Molecules Continuous Manufacturing Market for Large Companies, Historical Trends (Since 2021) and Forecasted Estimates (Till 2035)
- 29.5. Data Triangulation and Validation
30. CONTINUOUS MANUFACTURING MARKET, BY KEY GEOGRAPHICAL REGIONS
- 30.1. Chapter Overview
- 30.2. Key Assumptions and Methodology
- 30.3. Biologics Continuous Manufacturing Market: Distribution by Key Geographical Regions
- 30.3.1. Biologics Continuous Manufacturing Market in North America, Historical Trends (Since 2021) and Forecasted Estimates (Till 2035)
- 30.3.1.1. Biologics Continuous Manufacturing Market in the US, Historical Trends (Since 2021) and Forecasted Estimates (Till 2035)
- 30.3.1.2. Biologics Continuous Manufacturing Market in Puerto Rico, Historical Trends (Since 2021) and Forecasted Estimates (Till 2035)
- 30.3.2. Biologics Continuous Manufacturing Market in Europe, Historical Trends (Since 2021) and Forecasted Estimates (Till 2035)
- 30.3.2.1. Biologics Continuous Manufacturing Market in Germany, Historical Trends (Since 2021) and Forecasted Estimates (Till 2035)
- 30.3.2.2. Biologics Continuous Manufacturing Market in Switzerland, Historical Trends (Since 2021) and Forecasted Estimates (Till 2035)
- 30.3.2.3. Biologics Continuous Manufacturing Market in Belgium, Historical Trends (Since 2021) and Forecasted Estimates (Till 2035)
- 30.3.2.4. Biologics Continuous Manufacturing Market in Ireland, Historical Trends (Since 2021) and Forecasted Estimates (Till 2035)
- 30.3.2.5. Biologics Continuous Manufacturing Market in France, Historical Trends (Since 2021) and Forecasted Estimates (Till 2035)
- 30.3.2.6. Biologics Continuous Manufacturing Market in Rest of Europe, Historical Trends (Since 2021) and Forecasted Estimates (Till 2035)
- 30.3.3. Biologics Continuous Manufacturing Market in Asia-Pacific, Historical Trends (Since 2021) and Forecasted Estimates (Till 2035)
- 30.3.3.1. Biologics Continuous Manufacturing Market in China, Historical Trends (Since 2021) and Forecasted Estimates (Till 2035)
- 30.3.3.2. Biologics Continuous Manufacturing Market in South Korea, Historical Trends (Since 2021) and Forecasted Estimates (Till 2035)
- 30.3.3.3. Biologics Continuous Manufacturing Market in Singapore, Historical Trends (Since 2021) and Forecasted Estimates (Till 2035)
- 30.3.3.4. Biologics Continuous Manufacturing Market in Taiwan, Historical Trends (Since 2021) and Forecasted Estimates (Till 2035)
- 30.3.3.5. Biologics Continuous Manufacturing Market in India, Historical Trends (Since 2021) and Forecasted Estimates (Till 2035)
- 30.3.3.6. Biologics Continuous Manufacturing Market in Japan, Historical Trends (Since 2021) and Forecasted Estimates (Till 2035)
- 30.3.3.7. Biologics Continuous Manufacturing Market in Australia, Historical Trends (Since 2021) and Forecasted Estimates (Till 2035)
- 30.3.1. Biologics Continuous Manufacturing Market in North America, Historical Trends (Since 2021) and Forecasted Estimates (Till 2035)
- 30.4. Small Molecules Continuous Manufacturing Market: Distribution by Key Geographical Regions, 2018, Current Year and 2040
- 30.4.1. Small Molecules Continuous Manufacturing Market in North America, Historical Trends (Since 2021) and Forecasted Estimates (Till 2035)
- 30.4.1.1. Small Molecules Continuous Manufacturing Market in the US, Historical Trends (Since 2021) and Forecasted Estimates (Till 2035)
- 30.4.1.2. Small Molecules Continuous Manufacturing Market in Mexico, Historical Trends (Since 2021) and Forecasted Estimates (Till 2035)
- 30.4.2. Small Molecules Continuous Manufacturing Market in Europe, Historical Trends (Since 2021) and Forecasted Estimates (Till 2035)
- 30.4.2.1. Biologics Continuous Manufacturing Market in Germany, Historical Trends (Since 2021) and Forecasted Estimates (Till 2035)
- 30.4.2.2. Small Molecules Continuous Manufacturing Market in the UK, Historical Trends (Since 2021) and Forecasted Estimates (Till 2035)
- 30.4.2.3. Small Molecules Continuous Manufacturing Market in Italy, Historical Trends (Since 2021) and Forecasted Estimates (Till 2035)
- 30.4.2.4. Small Molecules Continuous Manufacturing Market in Switzerland, Historical Trends (Since 2021) and Forecasted Estimates (Till 2035)
- 30.4.2.5. Small Molecules Continuous Manufacturing Market in France, Historical Trends (Since 2021) and Forecasted Estimates (Till 2035)
- 30.4.2.6. Small Molecules Continuous Manufacturing Market in Belgium, Historical Trends (Since 2021) and Forecasted Estimates (Till 2035)
- 30.4.2.7. Small Molecules Continuous Manufacturing Market in Rest of Europe, Historical Trends (Since 2021) and Forecasted Estimates (Till 2035)
- 30.4.3. Small Molecules Continuous Manufacturing Market in Asia-Pacific, Historical Trends (Since 2021) and Forecasted Estimates (Till 2035)
- 30.4.3.1. Small Molecules Continuous Manufacturing Market in China, Historical Trends (Since 2021) and Forecasted Estimates (Till 2035)
- 30.4.3.2. Small Molecules Continuous Manufacturing Market in Japan, Historical Trends (Since 2021) and Forecasted Estimates (Till 2035)
- 30.4.3.3. Small Molecules Continuous Manufacturing Market in Singapore, Historical Trends (Since 2021) and Forecasted Estimates (Till 2035)
- 30.4.3.4. Small Molecules Continuous Manufacturing Market in South Korea, Historical Trends (Since 2021) and Forecasted Estimates (Till 2035)
- 30.4.3.5. Small Molecules Continuous Manufacturing Market in India, Historical Trends (Since 2021) and Forecasted Estimates (Till 2035)
- 30.4.1. Small Molecules Continuous Manufacturing Market in North America, Historical Trends (Since 2021) and Forecasted Estimates (Till 2035)
- 30.5. Data Triangulation and Validation
SECTION VII: MARKET OPPORTUNITY ANALYSIS WITHIN GEOGRAPHICAL REGIONS
31. MARKET OPPORTUNITY ANALYSIS: NORTH AMERICA
- 31.1. Continuous Manufacturing Market in North America: Distribution by Type of Drug Molecule
- 31.1.1. Continuous Manufacturing Market in North America for Biologics, Historical Trends (Since 2021) and Forecasted Estimates (Till 2035)
- 31.1.1.1. Biologics Continuous Manufacturing Market in North America for Upstream Bioprocessing, Historical Trends (Since 2021) and Forecasted Estimates (Till 2035)
- 31.1.1.2. Biologics Continuous Manufacturing Market in North America for Downstream Bioprocessing, Historical Trends (Since 2021) and Forecasted Estimates (Till 2035)
- 31.1.2. Continuous Manufacturing Market in North America for Small Molecules, Historical Trends (Since 2021) and Forecasted Estimates (Till 2035)
- 31.1.2.1. Small Molecules Continuous Manufacturing Market in North America for Active Pharmaceutical Ingredients, Historical Trends (Since 2021) and Forecasted Estimates (Till 2035)
- 31.1.2.2. Small Molecules Continuous Manufacturing Market in North America for Finished Dosage Forms, Historical Trends (Since 2021) and Forecasted Estimates (Till 2035)
- 31.1.1. Continuous Manufacturing Market in North America for Biologics, Historical Trends (Since 2021) and Forecasted Estimates (Till 2035)
- 31.2. Continuous Manufacturing Market in North America: Distribution by Scale of Operation
- 31.2.1. Biologics Continuous Manufacturing Market in North America for Preclinical / Clinical Scale Operations, Historical Trends (Since 2021) and Forecasted Estimates (Till 2035)
- 31.2.2. Biologics Continuous Manufacturing Market in North America for Commercial Scale Operations, Historical Trends (Since 2021) and Forecasted Estimates (Till 2035)
- 31.2.3. Small Molecules Continuous Manufacturing Market in North America for Preclinical / Clinical Scale Operations, Historical Trends (Since 2021) and Forecasted Estimates (Till 2035)
- 31.2.4. Small Molecules Continuous Manufacturing Market in North America for Commercial Scale Operations, Historical Trends (Since 2021) and Forecasted Estimates (Till 2035)
- 31.3. Continuous Manufacturing Market in North America: Distribution by Purpose of Manufacturing
- 31.3.1. Biologics Continuous Manufacturing Market in North America for Contract Manufacturing, Historical Trends (Since 2021) and Forecasted Estimates (Till 2035)
- 31.3.2. Biologics Continuous Manufacturing Market in North America for In-House Manufacturing, Historical Trends (Since 2021) and Forecasted Estimates (Till 2035)
- 31.3.3. Biologics Continuous Manufacturing Market in North America for Both, Historical Trends (Since 2021) and Forecasted Estimates (Till 2035)
- 31.3.4. Small Molecules Continuous Manufacturing Market in North America for Contract Manufacturing, Historical Trends (Since 2021) and Forecasted Estimates (Till 2035)
- 31.3.5. Small Molecules Continuous Manufacturing Market in North America for In-House Manufacturing, Historical Trends (Since 2021) and Forecasted Estimates (Till 2035)
- 31.3.6. Small Molecules Continuous Manufacturing Market in North America for Both, Historical Trends (Since 2021) and Forecasted Estimates (Till 2035)
- 31.4. Continuous Manufacturing Market in North America: Distribution by Company Size
- 31.4.1. Biologics Continuous Manufacturing Market in North America for Small Companies, Historical Trends (Since 2021) and Forecasted Estimates (Till 2035)
- 31.4.2. Biologics Manufacturing Market in North America for Mid-sized Companies, Historical Trends (Since 2021) and Forecasted Estimates (Till 2035)
- 31.4.3. Biologics Manufacturing Market in North America for Large Companies, Historical Trends (Since 2021) and Forecasted Estimates (Till 2035)
- 31.4.4. Small Molecules Continuous Manufacturing Market in North America for Small Companies, Historical Trends (Since 2021) and Forecasted Estimates (Till 2035)
- 31.4.5. Small Molecules Manufacturing Market in North America for Mid-sized Companies, Historical Trends (Since 2021) and Forecasted Estimates (Till 2035)
- 31.4.6. Small Molecules Manufacturing Market in North America for Large Companies, Historical Trends (Since 2021) and Forecasted Estimates (Till 2035)
32. MARKET OPPORTUNITY ANALYSIS: EUROPE
- 32.1. Continuous Manufacturing Market in Europe: Distribution by Type of Drug Molecule
- 32.1.1. Continuous Manufacturing Market in Europe for Biologics, Historical Trends (Since 2021) and Forecasted Estimates (Till 2035)
- 32.1.1.1. Biologics Continuous Manufacturing Market in Europe for Upstream Bioprocessing, Historical Trends (Since 2021) and Forecasted Estimates (Till 2035)
- 32.1.1.2. Biologics Continuous Manufacturing Market in Europe for Downstream Bioprocessing, Historical Trends (Since 2021) and Forecasted Estimates (Till 2035)
- 32.1.2. Continuous Manufacturing Market in Europe for Small Molecules, Historical Trends (Since 2021) and Forecasted Estimates (Till 2035)
- 32.1.2.1. Small Molecules Continuous Manufacturing Market in Europe for Active Pharmaceutical Ingredients, Historical Trends (Since 2021) and Forecasted Estimates (Till 2035)
- 32.1.1. Continuous Manufacturing Market in Europe for Biologics, Historical Trends (Since 2021) and Forecasted Estimates (Till 2035)
List of Tables
- Table 6.1 Comparison of Batch and Continuous Manufacturing Techniques
- Table 7.1 Biologics Continuous Manufacturers: Information on Year of Establishment, Employee Count, Company Size and Location of Headquarters
- Table 7.2 Biologics Continuous Manufacturers: Information on Scale of Operation, Type of Player, Type of Biologic Manufactured and Type of Product Manufactured
- Table 7.3 Biologics Continuous Manufacturers: Information on Number of Continuous Manufacturing Facilities, Location of the Continuous Manufacturing Facilities and Type of Facility
- Table 7.4 Biologics Continuous Manufacturers: Information on Stage of Bioprocessing, Stage of Upstream Bioprocessing and Stage of Downstream Bioprocessing
- Table 7.5 Biologics Continuous Manufacturers: Information on Type of Upstream Manufacturing Process, Type of Downstream Manufacturing Process, Type of Overall Manufacturing Process and Quality Certificates Obtained
- Table 7.6 Biologics Continuous Manufacturers: Information on Location of Continuous Manufacturing Facility and Installed Capacity
- Table 9.1 Small Molecules Continuous Manufacturers: Information on Year of Establishment, Employee Count, Company Size and Location of Headquarters
- Table 9.2 Small Molecules Continuous Manufacturers: Information on Scale of Operation, Type of Player, Type of Dosage Form and Type of Product Manufactured
- Table 9.3 Small Molecules Continuous Manufacturers: Information on Number of Continuous Manufacturing Facilities and Location of Continuous Manufacturing Facilities
- Table 9.4 Small Molecules Continuous Manufacturers: Information on Stage of Continuous API Manufacturing and Stage of Continuous FDF Manufacturing
- Table 9.5 Small Molecules Continuous Manufacturers: Information on Type of API Manufacturing Process, Type of FDF Manufacturing Process and Quality Certificates Obtained
- Table 11.1 Continuous Manufacturing Market: List of Service Providers based in North America
- Table 11.2 AbbVie Contract Manufacturing: Company Overview
- Table 11.3 AbbVie Contract Manufacturing: Continuous Manufacturing Service Portfolio
- Table 11.4 AbbVie Contract Manufacturing: Continuous Manufacturing Facilities
- Table 11.5 Abzena: Company Overview
- Table 11.6 Abzena: Continuous Manufacturing Service Portfolio
- Table 11.7 Abzena: Continuous Manufacturing Facilities
- Table 11.8 Abzena: Recent Developments and Future Outlook
- Table 11.9 AGC Biologics: Company Overview
- Table 11.10 AGC Biologics: Continuous Manufacturing Service Portfolio
- Table 11.11 AGC Biologics: Continuous Manufacturing Facilities
- Table 11.12 AGC Biologics: Recent Developments and Future Outlook
- Table 11.13 Phlow: Company Overview
- Table 11.14 Phlow: Continuous Manufacturing Service Portfolio
- Table 11.15 Phlow: Continuous Manufacturing Facilities
- Table 11.16 Phlow: Recent Developments and Future Outlook
- Table 12.1 Continuous Manufacturing Market: List of Service Providers based in Europe
- Table 12.2 Boehringer Ingelheim: Company Overview
- Table 12.3 Boehringer Ingelheim: Continuous Manufacturing Service Portfolio
- Table 12.4 Boehringer Ingelheim: Continuous Manufacturing Facilities
- Table 12.5 Boehringer Ingelheim: Recent Developments and Future Outlook
- Table 12.6 Corden Pharma: Company Overview
- Table 12.7 Corden Pharma: Continuous Manufacturing Service Portfolio
- Table 12.8 Corden Pharma: Continuous Manufacturing Facilities
- Table 12.9 Corden Pharma: Recent Developments and Future Outlook
- Table 12.10 Glatt: Company Overview
- Table 12.11 Glatt: Continuous Manufacturing Service Portfolio
- Table 12.12 Glatt: Continuous Manufacturing Facilities
- Table 13.1 Continuous Manufacturing Market: List of Service Providers based in Asia-Pacific
- Table 13.2 Kaneka: Company Overview
- Table 13.3 Kaneka: Continuous Manufacturing Service Portfolio
- Table 13.4 Kaneka: Continuous Manufacturing Facilities
- Table 13.5 WuXi Biologics: Company Overview
- Table 13.6 WuXi Biologics: Continuous Manufacturing Service Portfolio
- Table 13.7 WuXi Biologics: Continuous Manufacturing Facilities
- Table 13.8 WuXi Biologics: Recent Developments and Future Outlook
- Table 14.1 Continuous Manufacturing Market: List of Partnerships and Collaborations, Since Pre-2020
- Table 14.2 Partnerships and Collaborations: Information on Type of Agreement (Country-wise and Region-wise)
- Table 15.1 Continuous Manufacturing Market: List of Recent Expansions, Since 2018
- Table 17.1 Patent Analysis: Top CPC Sections
- Table 17.2 Patent Analysis: Top CPC Symbols
- Table 17.3 Patent Analysis: Top CPC Codes
- Table 17.4 Patent Analysis: Summary of Benchmarking Analysis
- Table 17.5 Patent Analysis: Categorization based on Weighted Valuation Scores
- Table 17.6 Patent Portfolio: List of Leading Patents (by Highest Relative Valuation)
- Table 17.7 Patent Portfolio: List of Leading Patents (by Number of Citations)
- Table 18.1 Overall Gaps and Opportunities Associated with Continuous Manufacturing
- Table 19.1 Amgen: In-House Initiatives
- Table 19.2 Boehringer Ingelheim: In-House Initiatives
- Table 19.3 Bristol-Myers Squibb: In-House Initiatives
- Table 19.4 Bristol-Myers Squibb: Partnered Initiatives
- Table 19.5 GSK: In-House Initiatives
- Table 19.6 GSK: Partnered Initiatives
- Table 19.7 Merck: In-House Initiatives
- Table 19.8 Merck: Partnered Initiatives
- Table 19.9 Novartis: In-House Initiatives
- Table 19.10 Novartis: Partnered Initiatives
- Table 19.11 Pfizer: In-House Initiatives
- Table 19.12 Pfizer: Partnered Initiatives
- Table 19.13 Sanofi: In-House Initiatives
- Table 19.14 Sanofi: Partnered Initiatives
- Table 20.1 Biologics Continuous Manufacturing Equipment: Information on Developer, Type of Equipment, Manufacturing Process, Stage of Bioprocessing and Scale of Operation
- Table 20.2 Biologics Continuous Manufacturing Equipment: List of Developers
- Table 22.1 Modular Facility Manufacturers: Information on Year of Establishment, Company Size and Location of Headquarters
- Table 22.2 Cleanroom Classification Standards
- Table 22.3 ISO and FED STD 209E: Cleanroom Classification
- Table 22.4 Modular Cleanroom Providers: Information on Year of Establishment, Company Size and Location of Headquarters
- Table 23.1 Biologics Continuous Manufacturers: Information on Total Installed Capacity (Sample Data Set)
- Table 23.2 Capacity Analysis: Average Continuous Biologics Manufacturing Capacity by Company Size (Sample Dataset)
- Table 23.3 Global Installed Continuous Bioprocessing Capacity by Company Size (in Liters)
- Table 24.1 Small Molecules Continuous Manufacturers: Information on Total Installed Capacity (Sample Data Set)
- Table 24.2 Capacity Analysis: Average Continuous Small Molecule Manufacturing Capacity by Company Size (Sample Dataset)
- Table 24.3 Annual, Global Installed Continuous Small Molecule Manufacturing Capacity (Kg/Year) by Company Size
- Table 36.1 Biologics Continuous Manufacturers: Distribution by Year of Establishment
- Table 36.2 Biologics Continuous Manufacturers: Distribution by Company Size
- Table 36.3 Biologics Continuous Manufacturers: Distribution by Location of Headquarters
- Table 36.4 Biologics Continuous Manufacturers: Distribution by Type of Player
- Table 36.5 Biologics Continuous Manufacturers: Distribution by Scale of Operation
- Table 36.6 Biologics Continuous Manufacturers: Distribution by Type of Biologic Manufactured
- Table 36.7 Biologics Continuous Manufacturers: Distribution by Type of Product Manufactured
- Table 36.8 Biologics Continuous Manufacturers: Distribution by Location of Continuous Manufacturing Facilities
- Table 36.9 Biologics Continuous Manufacturers: Distribution by Type of Continuous Manufacturing Facility
- Table 36.10 Biologics Continuous Manufacturers: Distribution by Stage of Bioprocessing
- Table 36.11 Biologics Continuous Manufacturers: Distribution by Stage of Upstream Bioprocessing
- Table 36.12 Biologics Continuous Manufacturers: Distribution by Stage of Downstream Bioprocessing
- Table 36.13 Biologics Continuous Manufacturers: Distribution by Quality Certificates Obtained
- Table 36.14 Biologics Continuous Manufacturers: Distribution by Range of Installed Capacity (in Liters)
- Table 36.15 Small Molecules Continuous Manufacturers: Distribution by Year of Establishment
- Table 36.16 Small Molecules Continuous Manufacturers: Distribution by Company Size
- Table 36.17 Small Molecules Continuous Manufacturers: Distribution by Location of Headquarters
- Table 36.18 Small Molecules Continuous Manufacturers: Distribution by Type of Player
- Table 36.19 Small Molecules Continuous Manufacturers: Distribution by Scale of Operation
- Table 36.20 Small Molecules Continuous Manufacturers: Distribution by Type of Dosage Form
- Table 36.21 Small Molecules Continuous Manufacturers: Distribution by Type of Product Manufactured
- Table 36.22 Small Molecules Continuous Manufacturers: Distribution by Location of Continuous Manufacturing Facilities
- Table 36.23 Small Molecules Continuous Manufacturers: Distribution by Type of Continuous Manufacturing Process
- Table 36.24 Small Molecules Continuous Manufacturers: Distribution by Stage of Continuous API Manufacturing
- Table 36.25 Small Molecules Continuous Manufacturers: Distribution by Stage of Continuous FDF Manufacturing
- Table 36.26 Small Molecules Continuous Manufacturers: Distribution by Quality Certificates Obtained
- Table 36.27 AbbVie: Annual Revenues, Consolidated Financial Details, Since FY 2021 (USD Billion)
- Table 36.28 AGC Biologics: Annual Revenues, Consolidated Financial Details, Since FY 2021 (JPY Billion)
- Table 36.29 Boehringer Ingelheim: Annual Revenues, Consolidated Financial Details, Since FY 2021 (EUR Billion)
- Table 36.30 Kaneka: Annual Revenues, Consolidated Financial Details, Since FY 2021 (JPY Billion)
- Table 36.31 WuXi Biologics: Annual Revenues, Consolidated Financial Details, Since FY 2021 (RMB Billion)
- Table 36.32 Partnerships and Collaborations: Cumulative Year-wise Trend, Since Pre-2020
- Table 36.33 Partnerships and Collaborations: Distribution by Type of Partnership
- Table 36.34 Partnerships and Collaborations: Distribution by Year and Type of Partnership, Since Pre-2020
- Table 36.35 Partnerships and Collaborations: Distribution by Type of Partner
- Table 36.36 Partnerships and Collaborations: Distribution by Type of Drug Molecule
- Table 36.37 Partnerships and Collaborations: Distribution by Type of Product
- Table 36.38 Partnerships and Collaborations: Distribution by Scale of Operation
- Table 36.39 Most Active Players: Distribution by Number of Partnerships
- Table 36.40 Partnerships and Collaborations: Local and International Agreements
- Table 36.41 Partnerships and Collaborations: Intracontinental and Intercontinental Agreements
- Table 36.42 Recent Expansions: Cumulative Year-wise Trend, Since 2018
- Table 36.43 Recent Expansions: Distribution by Type of Expansion
- Table 36.44 Recent Expansions: Distribution by Year and Type of Expansion, Since 2018
- Table 36.45 Recent Expansions: Distribution by Scale of Operation
- Table 36.46 Recent Expansions: Distribution by Type of Expansion and Scale of Operation
- Table 36.47 Recent Expansions: Distribution by Type of Drug Molecule
- Table 36.48 Recent Expansions: Distribution by Type of Drug Molecule Manufactured and Type of Expansion
- Table 36.49 Recent Expansions: Distribution by Type of Product
- Table 36.50 Recent Expansions: Distribution by Amount Invested (USD Million)
- Table 36.51 Recent Expansions: Distribution by Facility Area (square feet)
- Table 36.52 Most Active Players: Distribution by Number of Expansions
- Table 36.53 Recent Expansions: Distribution by Location of Expansion (Country)
- Table 36.54 Recent Expansions: Distribution by Location of Expansion (Continent)
- Table 36.55 Recent Expansions: Distribution by Location of Expansion (Continent) and Type of Expansion
- Table 36.56 Grants Analysis: Cumulative Distribution by Year of Grant, Since 2020
- Table 36.57 Grants Analysis: Distribution by Cumulative Amount Awarded (USD Million), Since 2020
- Table 36.58 Grants Analysis: Distribution by Funding Institute Center
- Table 36.59 Grants Analysis: Distribution by Support Period
- Table 36.60 Grants Analysis: Distribution by Type of Grant Application
- Table 36.61 Grants Analysis: Distribution by Purpose of Grant Award
- Table 36.62 Grants Analysis: Distribution by Activity Code
- Table 36.63 Grants Analysis: Distribution by Study Section Involved
- Table 36.64 Popular NIH Departments: Distribution by Number of Grants
- Table 36.65 Grants Analysis: Distribution by Type of Recipient Organization
- Table 36.66 Prominent Program Officers: Distribution by Number of Grants
- Table 36.67 Popular Recipient Organizations: Distribution by Number of Grants
- Table 36.68 Popular Recipient Organizations: Distribution by Grant Amount (USD Million)
- Table 36.69 Grants Analysis: Distribution by Region of Recipient Organization
- Table 36.70 Patent Analysis: Distribution by Type of Patent
- Table 36.71 Patent Analysis: Cumulative Distribution by Patent Publication Year, Since 2020
- Table 36.72 Patent Analysis: Distribution by Type of Patent and Publication Year, Since 2020
- Table 36.73 Patent Analysis: Distribution by Patent Application Year, Since Pre-2019
- Table 36.74 Patent Analysis: Patent Jurisdiction
- Table 36.75 Leading Industry Players: Distribution by Number of Patents
- Table 36.76 Leading Non-Industry Players: Distribution by Number of Patents
- Table 36.77 Patent Analysis: Distribution by Patent Age
- Table 36.78 Continuous Manufacturing: Patent Valuation
- Table 36.79 Biologics Continuous Manufacturing Equipment: Distribution by Type of Equipment
- Table 36.80 Biologics Continuous Manufacturing Equipment: Distribution by Type of Manufacturing Process
- Table 36.81 Biologics Continuous Manufacturing Equipment: Distribution by Stage of Bioprocessing
- Table 36.82 Biologics Continuous Manufacturing Equipment: Distribution by Scale of Operation
- Table 36.83 Biologics Continuous Manufacturing Equipment Providers: Distribution by Year of Establishment
- Table 36.84 Biologics Continuous Manufacturing Equipment Providers: Distribution by Company Size
- Table 36.85 Biologics Continuous Manufacturing Equipment Providers: Distribution by Location of Headquarters
- Table 36.86 Most Active Players: Distribution by Number of Biologics Continuous Manufacturing Equipment Offered
- Table 36.87 Continuous Manufacturing: Phase wise Key Strategies for the Adoption of Continuous Manufacturing Processes
- Table 36.88 Process Development and Implementation (Phase I): Distribution by Type of Strategy Adopted
- Table 36.89 Equipment / Technology Development and Installation (Phase II): Distribution by the Type of Strategy Adopted
- Table 36.90 Facility / Plant Development and Establishment (Phase III): Distribution by the Type of Strategy Adopted
- Table 36.91 Product Development and Manufacturing (Phase IV): Distribution by the Type of Strategy Adopted
- Table 36.92 Modular Construction: Applications
- Table 36.93 Steps Involved in Modular Construction
- Table 36.94 Construction Timeline of Modular and Conventional Buildings
- Table 36.95 Modular Construction: Advantages
- Table 36.96 Modular Facility Manufacturers: Distribution by Type of Industry Served
- Table 36.97 Modular Facility Manufacturers: Distribution by Geographical Coverage
- Table 36.98 Modular Facility Manufacturers: Distribution by Type of Modular Construction
- Table 36.99 Modular Cleanroom Providers: Distribution by Year of Establishment
- Table 36.100 Modular Cleanroom Providers: Distribution by Location of Headquarters
- Table 36.101 Modular Cleanroom Providers: Distribution of Headquarters (Country)
- Table 36.102 Modular Cleanroom Providers: Distribution by Type of Modular Cleanroom Offered
- Table 36.103 Global Installed Continuous Bioprocessing Capacity: Distribution by Range of Installed Capacity (in Liters)
- Table 36.104 Global Installed Continuous Bioprocessing Capacity (in Liters): Distribution by Company Size
- Table 36.105 Global Installed Continuous Bioprocessing Capacity: Distribution by Scale of Operation
- Table 36.106 Global Installed Continuous Bioprocessing Capacity: Distribution by Type of Player
- Table 36.107 Global Installed Continuous Bioprocessing Capacity: Distribution by Location of Continuous Manufacturing Facility
- Table 36.108 Continuous Bioprocessing Capacity Installed in North in North America
- Table 36.109 Continuous Bioprocessing Capacity Installed in Europe
- Table 36.110 Continuous Bioprocessing Capacity Installed in Asia-Pacific
- Table 36.111 Global Installed Continuous Small Molecule Manufacturing Capacity (Kg/Year): Distribution by Range of Installed Capacity
- Table 36.112 Global Installed Continuous Small Molecule Manufacturing Capacity (Kg/ Year): Distribution by Company Size
- Table 36.113 Global Installed Continuous Small Molecule Manufacturing Capacity (Kg/ Year): Distribution by Scale of Operation
- Table 36.114 Global Continuous Small Molecule Manufacturing Capacity: Distribution by Type of Player
- Table 36.115 Global Installed Continuous Small Molecule Manufacturing Capacity: Distribution by Location of Continuous Manufacturing Facility
- Table 36.116 Continuous Small Molecule Manufacturing Capacity Installed in North America
- Table 36.117 Continuous Small Molecule Manufacturing Capacity Installed in Europe
- Table 36.118 Continuous Small Molecule Manufacturing Capacity Installed in Asia-Pacific
- Table 36.119 Global Continuous Manufacturing Market, Historical Trends (Since 2021) and Forecasted Estimates (Till 2035) (USD Million)
- Table 36.120 Global Continuous Manufacturing Market, Forecasted Estimates (Till 2035): Conservative Scenario (USD Million)
- Table 36.121 Global Continuous Manufacturing Market, Forecasted Estimates (Till 2035): Optimistic Scenario (USD Million)
- Table 36.122 Continuous Manufacturing Market: Distribution by Type of Drug Molecule, 2021, 2025 and 2035
- Table 36.123 Continuous Manufacturing Market for Biologics, Historical Trends (Since 2021) and Forecasted Estimates (Till 2035) (USD Million): Conservative, Base and Optimistic Scenarios (USD Billion)
- Table 36.124 Biologics Continuous Manufacturing Market for Upstream Bioprocessing, Historical Trends (Since 2021) and Forecasted Estimates (Till 2035) (USD Million): Conservative, Base and Optimistic Scenarios (USD Billion)
- Table 36.125 Biologics Continuous Manufacturing Market for Downstream Bioprocessing, Historical Trends (Since 2021) and Forecasted Estimates (Till 2035) (USD Million): Conservative, Base and Optimistic Scenarios (USD Billion)
- Table 36.126 Continuous Manufacturing for Small Molecules Market, Historical Trends (Since 2021) and Forecasted Estimates (Till 2035) (USD Million): Conservative, Base and Optimistic Scenarios (USD Billion)
- Table 36.127 Small Molecules Continuous Manufacturing Market for Active Pharmaceutical Ingredients, Historical Trends (Since 2021) and Forecasted Estimates (Till 2035) (USD Million): Conservative, Base and Optimistic Scenarios (USD Billion)
- Table 36.128 Small Molecules Continuous Manufacturing Market for Finished Drug Forms, Historical Trends (Since 2021) and Forecasted Estimates (Till 2035) (USD Million): Conservative, Base and Optimistic Scenarios (USD Billion)
- Table 36.129 Biologics Continuous Manufacturing Market: Distribution by Scale of Operation, 2021, 2025 and 2035
- Table 36.130 Biologics Continuous Manufacturing Market for Preclinical / Clinical Scale Operations, Historical Trends (Since 2021) and Forecasted Estimates (Till 2035) (USD Million): Conservative, Base and Optimistic Scenarios (USD Billion)
- Table 36.131 Biologics Continuous Manufacturing Market for Commercial Scale Operations, Historical Trends (Since 2021) and Forecasted Estimates (Till 2035) (USD Million): Conservative, Base and Optimistic Scenarios (USD Billion)
- Table 36.132 Small Molecules Continuous Manufacturing Market: Distribution by Scale of Operation, 2021, 2025 and 2035
- Table 36.133 Small Molecules Continuous Manufacturing Market for Preclinical / Clinical Scale Operations, Historical Trends (Since 2021) and Forecasted Estimates (Till 2035) (USD Million): Conservative, Base and Optimistic Scenarios (USD Billion)
- Table 36.134 Small Molecules Continuous Manufacturing Market for Commercial Scale Operations, Historical Trends (Since 2021) and Forecasted Estimates (Till 2035) (USD Million): Conservative, Base and Optimistic Scenarios (USD Billion)
- Table 36.135 Biologics Continuous Manufacturing Market: Distribution by Purpose of Manufacturing, 2021, 2025 and 2035
- Table 36.136 Biologics Continuous Manufacturing Market for Contract Manufacturing, Historical Trends (Since 2021) and Forecasted Estimates (Till 2035) (USD Million): Conservative, Base and Optimistic Scenarios (USD Billion)
- Table 36.137 Biologics Continuous Manufacturing Market for In-House Manufacturing, Historical Trends (Since 2021) and Forecasted Estimates (Till 2035) (USD Million): Conservative, Base and Optimistic Scenarios (USD Billion)
- Table 36.138 Biologics Continuous Manufacturing Market for Both, Historical Trends (Since 2021) and Forecasted Estimates (Till 2035) (USD Million): Conservative, Base and Optimistic Scenarios (USD Billion)
- Table 36.139 Small Molecules Continuous Manufacturing Market: Distribution by Purpose of Manufacturing, 2021, 2025 and 2035
- Table 36.140 Small Molecules Continuous Manufacturing Market for Contract Manufacturing, Historical Trends (Since 2021) and Forecasted Estimates (Till 2035) (USD Million): Conservative, Base and Optimistic Scenarios (USD Billion)
- Table 36.141 Small Molecules Continuous Manufacturing Market for In-House Manufacturing, Historical Trends (Since 2021) and Forecasted Estimates (Till 2035) (USD Million): Conservative, Base and Optimistic Scenarios (USD Billion)
- Table 36.142 Small Molecules Continuous Manufacturing Market for Both, Historical Trends (Since 2021) and Forecasted Estimates (Till 2035) (USD Million): Conservative, Base and Optimistic Scenarios (USD Billion)
- Table 36.143 Biologics Continuous Manufacturing Market: Distribution by Company Size, 2021, 2025 and 2035
- Table 36.144 Biologics Continuous Manufacturing Market for Small Companies, Historical Trends (Since 2021) and Forecasted Estimates (Till 2035) (USD Million): Conservative, Base and Optimistic Scenarios (USD Billion)
- Table 36.145 Biologics Continuous Manufacturing Market for Mid-Sized Companies, Historical Trends (Since 2021) and Forecasted Estimates (Till 2035) (USD Million): Conservative, Base and Optimistic Scenarios (USD Billion)
- Table 36.146 Biologics Continuous Manufacturing Market for Large Companies, Historical Trends (Since 2021) and Forecasted Estimates (Till 2035) (USD Million): Conservative, Base and Optimistic Scenarios (USD Billion)
- Table 36.147 Small Molecules Continuous Manufacturing Market: Distribution by Company Size, 2021, 2025 and 2035
- Table 36.148 Small Molecules Continuous Manufacturing Market for Small Companies, Historical Trends (Since 2021) and Forecasted Estimates (Till 2035) (USD Million): Conservative, Base and Optimistic Scenarios (USD Billion)
- Table 36.149 Small Molecules Continuous Manufacturing Market for Mid-Sized Companies, Historical Trends (Since 2021) and Forecasted Estimates (Till 2035) (USD Million): Conservative, Base and Optimistic Scenarios (USD Billion)
- Table 36.150 Small Molecules Continuous Manufacturing Market for Large Companies, Historical Trends (Since 2021) and Forecasted Estimates (Till 2035) (USD Million): Conservative, Base and Optimistic Scenarios (USD Billion)
- Table 36.151 Biologics Continuous Manufacturing Market: Distribution by Key Geographical Regions, 2021, 2025 and 2035
- Table 36.152 Biologics Continuous Manufacturing Market in North America: Historical Trends (Since 2021) and Forecasted Estimates (Till 2035) (USD Million): Conservative, Base and Optimistic Scenarios (USD Billion)
- Table 36.153 Biologics Continuous Manufacturing Market in the US: Historical Trends (Since 2021) and Forecasted Estimates (Till 2035) (USD Million): Conservative, Base and Optimistic Scenarios (USD Billion)
- Table 36.154 Biologics Continuous Manufacturing Market in Puerto Rico: Historical Trends (Since 2021) and Forecasted Estimates (Till 2035) (USD Million): Conservative, Base and Optimistic Scenarios (USD Billion)
- Table 36.155 Biologics Continuous Manufacturing Market in Europe: Historical Trends (Since 2021) and Forecasted Estimates (Till 2035) (USD Million): Conservative, Base and Optimistic Scenarios (USD Billion)
- Table 36.156 Biologics Continuous Manufacturing Market in Germany: Historical Trends (Since 2021) and Forecasted Estimates (Till 2035) (USD Million): Conservative, Base and Optimistic Scenarios (USD Billion)
- Table 36.157 Biologics Continuous Manufacturing Market in Switzerland: Historical Trends (Since 2021) and Forecasted Estimates (Till 2035) (USD Million): Conservative, Base and Optimistic Scenarios (USD Billion)
- Table 36.158 Biologics Continuous Manufacturing Market in Belgium: Historical Trends (Since 2021) and Forecasted Estimates (Till 2035) (USD Million): Conservative, Base and Optimistic Scenarios (USD Billion)
- Table 36.159 Biologics Continuous Manufacturing Market in Ireland: Historical Trends (Since 2021) and Forecasted Estimates (Till 2035) (USD Million): Conservative, Base and Optimistic Scenarios (USD Billion)
- Table 36.160 Biologics Continuous Manufacturing Market in France: Historical Trends (Since 2021) and Forecasted Estimates (Till 2035) (USD Million): Conservative, Base and Optimistic Scenarios (USD Billion)
- Table 36.161 Biologics Continuous Manufacturing Market in Rest of Europe: Historical Trends (Since 2021) and Forecasted Estimates (Till 2035) (USD Million): Conservative, Base and Optimistic Scenarios (USD Billion)
- Table 36.162 Biologics Continuous Manufacturing Market in Asia-Pacific: Historical Trends (Since 2021) and Forecasted Estimates (Till 2035) (USD Million): Conservative, Base and Optimistic Scenarios (USD Billion)
- Table 36.163 Biologics Continuous Manufacturing Market in China: Historical Trends (Since 2021) and Forecasted Estimates (Till 2035) (USD Million): Conservative, Base and Optimistic Scenarios (USD Billion)
- Table 36.164 Biologics Continuous Manufacturing Market in South Korea: Historical Trends (Since 2021) and Forecasted Estimates (Till 2035) (USD Million): Conservative, Base and Optimistic Scenarios (USD Billion)
- Table 36.165 Biologics Continuous Manufacturing Market in Singapore: Historical Trends (Since 2021) and Forecasted Estimates (Till 2035) (USD Million): Conservative, Base and Optimistic Scenarios (USD Billion)
- Table 36.166 Biologics Continuous Manufacturing Market in Taiwan: Historical Trends (Since 2021) and Forecasted Estimates (Till 2035) (USD Million): Conservative, Base and Optimistic Scenarios (USD Billion)
- Table 36.167 Biologics Continuous Manufacturing Market in India: Historical Trends (Since 2021) and Forecasted Estimates (Till 2035) (USD Million): Conservative, Base and Optimistic Scenarios (USD Billion)
- Table 36.168 Biologics Continuous Manufacturing Market in Japan: Historical Trends (Since 2021) and Forecasted Estimates (Till 2035) (USD Million): Conservative, Base and Optimistic Scenarios (USD Billion)
- Table 36.169 Biologics Continuous Manufacturing Market in Australia: Historical Trends (Since 2021) and Forecasted Estimates (Till 2035) (USD Million): Conservative, Base and Optimistic Scenarios (USD Billion)
- Table 36.170 Biologics Continuous Manufacturing Market: Market Movement Analysis
- Table 36.171 Biologics Continuous Manufacturing Market: Penetration Growth (P-G) Matrix
- Table 36.172 Small Molecules Continuous Manufacturing Market: Distribution by Key Geographical Regions, 2021, 2025 and 2035
- Table 36.173 Small Molecules Continuous Manufacturing Market in North America: Historical Trends (Since 2021) and Forecasted Estimates (Till 2035) (USD Million): Conservative, Base and Optimistic Scenarios (USD Billion)
- Table 36.174 Small Molecules Continuous Manufacturing Market in the US: Historical Trends (Since 2021) and Forecasted Estimates (Till 2035) (USD Million): Conservative, Base and Optimistic Scenarios (USD Billion)
- Table 36.175 Small Molecules Continuous Manufacturing Market in Mexico: Historical Trends (Since 2021) and Forecasted Estimates (Till 2035) (USD Million): Conservative, Base and Optimistic Scenarios (USD Billion)
- Table 36.176 Small Molecules Continuous Manufacturing Market in Europe: Historical Trends (Since 2021) and Forecasted Estimates (Till 2035) (USD Million): Conservative, Base and Optimistic Scenarios (USD Billion)
- Table 36.177 Small Molecules Continuous Manufacturing Market in Germany: Historical Trends (Since 2021) and Forecasted Estimates (Till 2035) (USD Million): Conservative, Base and Optimistic Scenarios (USD Billion)
- Table 36.178 Small Molecules Continuous Manufacturing Market in the UK: Historical Trends (Since 2021) and Forecasted Estimates (Till 2035) (USD Million): Conservative, Base and Optimistic Scenarios (USD Billion)
- Table 36.179 Small Molecules Continuous Manufacturing Market in Italy: Historical Trends (Since 2021) and Forecasted Estimates (Till 2035) (USD Million): Conservative, Base and Optimistic Scenarios (USD Billion)
- Table 36.180 Small Molecules Continuous Manufacturing Market in Switzerland: Historical Trends (Since 2021) and Forecasted Estimates (Till 2035) (USD Million): Conservative, Base and Optimistic Scenarios (USD Billion)
- Table 36.181 Small Molecules Continuous Manufacturing Market in France: Historical Trends (Since 2021) and Forecasted Estimates (Till 2035) (USD Million): Conservative, Base and Optimistic Scenarios (USD Billion)
- Table 36.182 Small Molecules Continuous Manufacturing Market in Belgium: Historical Trends (Since 2021) and Forecasted Estimates (Till 2035) (USD Million): Conservative, Base and Optimistic Scenarios (USD Billion)
- Table 36.183 Small Molecules Continuous Manufacturing Market in Rest of Europe: Historical Trends (Since 2021) and Forecasted Estimates (Till 2035) (USD Million): Conservative, Base and Optimistic Scenarios (USD Billion)
- Table 36.184 Small Molecules Continuous Manufacturing Market in Asia-Pacific: Historical Trends (Since 2021) and Forecasted Estimates (Till 2035) (USD Million): Conservative, Base and Optimistic Scenarios (USD Billion)
- Table 36.185 Small Molecules Continuous Manufacturing Market in China: Historical Trends (Since 2021) and Forecasted Estimates (Till 2035) (USD Million): Conservative, Base and Optimistic Scenarios (USD Billion)
- Table 36.186 Small Molecules Continuous Manufacturing Market in Singapore: Historical Trends (Since 2021) and Forecasted Estimates (Till 2035) (USD Million): Conservative, Base and Optimistic Scenarios (USD Billion)
- Table 36.187 Small Molecules Continuous Manufacturing Market in Japan: Historical Trends (Since 2021) and Forecasted Estimates (Till 2035) (USD Million): Conservative, Base and Optimistic Scenarios (USD Billion)
- Table 36.188 Small Molecules Continuous Manufacturing Market in India: Historical Trends (Since 2021) and Forecasted Estimates (Till 2035) (USD Million): Conservative, Base and Optimistic Scenarios (USD Billion)
- Table 36.189 Small Molecules Continuous Manufacturing Market in South Korea: Historical Trends (Since 2021) and Forecasted Estimates (Till 2035) (USD Million): Conservative, Base and Optimistic Scenarios (USD Billion)
List of Figures
- Figure 2.1 Research Methodology: Project Methodology
- Figure 2.2 Research Methodology: Data Sources for Secondary Research
- Figure 2.3 Research Methodology: Robust Quality Control
- Figure 3.1 Market Dynamics: Forecast Methodology
- Figure 3.2 Market Dynamics: Market Assessment Framework
- Figure 4.1 Lessons Learnt from Past Recessions
- Figure 5.1 Executive Summary: Market Landscape
- Figure 5.2 Executive Summary: Recent Trends
- Figure 5.5 Executive Summary: Market Sizing and Opportunity Analysis
- Figure 6.1 Advantages of Continuous Manufacturing
- Figure 7.1 Biologics Continuous Manufacturers: Distribution by Year of Establishment
- Figure 7.2 Biologics Continuous Manufacturers: Distribution by Company Size
- Figure 7.3 Biologics Continuous Manufacturers: Distribution by Location of Headquarters
- Figure 7.4 Biologics Continuous Manufacturers: Distribution by Type of Player
- Figure 7.5 Biologics Continuous Manufacturers: Distribution by Scale of Operation
- Figure 7.6 Biologics Continuous Manufacturers: Distribution by Type of Biologic Manufactured
- Figure 7.7 Biologics Continuous Manufacturers: Distribution by Type of Product Manufactured
- Figure 7.8 Biologics Continuous Manufacturers: Distribution by Location of Continuous Manufacturing Facilities
- Figure 7.9 Biologics Continuous Manufacturers: Distribution by Type of Continuous Manufacturing Facility
- Figure 7.10 Biologics Continuous Manufacturers: Distribution by Stage of Bioprocessing
- Figure 7.11 Biologics Continuous Manufacturers: Distribution by Stage of Upstream Bioprocessing
- Figure 7.12 Biologics Continuous Manufacturers: Distribution by Stage of Downstream Bioprocessing
- Figure 7.13 Biologics Continuous Manufacturers: Distribution by Quality Certificates Obtained
- Figure 7.14 Biologics Continuous Manufacturers: Distribution by Range of Installed Capacity (in Liters)
- Figure 8.1 Company Competitiveness Analysis: Biologics Continuous Manufacturers based in North America
- Figure 8.2 Company Competitiveness Analysis: Biologics Continuous Manufacturers based in Europe
- Figure 8.3 Company Competitiveness Analysis: Biologics Continuous Manufacturers based in Asia-Pacific
- Figure 9.1 Small Molecules Continuous Manufacturers: Distribution by Year of Establishment
- Figure 9.2 Small Molecules Continuous Manufacturers: Distribution by Company Size
- Figure 9.3 Small Molecules Continuous Manufacturers: Distribution by Location of Headquarters
- Figure 9.4 Small Molecules Continuous Manufacturers: Distribution by Type of Player
- Figure 9.5 Small Molecules Continuous Manufacturers: Distribution by Scale of Operation
- Figure 9.6 Small Molecules Continuous Manufacturers: Distribution by Type of Dosage Form
- Figure 9.7 Small Molecules Continuous Manufacturers: Distribution by Type of Product Manufactured
- Figure 9.8 Small Molecules Continuous Manufacturers: Distribution by Location of Continuous Manufacturing Facilities
- Figure 9.9 Small Molecules Continuous Manufacturers: Distribution by Type of Continuous Manufacturing Process
- Figure 9.10 Small Molecules Continuous Manufacturers: Distribution by Stage of Continuous API Manufacturing
- Figure 9.11 Small Molecules Continuous Manufacturers: Distribution by Stage of Continuous FDF Manufacturing
- Figure 9.12 Small Molecules Continuous Manufacturers: Distribution by Quality Certificates Obtained
- Figure 10.1 Company Competitiveness Analysis: Small Molecules Continuous Manufacturers based in North America
- Figure 10.2 Company Competitiveness Analysis: Small Molecules Continuous Manufacturers based in Europe
- Figure 10.3 Company Competitiveness Analysis: Small Molecules Continuous Manufacturer based in Asia-Pacific
- Figure 11.1 AbbVie: Annual Revenues, Consolidated Financial Details, Since FY 2021 (USD Billion)
- Figure 11.2 AGC Biologics: Annual Revenues, Consolidated Financial Details, Since FY 2021 (JPY Billion)
- Figure 12.1 Boehringer Ingelheim: Annual Revenues, Consolidated Financial Details, Since FY 2021 (EUR Billion)
- Figure 13.1 Kaneka: Annual Revenues, Consolidated Financial Details, Since FY 2021 (JPY Billion)
- Figure 13.2 WuXi Biologics: Annual Revenues, Consolidated Financial Details, Since FY 2021 (RMB Billion)
- Figure 14.1 Partnerships and Collaborations: Cumulative Year-wise Trend, Since Pre-2020
- Figure 14.2 Partnerships and Collaborations: Distribution by Type of Partnership
- Figure 14.3 Partnerships and Collaborations: Distribution by Year and Type of Partnership, Since Pre-2020
- Figure 14.4 Partnerships and Collaborations: Distribution by Type of Partner
- Figure 14.5 Partnerships and Collaborations: Distribution by Type of Drug Molecule
- Figure 14.6 Partnerships and Collaborations: Distribution by Type of Product
- Figure 14.7 Partnerships and Collaborations: Distribution by Scale of Operation
- Figure 14.8 Most Active Players: Distribution by Number of Partnerships
- Figure 14.9 Partnerships and Collaborations: Local and International Agreements
- Figure 14.10Partnerships and Collaborations: Intracontinental and Intercontinental Agreements
- Figure 15.1 Recent Expansions: Cumulative Year-wise Trend, Since 2018
- Figure 15.2 Recent Expansions: Distribution by Type of Expansion
- Figure 15.3 Recent Expansions: Distribution by Year and Type of Expansion, Since 2018
- Figure 15.4 Recent Expansions: Distribution by Scale of Operation
- Figure 15.5 Recent Expansions: Distribution by Type of Expansion and Scale of Operation
- Figure 15.6 Recent Expansions: Distribution by Type of Drug Molecule
- Figure 15.7 Recent Expansions: Distribution by Type of Drug Molecule Manufactured and Type of Expansion
- Figure 15.8 Recent Expansions: Distribution by Type of Product
- Figure 15.9 Recent Expansions: Distribution by Amount Invested (USD Million)
- Figure 15.10 Recent Expansions: Distribution by Facility Area (square feet)
- Figure 15.11 Most Active Players: Distribution by Number of Expansions
- Figure 15.12 Recent Expansions: Distribution by Location of Expansion (Country)
- Figure 15.13 Recent Expansions: Distribution by Location of Expansion (Continent)
- Figure 15.14 Recent Expansions: Distribution by Location of Expansion (Continent) and Type of Expansion
- Figure 16.1 Grants Analysis: Cumulative Distribution by Year of Grant, Since 2020
- Figure 16.2 Grants Analysis: Distribution by Cumulative Amount Awarded (USD Million), Since 2020
- Figure 16.3 Grants Analysis: Distribution by Funding Institute Center
- Figure 16.4 Grants Analysis: Distribution by Support Period
- Figure 16.5 Grants Analysis: Distribution by Type of Grant Application
- Figure 16.6 Grants Analysis: Distribution by Purpose of Grant Award
- Figure 16.7 Grants Analysis: Distribution by Activity Code
- Figure 16.8 Grants Analysis: Distribution by Study Section Involved
- Figure 16.9 Popular NIH Departments: Distribution by Number of Grants
- Figure 16.10 Grants Analysis: Distribution by Type of Recipient Organization
- Figure 16.11 Prominent Program Officers: Distribution by Number of Grants
- Figure 16.12 Popular Recipient Organizations: Distribution by Number of Grants
- Figure 16.13 Popular Recipient Organizations: Distribution by Grant Amount (USD Million)
- Figure 16.14 Grants Analysis: Distribution by Region of Recipient Organization
- Figure 17.1 Patent Analysis: Distribution by Type of Patent
- Figure 17.2 Patent Analysis: Cumulative Distribution by Patent Publication Year, Since 2020
- Figure 17.3 Patent Analysis: Distribution by Type of Patent and Publication Year, Since 2020
- Figure 17.4 Patent Analysis: Distribution by Patent Application Year, Since Pre-2019
- Figure 17.5 Patent Analysis: Patent Jurisdiction
- Figure 17.6 Patent Analysis: Distribution by CPC Symbols
- Figure 17.8 Leading Industry Players: Distribution by Number of Patents
- Figure 17.9 Leading Non-Industry Players: Distribution by Number of Patents
- Figure 17.10 Patent Benchmarking Analysis: Distribution of Patent Characteristics (CPC Codes) by Leading Industry Players
- Figure 17.11 Patent Benchmarking Analysis: Distribution of Leading Industry Players by Patent Characteristics (CPC Codes)
- Figure 17.12 Patent Analysis: Distribution by Patent Age
- Figure 17.13 Continuous Manufacturing: Patent Valuation
- Figure 20.1 Biologics Continuous Manufacturing Equipment: Distribution by Type of Equipment
- Figure 20.2 Biologics Continuous Manufacturing Equipment: Distribution by Type of Manufacturing Process
- Figure 20.3 Biologics Continuous Manufacturing Equipment: Distribution by Stage of Bioprocessing
- Figure 20.4 Biologics Continuous Manufacturing Equipment: Distribution by Scale of Operation
- Figure 20.5 Biologics Continuous Manufacturing Equipment Providers: Distribution by Year of Establishment
- Figure 20.6 Biologics Continuous Manufacturing Equipment Providers: Distribution by Company Size
- Figure 20.7 Biologics Continuous Manufacturing Equipment Providers: Distribution by Location of Headquarters
- Figure 20.8 Most Active Players: Distribution by Number of Biologics Continuous Manufacturing Equipment Offered
- Figure 21.1 Continuous Manufacturing: Phase wise Key Strategies for the Adoption of Continuous Manufacturing Processes
- Figure 21.2 Process Development and Implementation (Phase I): Distribution by Type of Strategy Adopted
- Figure 21.3 Equipment / Technology Development and Installation (Phase II): Distribution by the Type of Strategy Adopted
- Figure 21.4 Facility / Plant Development and Establishment (Phase III): Distribution by the Type of Strategy Adopted
- Figure 21.5 Product Development and Manufacturing (Phase IV): Distribution by the Type of Strategy Adopted
- Figure 22.1 Modular Construction: Applications
- Figure 22.2 Steps Involved in Modular Construction
- Figure 22.3 Construction Timeline of Modular and Conventional Buildings
- Figure 22.4 Modular Construction: Advantages
- Figure 22.5 Modular Facility Manufacturers: Distribution by Type of Industry Served
- Figure 22.6 Modular Facility Manufacturers: Distribution by Geographical Coverage
- Figure 22.7 Modular Facility Manufacturers: Distribution by Type of Modular Construction
- Figure 22.8 Modular Cleanroom Providers: Distribution by Year of Establishment
- Figure 22.9 Modular Cleanroom Providers: Distribution by Location of Headquarters
- Figure 22.10 Modular Cleanroom Providers: Distribution of Headquarters (Country)
- Figure 22.11 Modular Cleanroom Providers: Distribution by Type of Modular Cleanroom Offered
- Figure 23.1 Global Installed Biologics Continuous Manufacturing Capacity: Distribution by Range of Installed Capacity (in Liters)
- Figure 23.2 Global Installed Biologics Continuous Manufacturing Capacity (in Liters): Distribution by Company Size
- Figure 23.3 Global Installed Biologics Continuous Manufacturing Capacity: Distribution by Scale of Operation
- Figure 23.4 Global Installed Biologics Continuous Manufacturing Capacity: Distribution by Type of Player
- Figure 23.5 Global Installed Biologics Continuous Manufacturing Capacity: Distribution by Location of Continuous Manufacturing Facility
- Figure 23.6 Biologics Continuous Manufacturing Capacity Installed in North in North America
- Figure 23.7 Biologics Continuous Manufacturing Capacity Installed in Europe
- Figure 23.8 Biologics Continuous Manufacturing Capacity Installed in Asia-Pacific
- Figure 24.1 Global Installed Continuous Small Molecule Manufacturing Capacity (in Kg/Year): Distribution by Range of Installed Capacity
- Figure 24.2 Global Installed Continuous Small Molecule Manufacturing Capacity (in Kg/ Year): Distribution by Company Size
- Figure 24.3 Global Installed Continuous Small Molecule Manufacturing Capacity (in Kg/ Year): Distribution by Scale of Operation
- Figure 24.4 Global Continuous Small Molecule Manufacturing Capacity: Distribution by Type of Player
- Figure 24.5 Global Installed Continuous Small Molecule Manufacturing Capacity: Distribution by Location of Continuous Manufacturing Facility
- Figure 24.6 Continuous Small Molecule Manufacturing Capacity Installed in North America
- Figure 24.7 Continuous Small Molecule Manufacturing Capacity Installed in Europe
- Figure 24.8 Continuous Small Molecule Manufacturing Capacity Installed in Asia-Pacific
- Figure 25.1 Global Continuous Manufacturing Market, Historical Trends (Since 2021) and Forecasted Estimates (Till 2035) (USD Million)
- Figure 25.2 Global Continuous Manufacturing Market, Forecasted Estimates (Till 2035): Conservative Scenario (USD Million)
- Figure 25.3 Global Continuous Manufacturing Market, Forecasted Estimates (Till 2035): Optimistic Scenario (USD Million)
- Figure 26.1 Continuous Manufacturing Market: Distribution by Type of Drug Molecule, 2021, 2025 and 2035
- Figure 26.2 Continuous Manufacturing Market for Biologics, Historical Trends (Since 2021) and Forecasted Estimates (Till 2035) (USD Million)
- Figure 26.3 Biologics Continuous Manufacturing Market for Upstream Bioprocessing, Historical Trends (Since 2021) and Forecasted Estimates (Till 2035) (USD Million)
- Figure 26.4 Biologics Continuous Manufacturing Market for Downstream Bioprocessing, Historical Trends (Since 2021) and Forecasted Estimates (Till 2035) (USD Million)
- Figure 26.5 Continuous Manufacturing for Small Molecules Market, Historical Trends (Since 2021) and Forecasted Estimates (Till 2035) (USD Million)
- Figure 26.6 Small Molecules Continuous Manufacturing Market for Active Pharmaceutical Ingredients, Historical Trends (Since 2021) and Forecasted Estimates (Till 2035) (USD Million)
- Figure 26.7 Small Molecules Continuous Manufacturing Market for Finished Drug Forms, Historical Trends (Since 2021) and Forecasted Estimates (Till 2035) (USD Million)
- Figure 27.1 Biologics Continuous Manufacturing Market: Distribution by Scale of Operation, 2021, 2025 and 2035
- Figure 27.2 Biologics Continuous Manufacturing Market for Preclinical / Clinical Scale Operations, Historical Trends (Since 2021) and Forecasted Estimates (Till 2035) (USD Million)
- Figure 27.3 Biologics Continuous Manufacturing Market for Commercial Scale Operations, Historical Trends (Since 2021) and Forecasted Estimates (Till 2035) (USD Million)
- Figure 27.4 Small Molecules Continuous Manufacturing Market: Distribution by Scale of Operation, 2021, 2025 and 2035
- Figure 27.5 Small Molecules Continuous Manufacturing Market for Preclinical / Clinical Scale Operations, Historical Trends (Since 2021) and Forecasted Estimates (Till 2035) (USD Million)
- Figure 27.6 Small Molecules Continuous Manufacturing Market for Commercial Scale Operations, Historical Trends (Since 2021) and Forecasted Estimates (Till 2035) (USD Million)
- Figure 28.1 Biologics Continuous Manufacturing Market: Distribution by Purpose of Manufacturing, 2021, 2025 and 2035
- Figure 28.2 Biologics Continuous Manufacturing Market for Contract Manufacturing, Historical Trends (Since 2021) and Forecasted Estimates (Till 2035) (USD Million)
- Figure 28.3 Biologics Continuous Manufacturing Market for In-House Manufacturing, Historical Trends (Since 2021) and Forecasted Estimates (Till 2035) (USD Million)
- Figure 28.4 Biologics Continuous Manufacturing Market for Both, Historical Trends (Since 2021) and Forecasted Estimates (Till 2035) (USD Million)
- Figure 28.5 Small Molecules Continuous Manufacturing Market: Distribution by Purpose of Manufacturing
- Figure 28.6 Small Molecules Continuous Manufacturing Market for Contract Manufacturing, Historical Trends (Since 2021) and Forecasted Estimates (Till 2035) (USD Million)
- Figure 28.7 Small Molecules Continuous Manufacturing Market for In-House Manufacturing, Historical Trends (Since 2021) and Forecasted Estimates (Till 2035) (USD Million)
- Figure 28.8 Small Molecules Continuous Manufacturing Market for Both, Historical Trends (Since 2021) and Forecasted Estimates (Till 2035) (USD Million)
- Figure 29.1 Biologics Continuous Manufacturing Market: Distribution by Company Size, 2021, 2025 and 2035
- Figure 29.2 Biologics Continuous Manufacturing Market for Small Companies, Historical Trends (Since 2021) and Forecasted Estimates (Till 2035) (USD Million)
- Figure 29.3 Biologics Continuous Manufacturing Market for Mid-Sized Companies, Historical Trends (Since 2021) and Forecasted Estimates (Till 2035) (USD Million)
- Figure 29.4 Biologics Continuous Manufacturing Market for Large Companies, Historical Trends (Since 2021) and Forecasted Estimates (Till 2035) (USD Million)
- Figure 29.5 Small Molecules Continuous Manufacturing Market: Distribution by Company Size, 2021, 2025 and 2035
- Figure 29.6 Small Molecules Continuous Manufacturing Market for Small Companies, Historical Trends (Since 2021) and Forecasted Estimates (Till 2035) (USD Million)
- Figure 29.7 Small Molecules Continuous Manufacturing Market for Mid-Sized Companies, Historical Trends (Since 2021) and Forecasted Estimates (Till 2035) (USD Million)
- Figure 29.8 Small Molecules Continuous Manufacturing Market for Large Companies, Historical Trends (Since 2021) and Forecasted Estimates (Till 2035) (USD Million)
- Figure 30.1 Biologics Continuous Manufacturing Market: Distribution by Key Geographical Regions, 2021, 2025 and 2035
- Figure 30.2 Biologics Continuous Manufacturing Market in North America: Historical Trends (Since 2021) and Forecasted Estimates (Till 2035) (USD Million)
- Figure 30.3 Biologics Continuous Manufacturing Market in the US: Historical Trends (Since 2021) and Forecasted Estimates (Till 2035) (USD Million)
- Figure 30.4 Biologics Continuous Manufacturing Market in Puerto Rico: Historical Trends (Since 2021) and Forecasted Estimates (Till 2035) (USD Million)
- Figure 30.5 Biologics Continuous Manufacturing Market in Europe: Historical Trends (Since 2021) and Forecasted Estimates (Till 2035) (USD Million)
- Figure 30.6 Biologics Continuous Manufacturing Market in Germany: Historical Trends (Since 2021) and Forecasted Estimates (Till 2035) (USD Million)
- Figure 30.7 Biologics Continuous Manufacturing Market in Switzerland: Historical Trends (Since 2021) and Forecasted Estimates (Till 2035) (USD Million)
- Figure 30.8 Biologics Continuous Manufacturing Market in Belgium: Historical Trends (Since 2021) and Forecasted Estimates (Till 2035) (USD Million)
- Figure 30.9 Biologics Continuous Manufacturing Market in Ireland: Historical Trends (Since 2021) and Forecasted Estimates (Till 2035) (USD Million)
- Figure 30.10 Biologics Continuous Manufacturing Market in France: Historical Trends (Since 2021) and Forecasted Estimates (Till 2035) (USD Million)
- Figure 30.11 Biologics Continuous Manufacturing Market in Rest of Europe: Historical Trends (Since 2021) and Forecasted Estimates (Till 2035) (USD Million)
- Figure 30.12 Biologics Continuous Manufacturing Market in Asia-Pacific: Historical Trends (Since 2021) and Forecasted Estimates (Till 2035) (USD Million)
- Figure 30.13 Biologics Continuous Manufacturing Market in China: Historical Trends (Since 2021) and Forecasted Estimates (Till 2035) (USD Million)
- Figure 30.14 Biologics Continuous Manufacturing Market in South Korea: Historical Trends (Since 2021) and Forecasted Estimates (Till 2035) (USD Million)
- Figure 30.15 Biologics Continuous Manufacturing Market in Singapore: Historical Trends (Since 2021) and Forecasted Estimates (Till 2035) (USD Million)
- Figure 30.16 Biologics Continuous Manufacturing Market in Taiwan: Historical Trends (Since 2021) and Forecasted Estimates (Till 2035) (USD Million)
- Figure 30.17 Biologics Continuous Manufacturing Market in India: Historical Trends (Since 2021) and Forecasted Estimates (Till 2035) (USD Million)
- Figure 30.18 Biologics Continuous Manufacturing Market in Japan: Historical Trends (Since 2021) and Forecasted Estimates (Till 2035) (USD Million)
- Figure 30.19 Biologics Continuous Manufacturing Market in Australia: Historical Trends (Since 2021) and Forecasted Estimates (Till 2035) (USD Million)
- Figure 30.20 Biologics Continuous Manufacturing Market: Market Movement Analysis
- Figure 30.21 Biologics Continuous Manufacturing Market: Penetration Growth (P-G) Matrix
- Figure 30.22 Small Molecules Continuous Manufacturing Market: Distribution by Key Geographical Regions, 2021, 2025 and 2035
- Figure 30.23 Small Molecules Continuous Manufacturing Market in North America: Historical Trends (Since 2021) and Forecasted Estimates (Till 2035) (USD Million)
- Figure 30.24 Small Molecules Continuous Manufacturing Market in the US: Historical Trends (Since 2021) and Forecasted Estimates (Till 2035) (USD Million)
- Figure 30.25 Small Molecules Continuous Manufacturing Market in Mexico: Historical Trends (Since 2021) and Forecasted Estimates (Till 2035) (USD Million)
- Figure 30.26 Small Molecules Continuous Manufacturing Market in Europe: Historical Trends (Since 2021) and Forecasted Estimates (Till 2035) (USD Million)
- Figure 30.27 Small Molecules Continuous Manufacturing Market in Germany: Historical Trends (Since 2021) and Forecasted Estimates (Till 2035) (USD Million)
- Figure 30.28 Small Molecules Continuous Manufacturing Market in the UK: Historical Trends (Since 2021) and Forecasted Estimates (Till 2035) (USD Million)
- Figure 30.29 Small Molecules Continuous Manufacturing Market in Italy: Historical Trends (Since 2021) and Forecasted Estimates (Till 2035) (USD Million)
- Figure 30.30 Small Molecules Continuous Manufacturing Market in Switzerland: Historical Trends (Since 2021) and Forecasted Estimates (Till 2035) (USD Million)
- Figure 30.31 Small Molecules Continuous Manufacturing Market in France: Historical Trends (Since 2021) and Forecasted Estimates (Till 2035) (USD Million)
- Figure 30.32 Small Molecules Continuous Manufacturing Market in Belgium: Historical Trends (Since 2021) and Forecasted Estimates (Till 2035) (USD Million)
- Figure 30.33 Small Molecules Continuous Manufacturing Market in Rest of Europe: Historical Trends (Since 2021) and Forecasted Estimates (Till 2035) (USD Million)
- Figure 30.34 Small Molecules Continuous Manufacturing Market in Asia-Pacific: Historical Trends (Since 2021) and Forecasted Estimates (Till 2035) (USD Million)
- Figure 30.35 Small Molecules Continuous Manufacturing Market in China: Historical Trends (Since 2021) and Forecasted Estimates (Till 2035) (USD Million)
- Figure 30.36 Small Molecules Continuous Manufacturing Market in Singapore: Historical Trends (Since 2021) and Forecasted Estimates (Till 2035) (USD Million)
- Figure 30.37 Small Molecules Continuous Manufacturing Market in Japan: Historical Trends (Since 2021) and Forecasted Estimates (Till 2035) (USD Million)
- Figure 30.38 Small Molecules Continuous Manufacturing Market in India: Historical Trends (Since 2021) and Forecasted Estimates (Till 2035) (USD Million)
- Figure 30.39 Small Molecules Continuous Manufacturing Market in South Korea: Historical Trends (Since 2021) and Forecasted Estimates (Till 2035) (USD Million)
- Figure 34.1 Concluding Remarks: Market Landscape (Biologics Continuous Manufacturing)
- Figure 34.2 Concluding Remarks: Market Landscape (Small Molecules Continuous Manufacturing)
- Figure 34.3 Concluding Remarks: Partnerships and Collaboration
- Figure 34.4 Concluding Remarks: Recent Expansions
- Figure 34.5 Concluding Remarks: Grant Analysis
- Figure 34.6 Concluding Remarks: Patent Analysis
- Figure 34.7 Concluding Remarks: Capacity Analysis
- Figure 34.8 Concluding Remarks: Market Forecast and Opportunity Analysis (Biologics Continuous Manufacturing)
- Figure 34.9 Concluding Remarks: Market Forecast and Opportunity Analysis (Small Molecules Continuous Manufacturing)

