
PUBLISHER: Roots Analysis | PRODUCT CODE: 1883715

PUBLISHER: Roots Analysis | PRODUCT CODE: 1883715
E-Fuels Market Till 2035: Distribution by Type of Fuel, Type of State, Type of Production Method, Type of Technology, Type of End User, and Geographical Regions: Industry Trends and Global Forecast
E-Fuels Market Overview
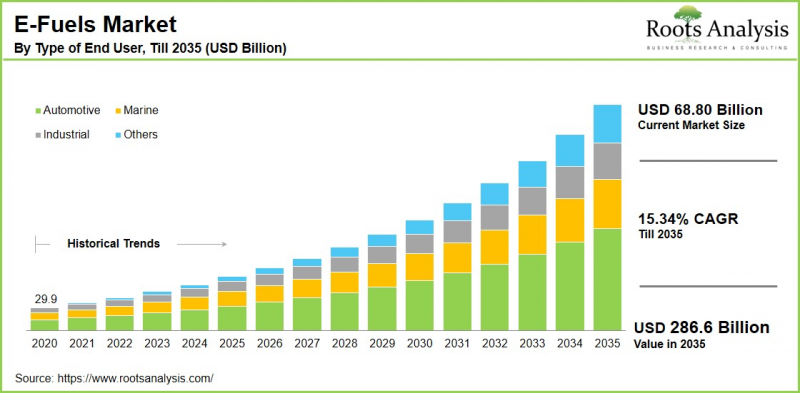
As per Roots Analysis, the global e-fuels market size is estimated to grow from USD 68.80 billion in the current year USD 286.6 billion by 2035, at a CAGR of 15.34% during the forecast period, till 2035.
The opportunity for e-fuels market has been distributed across the following segments:
Type of Fuel
- E-Diesel
- E-Gasoline
- E-Hydrogen
- E-Kerosene
- E-Methane
- E-Methanol
- Others
Type of State
- Gas
- Liquid
Type of Production Method
- Biologically Derived Fuels
- Power-to-Gas
- Power-to-Liquid
Type of Technology
- Direct air Capture
- Electrolysis
- Fischer-Tropsch Synthesis
- Methanation
Type of End User
- Automotive
- Aviation
- Industrial
- Marine
- Railway
- Others
Geographical Regions
- North America
- US
- Canada
- Mexico
- Other North American countries
- Europe
- Austria
- Belgium
- Denmark
- France
- Germany
- Ireland
- Italy
- Netherlands
- Norway
- Russia
- Spain
- Sweden
- Switzerland
- UK
- Other European countries
- Asia
- China
- India
- Japan
- Singapore
- South Korea
- Other Asian countries
- Latin America
- Brazil
- Chile
- Colombia
- Venezuela
- Other Latin American countries
- Middle East and North Africa
- Egypt
- Iran
- Iraq
- Israel
- Kuwait
- Saudi Arabia
- UAE
- Other MENA countries
- Rest of the World
- Australia
- New Zealand
- Other countries
E-Fuels Market: Growth and Trends
Given the rising levels of carbon emissions, e-fuels are becoming increasingly favored as a promising substitute for fossil fuels. E-fuel, also referred to as electro-fuel or synthetic fuel, is a carbon-neutral fuel generated through renewable energy sources. These fuels are made by integrating green hydrogen with carbon dioxide captured from the atmosphere or from industrial processes. The aim of e-fuels is to serve as a replacement for fossil fuels across various applications and provide a sustainable alternative for decarbonizing challenging sectors like aviation, shipping, and heavy industry.
The growing climate objectives, particularly in Europe, such as the Sustainable and Smart Mobility Strategy, have boosted the global demand for the e-fuels market. A significant advantage of e-fuels is their ability to be produced in diverse forms depending on the synthesis methods used, including e-kerosene, e-diesel, e-gasoline, e-methanol, among others, which broadens their applications across different industries. E-fuels offer carbon neutrality, drop-in capacity, and energy storage, making them a feasible option for regions rich in renewable resources.
Moreover, the increasing corporate dedication to achieving net-zero emissions and heightened awareness regarding climate change and environmental issues are strengthening the demand for sustainable energy solutions. Additionally, a rise in global partnerships and funding for large-scale e-fuel initiatives, such as the Oni plant in Chile, is showcasing the practicality of e-fuel production. Overall, considering the above mentioned factors, the e-fuels market is expected to grow significantly during the forecast period.
E-fuels Market: Key Segments
Market Share by Type of Fuel
Based on type of fuel, the global e-fuels market is segmented into various types. According to our estimates, currently, the e-kerosene segment captures the majority of the market share. This can be attributed to its use in hard-to-abate sectors such as aviation, shipping, and heavy-duty transport, as it can be utilized in existing aircraft engines without the need for modifications, thereby fostering growth in this segment.
However, the e-methanol segment is projected to experience a comparatively higher compound annual growth rate (CAGR) during the forecast period. This can be attributed to the fact that it serves as more environmentally friendly option compared to heavy fuel oil and can be employed in current ship engines with minimal adjustments, leading to increasing demand in important application areas.
Market Share by Type of State
Based on type of state, the global e-fuels market is segmented into gas and liquid. According to our estimates, currently, the liquid state segment captures the majority of the market share. This can be attributed to the benefits of liquid e-fuels like e-diesel and e-gasoline, which feature higher energy density, compatibility as drop-in alternatives, and broader applications for end-users.
In contrast, the gas segment is projected to experience a higher CAGR throughout the forecast period. This is due to the extensive use in industrial processes, electricity generation, and heating.
Market Share by Type of Production Method
Based on type of production method, the global e-fuels market is segmented into biologically derived fuels, power-to-gas, and power-to-liquid. According to our estimates, currently, the power-to-liquid method captures the majority of the market share. This can be attributed to the fact that it combines several technologies, such as green hydrogen, carbon capture, and synthesis processes, to generate high-quality drop-in fuels.
However, the power-to-gas production method is projected to experience a comparatively higher compound annual growth rate (CAGR) during the forecast period, driven by its increasing application in industrial activities, including heating and power generation.
Market Share by Type of Technology
Based on type of technology, the global e-fuels market is segmented into direct air capture, electrolysis, fischer-tropsch synthesis, and methanation. According to our estimates, currently, the electrolysis (hydrogen production) segment captures the majority of the market share. This can be linked to the fact that the green hydrogen is generated by separating water into hydrogen and oxygen through renewable electricity, making it a crucial element of e-fuels, which propels the growth of this segment.
On the other hand, the Fischer-Tropsch Synthesis technology segment is projected to experience a comparatively higher compound annual growth rate (CAGR) during the forecast period. This growth can be attributed to the fact that the Fischer-Tropsch (FT) process is a well-established method for transforming syngas into liquid hydrocarbons like e-diesel and e-kerosene. Further, the integration of green hydrogen and CO2 capture technologies for the production of carbon-neutral fuels bolsters the expansion of this segment.
Market Share by Type of End User
Based on type of end user, the global e-fuels market is segmented into a wide range of end users. According to our estimates, currently, the automotive segment captures the majority of the market share. This can be attributed to the increasing regulatory measures aimed at reducing carbon emissions and the expansion of electrification. High-performance and luxury vehicle producers like Porsche and Ferrari are investing in e-fuels to enhance the performance of internal combustion engine vehicles while minimizing emissions, thereby improving market prospects
However, the aviation sector is expected to grow at a higher CAGR during the forecast period, due to regulatory demands from entities such as the International Civil Aviation Organization (ICAO) and the EU's Fit for 55 Package. Airlines and aircraft manufacturers are pledging to achieve net-zero emissions by 2050, further increasing the market's potential.
Market Share by Geographical Regions
Based on geographical regions, the e-fuels market is segmented into North America, Europe, Asia, Latin America, Middle East and North Africa, and the rest of the world. According to our estimates, currently the market in Europe captures the majority share of the market. Additionally, North America ranks as the second largest market for e-fuels, driven by a greater adoption of sustainable solutions and stringent regulatory measures.
Further, Asia is emerging as the region with the fastest growth in the e-fuels sector, spurred by rapid industrialization and increasing energy demand. To address the escalating energy needs while decreasing dependence on fossil fuels, countries in Asia are investing in alternative energy options similar to e-fuels.
Example Players in E-Fuels Market
- Archer Daniels Midland
- Ballard Power Systems
- Ceres Power Holding
- Clean Fuels Alliance America
- Climeworks
- E-Fuel Corporation
- eFuel Pacific
- ExxonMobil
- Hexagon Agility
- HIF Global
- Infinium
- LanzaJet
- Liquid Wind
- Mitsubishi
- Neste
- Norsk e-Fuels
E-fuels Market: Research Coverage
The report on the e-fuels market features insights on various sections, including:
- Market Sizing and Opportunity Analysis: An in-depth analysis of the e-fuels market, focusing on key market segments, including [A] type of fuel, [B] type of state, [C] type of production method, [D] type of technology, [E] type of end user, and [F] geographical regions.
- Competitive Landscape: A comprehensive analysis of the companies engaged in the e-fuels market, based on several relevant parameters, such as [A] year of establishment, [B] company size, [C] location of headquarters and [D] ownership structure.
- Company Profiles: Elaborate profiles of prominent players engaged in the e-fuels market, providing details on [A] location of headquarters, [B] company size, [C] company mission, [D] company footprint, [E] management team, [F] contact details, [G] financial information, [H] operating business segments, [I] portfolio, [J] moat analysis, [K] recent developments, and an informed future outlook.
- Megatrends: An evaluation of ongoing megatrends in the e-fuels industry.
- Patent Analysis: An insightful analysis of patents filed / granted in the e-fuels domain, based on relevant parameters, including [A] type of patent, [B] patent publication year, [C] patent age and [D] leading players.
- Recent Developments: An overview of the recent developments made in the e-fuels market, along with analysis based on relevant parameters, including [A] year of initiative, [B] type of initiative, [C] geographical distribution and [D] most active players.
- Porter's Five Forces Analysis: An analysis of five competitive forces prevailing in the e-fuels market, including threats of new entrants, bargaining power of buyers, bargaining power of suppliers, threats of substitute products and rivalry among existing competitors.
- SWOT Analysis: An insightful SWOT framework, highlighting the strengths, weaknesses, opportunities and threats in the domain. Additionally, it provides Harvey ball analysis, highlighting the relative impact of each SWOT parameter.
- Value Chain Analysis: A comprehensive analysis of the value chain, providing information on the different phases and stakeholders involved in the e-fuels market.
Key Questions Answered in this Report
- How many companies are currently engaged in e-fuels market?
- Which are the leading companies in this market?
- What factors are likely to influence the evolution of this market?
- What is the current and future market size?
- What is the CAGR of this market?
- How is the current and future market opportunity likely to be distributed across key market segments?
Reasons to Buy this Report
- The report provides a comprehensive market analysis, offering detailed revenue projections of the overall market and its specific sub-segments. This information is valuable to both established market leaders and emerging entrants.
- Stakeholders can leverage the report to gain a deeper understanding of the competitive dynamics within the market. By analyzing the competitive landscape, businesses can make informed decisions to optimize their market positioning and develop effective go-to-market strategies.
- The report offers stakeholders a comprehensive overview of the market, including key drivers, barriers, opportunities, and challenges. This information empowers stakeholders to stay abreast of market trends and make data-driven decisions to capitalize on growth prospects.
Additional Benefits
- Complimentary Excel Data Packs for all Analytical Modules in the Report
- 15% Free Content Customization
- Detailed Report Walkthrough Session with Research Team
- Free Updated report if the report is 6-12 months old or older
TABLE OF CONTENTS
SECTION I: REPORT OVERVIEW
1. PREFACE
- 1.1. Introduction
- 1.2. Market Share Insights
- 1.3. Key Market Insights
- 1.4. Report Coverage
- 1.5. Key Questions Answered
- 1.6. Chapter Outlines
2. RESEARCH METHODOLOGY
- 2.1. Chapter Overview
- 2.2. Research Assumptions
- 2.3. Database Building
- 2.3.1. Data Collection
- 2.3.2. Data Validation
- 2.3.3. Data Analysis
- 2.4. Project Methodology
- 2.4.1. Secondary Research
- 2.4.1.1. Annual Reports
- 2.4.1.2. Academic Research Papers
- 2.4.1.3. Company Websites
- 2.4.1.4. Investor Presentations
- 2.4.1.5. Regulatory Filings
- 2.4.1.6. White Papers
- 2.4.1.7. Industry Publications
- 2.4.1.8. Conferences and Seminars
- 2.4.1.9. Government Portals
- 2.4.1.10. Media and Press Releases
- 2.4.1.11. Newsletters
- 2.4.1.12. Industry Databases
- 2.4.1.13. Roots Proprietary Databases
- 2.4.1.14. Paid Databases and Sources
- 2.4.1.15. Social Media Portals
- 2.4.1.16. Other Secondary Sources
- 2.4.2. Primary Research
- 2.4.2.1. Introduction
- 2.4.2.2. Types
- 2.4.2.2.1. Qualitative
- 2.4.2.2.2. Quantitative
- 2.4.2.3. Advantages
- 2.4.2.4. Techniques
- 2.4.2.4.1. Interviews
- 2.4.2.4.2. Surveys
- 2.4.2.4.3. Focus Groups
- 2.4.2.4.4. Observational Research
- 2.4.2.4.5. Social Media Interactions
- 2.4.2.5. Stakeholders
- 2.4.2.5.1. Company Executives (CXOs)
- 2.4.2.5.2. Board of Directors
- 2.4.2.5.3. Company Presidents and Vice Presidents
- 2.4.2.5.4. Key Opinion Leaders
- 2.4.2.5.5. Research and Development Heads
- 2.4.2.5.6. Technical Experts
- 2.4.2.5.7. Subject Matter Experts
- 2.4.2.5.8. Scientists
- 2.4.2.5.9. Doctors and Other Healthcare Providers
- 2.4.2.6. Ethics and Integrity
- 2.4.2.6.1. Research Ethics
- 2.4.2.6.2. Data Integrity
- 2.4.3. Analytical Tools and Databases
- 2.4.1. Secondary Research
3. MARKET DYNAMICS
- 3.1. Forecast Methodology
- 3.1.1. Top-Down Approach
- 3.1.2. Bottom-Up Approach
- 3.1.3. Hybrid Approach
- 3.2. Market Assessment Framework
- 3.2.1. Total Addressable Market (TAM)
- 3.2.2. Serviceable Addressable Market (SAM)
- 3.2.3. Serviceable Obtainable Market (SOM)
- 3.2.4. Currently Acquired Market (CAM)
- 3.3. Forecasting Tools and Techniques
- 3.3.1. Qualitative Forecasting
- 3.3.2. Correlation
- 3.3.3. Regression
- 3.3.4. Time Series Analysis
- 3.3.5. Extrapolation
- 3.3.6. Convergence
- 3.3.7. Forecast Error Analysis
- 3.3.8. Data Visualization
- 3.3.9. Scenario Planning
- 3.3.10. Sensitivity Analysis
- 3.4. Key Considerations
- 3.4.1. Demographics
- 3.4.2. Market Access
- 3.4.3. Reimbursement Scenarios
- 3.4.4. Industry Consolidation
- 3.5. Robust Quality Control
- 3.6. Key Market Segmentations
- 3.7. Limitations
4. MACRO-ECONOMIC INDICATORS
- 4.1. Chapter Overview
- 4.2. Market Dynamics
- 4.2.1. Time Period
- 4.2.1.1. Historical Trends
- 4.2.1.2. Current and Forecasted Estimates
- 4.2.2. Currency Coverage
- 4.2.2.1. Overview of Major Currencies Affecting the Market
- 4.2.2.2. Impact of Currency Fluctuations on the Industry
- 4.2.3. Foreign Exchange Impact
- 4.2.3.1. Evaluation of Foreign Exchange Rates and Their Impact on Market
- 4.2.3.2. Strategies for Mitigating Foreign Exchange Risk
- 4.2.4. Recession
- 4.2.4.1. Historical Analysis of Past Recessions and Lessons Learnt
- 4.2.4.2. Assessment of Current Economic Conditions and Potential Impact on the Market
- 4.2.5. Inflation
- 4.2.5.1. Measurement and Analysis of Inflationary Pressures in the Economy
- 4.2.5.2. Potential Impact of Inflation on the Market Evolution
- 4.2.6. Interest Rates
- 4.2.6.1. Overview of Interest Rates and Their Impact on the Market
- 4.2.6.2. Strategies for Managing Interest Rate Risk
- 4.2.7. Commodity Flow Analysis
- 4.2.7.1. Type of Commodity
- 4.2.7.2. Origins and Destinations
- 4.2.7.3. Values and Weights
- 4.2.7.4. Modes of Transportation
- 4.2.8. Global Trade Dynamics
- 4.2.8.1. Import Scenario
- 4.2.8.2. Export Scenario
- 4.2.9. War Impact Analysis
- 4.2.9.1. Russian-Ukraine War
- 4.2.9.2. Israel-Hamas War
- 4.2.10. COVID Impact / Related Factors
- 4.2.10.1. Global Economic Impact
- 4.2.10.2. Industry-specific Impact
- 4.2.10.3. Government Response and Stimulus Measures
- 4.2.10.4. Future Outlook and Adaptation Strategies
- 4.2.11. Other Indicators
- 4.2.11.1. Fiscal Policy
- 4.2.11.2. Consumer Spending
- 4.2.11.3. Gross Domestic Product (GDP)
- 4.2.11.4. Employment
- 4.2.11.5. Taxes
- 4.2.11.6. R&D Innovation
- 4.2.11.7. Stock Market Performance
- 4.2.11.8. Supply Chain
- 4.2.11.9. Cross-Border Dynamics
- 4.2.1. Time Period
SECTION II: QUALITATIVE INSIGHTS
5. EXECUTIVE SUMMARY
6. INTRODUCTION
- 6.1. Chapter Overview
- 6.2. Overview of E-Fuels Market
- 6.2.1. Type of Fuel
- 6.2.2. Type of State
- 6.2.3. Type of Production Method
- 6.2.4. Type of Technology
- 6.2.5. Type of End User
- 6.3. Future Perspective
7. REGULATORY SCENARIO
SECTION III: MARKET OVERVIEW
8. COMPREHENSIVE DATABASE OF LEADING PLAYERS
9. COMPETITIVE LANDSCAPE
- 9.1. Chapter Overview
- 9.2. E-Fuel: Overall Market Landscape
- 9.2.1. Analysis by Year of Establishment
- 9.2.2. Analysis by Company Size
- 9.2.3. Analysis by Location of Headquarters
- 9.2.4. Analysis by Ownership Structure
10. WHITE SPACE ANALYSIS
11. COMPANY COMPETITIVENESS ANALYSIS
12. STARTUP ECOSYSTEM IN THE E-FUELS MARKET
- 12.1. E-Fuel: Market Landscape of Startups
- 12.1.1. Analysis by Year of Establishment
- 12.1.2. Analysis by Company Size
- 12.1.3. Analysis by Company Size and Year of Establishment
- 12.1.4. Analysis by Location of Headquarters
- 12.1.5. Analysis by Company Size and Location of Headquarters
- 12.1.6. Analysis by Ownership Structure
- 12.2. Key Findings
SECTION IV: COMPANY PROFILES
13. COMPANY PROFILES
- 13.1. Chapter Overview
- 13.2. Archer Daniels Midland *
- 13.2.1. Acuity Brands Overview
- 13.2.2. Company Mission
- 13.2.3. Company Footprint
- 13.2.4. Management Team
- 13.2.5. Contact Details
- 13.2.6. Financial Performance
- 13.2.7. Operating Business Segments
- 13.2.8. Service / Product Portfolio (project specific)
- 13.2.9. MOAT Analysis
- 13.2.10. Recent Developments and Future Outlook
- 13.3. Ballard Power Systems
- 13.4. Ceres Power Holding
- 13.5. Clean Fuels Alliance America
- 13.6. Climeworks
- 13.7. E-Fuel Corporation
- 13.8. eFuel Pacific
- 13.9. ExxonMobil
- 13.10. Hexagon Agility
- 13.11. HIF Global
- 13.12. Infinium
- 13.13. LanzaJet
- 13.14. Liquid Wind
- 13.15. Mitsubishi
- 13.16. Neste
- 13.17. Norsk e-Fuels
SECTION V: MARKET TRENDS
14. MEGA TRENDS ANALYSIS
15. UNMET NEED ANALYSIS
16. PATENT ANALYSIS
17. RECENT DEVELOPMENTS
- 17.1. Chapter Overview
- 17.2. Recent Funding
- 17.3. Recent Partnerships
- 17.4. Other Recent Initiatives
SECTION VI: MARKET OPPORTUNITY ANALYSIS
18. GLOBAL E-FUELS MARKET
- 18.1. Chapter Overview
- 18.2. Key Assumptions and Methodology
- 18.3. Trends Disruption Impacting Market
- 18.4. Demand Side Trends
- 18.5. Supply Side Trends
- 18.6. Global E-Fuels Market, Historical Trends (Since 2020) and Forecasted Estimates (Till 2035)
- 18.7. Multivariate Scenario Analysis
- 18.7.1. Conservative Scenario
- 18.7.2. Optimistic Scenario
- 18.8. Investment Feasibility Index
- 18.9. Key Market Segmentations
19. MARKET OPPORTUNITIES BASED ON TYPE OF FUEL
- 19.1. Chapter Overview
- 19.2. Key Assumptions and Methodology
- 19.3. Revenue Shift Analysis
- 19.4. Market Movement Analysis
- 19.5. Penetration-Growth (P-G) Matrix
- 19.6. E-Fuels Market for E-Diesel: Historical Trends (Since 2020) and Forecasted Estimates (Till 2035)
- 19.7. E-Fuels Market for E-Gasoline: Historical Trends (Since 202) and Forecasted Estimates (Till 2035)
- 19.8. E-Fuels Market for E-Hydrogen: Historical Trends (Since 202) and Forecasted Estimates (Till 2035)
- 19.9. E-Fuels Market for E-Kerosene: Historical Trends (Since 202) and Forecasted Estimates (Till 2035)
- 19.10. E-Fuels Market for E-Methane: Historical Trends (Since 202) and Forecasted Estimates (Till 2035)
- 19.11. E-Fuels Market for E-Methanol: Historical Trends (Since 202) and Forecasted Estimates (Till 2035)
- 19.12. E-Fuels Market for Others: Historical Trends (Since 202) and Forecasted Estimates (Till 2035)
- 19.13. Data Triangulation and Validation
- 19.13.1. Secondary Sources
- 19.13.2. Primary Sources
- 19.13.3. Statistical Modeling
20. MARKET OPPORTUNITIES BASED ON TYPE OF STATE
- 20.1. Chapter Overview
- 20.2. Key Assumptions and Methodology
- 20.3. Revenue Shift Analysis
- 20.4. Market Movement Analysis
- 20.5. Penetration-Growth (P-G) Matrix
- 20.6. E-Fuels Market for Gas: Historical Trends (Since 2020) and Forecasted Estimates (Till 2035)
- 20.7. E-Fuels Market for Liquid: Historical Trends (Since 2020) and Forecasted Estimates (Till 2035)
- 20.8. Data Triangulation and Validation
- 20.8.1. Secondary Sources
- 20.8.2. Primary Sources
- 20.8.3. Statistical Modeling
21. MARKET OPPORTUNITIES BASED ON TYPE OF PRODUCTION METHOD
- 21.1. Chapter Overview
- 21.2. Key Assumptions and Methodology
- 21.3. Revenue Shift Analysis
- 21.4. Market Movement Analysis
- 21.5. Penetration-Growth (P-G) Matrix
- 21.6. E-Fuels Market for Biologically Derived Fuels: Historical Trends (Since 2020) and Forecasted Estimates (Till 2035)
- 21.7. E-Fuels Market for Power-to-Gas: Historical Trends (Since 2020) and Forecasted Estimates (Till 2035)
- 21.8. E-Fuels Market for Power-to-Liquid: Historical Trends (Since 2020) and Forecasted Estimates (Till 2035)
- 21.9. Data Triangulation and Validation
- 21.9.1. Secondary Sources
- 21.9.2. Primary Sources
- 21.9.3. Statistical Modeling
22. MARKET OPPORTUNITIES BASED ON TYPE OF TECHNOLOGY
- 22.1. Chapter Overview
- 22.2. Key Assumptions and Methodology
- 22.3. Revenue Shift Analysis
- 22.4. Market Movement Analysis
- 22.5. Penetration-Growth (P-G) Matrix
- 22.6. E-Fuels Market for Direct Air Capture: Historical Trends (Since 2020) and Forecasted Estimates (Till 2035)
- 22.7. E-Fuels Market for Electrolysis: Historical Trends (Since 2020) and Forecasted Estimates (Till 2035)
- 22.8. E-Fuels Market for Fischer-Tropsch Synthesis: Historical Trends (Since 2020) and Forecasted Estimates (Till 2035)
- 22.9. E-Fuels Market for Methanation: Historical Trends (Since 2020) and Forecasted Estimates (Till 2035)
- 22.10. Data Triangulation and Validation
- 22.10.1. Secondary Sources
- 22.10.2. Primary Sources
- 22.10.3. Statistical Modeling
23. MARKET OPPORTUNITIES BASED ON TYPE OF END USER
- 23.1. Chapter Overview
- 23.2. Key Assumptions and Methodology
- 23.3. Revenue Shift Analysis
- 23.4. Market Movement Analysis
- 23.5. Penetration-Growth (P-G) Matrix
- 23.6. E-Fuels Market for Automotive: Historical Trends (Since 2020) and Forecasted Estimates (Till 2035)
- 23.7. E-Fuels Market for Aviation: Historical Trends (Since 2020) and Forecasted Estimates (Till 2035)
- 23.8. E-Fuels Market for Industrial: Historical Trends (Since 2020) and Forecasted Estimates (Till 2035)
- 23.9. E-Fuels Market for Marine: Historical Trends (Since 2020) and Forecasted Estimates (Till 2035)
- 23.10. E-Fuels Market for Railway: Historical Trends (Since 2020) and Forecasted Estimates (Till 2035)
- 23.11. E-Fuels Market for Others: Historical Trends (Since 2020) and Forecasted Estimates (Till 2035)
- 23.12. Data Triangulation and Validation
- 23.12.1. Secondary Sources
- 23.12.2. Primary Sources
- 23.12.3. Statistical Modeling
24. MARKET OPPORTUNITIES FOR E-FUELS IN NORTH AMERICA
- 24.1. Chapter Overview
- 24.2. Key Assumptions and Methodology
- 24.3. Revenue Shift Analysis
- 24.4. Market Movement Analysis
- 24.5. Penetration-Growth (P-G) Matrix
- 24.6. E-Fuels Market in North America: Historical Trends (Since 2020) and Forecasted Estimates (Till 2035)
- 24.6.1. E-Fuels Market in the US: Historical Trends (Since 2020) and Forecasted Estimates (Till 2035)
- 24.6.2. E-Fuels Market in Canada: Historical Trends (Since 2020) and Forecasted Estimates (Till 2035)
- 24.6.3. E-Fuels Market in Mexica: Historical Trends (Since 2020) and Forecasted Estimates (Till 2035)
- 24.6.4. E-Fuels Market in Other North American Countries: Historical Trends (Since 2020) and Forecasted Estimates (Till 2035)
- 24.7. Data Triangulation and Validation
25. MARKET OPPORTUNITIES FOR E-FUELS IN EUROPE
- 25.1. Chapter Overview
- 25.2. Key Assumptions and Methodology
- 25.3. Revenue Shift Analysis
- 25.4. Market Movement Analysis
- 25.5. Penetration-Growth (P-G) Matrix
- 25.6. E-Fuels Market in Europe: Historical Trends (Since 2020) and Forecasted Estimates (Till 2035)
- 25.6.1. E-Fuels Market in Austria: Historical Trends (Since 2020) and Forecasted Estimates (Till 2035)
- 25.6.2. E-Fuels Market in Belgium: Historical Trends (Since 2020) and Forecasted Estimates (Till 2035)
- 25.6.3. E-Fuels Market in Denmark: Historical Trends (Since 2020) and Forecasted Estimates (Till 2035)
- 25.6.4. E-Fuels Market in France: Historical Trends (Since 2020) and Forecasted Estimates (Till 2035)
- 25.6.5. E-Fuels Market in Germany: Historical Trends (Since 2020) and Forecasted Estimates (Till 2035)
- 25.6.6. E-Fuels Market in Ireland: Historical Trends (Since 2020) and Forecasted Estimates (Till 2035)
- 25.6.7. E-Fuels Market in Italy: Historical Trends (Since 2020) and Forecasted Estimates (Till 2035)
- 25.6.8. E-Fuels Market in Netherlands: Historical Trends (Since 2020) and Forecasted Estimates (Till 2035)
- 25.6.9. E-Fuels Market in Norway: Historical Trends (Since 2020) and Forecasted Estimates (Till 2035)
- 25.6.10. E-Fuels Market in Russia: Historical Trends (Since 2020) and Forecasted Estimates (Till 2035)
- 25.6.11. E-Fuels Market in Spain: Historical Trends (Since 2020) and Forecasted Estimates (Till 2035)
- 25.6.12. E-Fuels Market in Sweden: Historical Trends (Since 2020) and Forecasted Estimates (Till 2035)
- 25.6.13. E-Fuels Market in Switzerland: Historical Trends (Since 2020) and Forecasted Estimates (Till 2035)
- 25.6.14. E-Fuels Market in the UK: Historical Trends (Since 2020) and Forecasted Estimates (Till 2035)
- 25.6.15. E-Fuels Market in Other European Countries: Historical Trends (Since 2020) and Forecasted Estimates (Till 2035)
- 25.7. Data Triangulation and Validation
26. MARKET OPPORTUNITIES FOR E-FUELS IN ASIA
- 26.1. Chapter Overview
- 26.2. Key Assumptions and Methodology
- 26.3. Revenue Shift Analysis
- 26.4. Market Movement Analysis
- 26.5. Penetration-Growth (P-G) Matrix
- 26.6. E-Fuels Market in Asia: Historical Trends (Since 2020) and Forecasted Estimates (Till 2035)
- 26.6.1. E-Fuels Market in China: Historical Trends (Since 2020) and Forecasted Estimates (Till 2035)
- 26.6.2. E-Fuels Market in India: Historical Trends (Since 2020) and Forecasted Estimates (Till 2035)
- 26.6.3. E-Fuels Market in Japan: Historical Trends (Since 2020) and Forecasted Estimates (Till 2035)
- 26.6.4. E-Fuels Market in Singapore: Historical Trends (Since 2020) and Forecasted Estimates (Till 2035)
- 26.6.5. E-Fuels Market in South Korea: Historical Trends (Since 2020) and Forecasted Estimates (Till 2035)
- 26.6.6. E-Fuels Market in Other Asian Countries: Historical Trends (Since 2020) and Forecasted Estimates (Till 2035)
- 26.7. Data Triangulation and Validation
27. MARKET OPPORTUNITIES FOR E-FUELS IN MIDDLE EAST AND NORTH AFRICA (MENA)
- 27.1. Chapter Overview
- 27.2. Key Assumptions and Methodology
- 27.3. Revenue Shift Analysis
- 27.4. Market Movement Analysis
- 27.5. Penetration-Growth (P-G) Matrix
- 27.6. E-Fuels Market in Middle East and North Africa (MENA): Historical Trends (Since 2020) and Forecasted Estimates (Till 2035)
- 27.6.1. E-Fuels Market in Egypt: Historical Trends (Since 2020) and Forecasted Estimates (Till 205)
- 27.6.2. E-Fuels Market in Iran: Historical Trends (Since 2020) and Forecasted Estimates (Till 2035)
- 27.6.3. E-Fuels Market in Iraq: Historical Trends (Since 2020) and Forecasted Estimates (Till 2035)
- 27.6.4. E-Fuels Market in Israel: Historical Trends (Since 2020) and Forecasted Estimates (Till 2035)
- 27.6.5. E-Fuels Market in Kuwait: Historical Trends (Since 2020) and Forecasted Estimates (Till 2035)
- 27.6.6. E-Fuels Market in Saudi Arabia: Historical Trends (Since 2020) and Forecasted Estimates (Till 2035)
- 27.6.7. E-Fuels Market in United Arab Emirates (UAE): Historical Trends (Since 2020) and Forecasted Estimates (Till 2035)
- 27.6.8. E-Fuels Market in Other MENA Countries: Historical Trends (Since 2020) and Forecasted Estimates (Till 2035)
- 27.7. Data Triangulation and Validation
28. ADJACENT MARKET ANALYSIS
SECTION VII: STRATEGIC TOOLS
29. KEY WINNING STRATEGIES
30. PORTER'S FIVE FORCES ANALYSIS
31. SWOT ANALYSIS
32. VALUE CHAIN ANALYSIS
33. ROOTS STRATEGIC RECOMMENDATIONS
SECTION VIII: OTHER EXCLUSIVE INSIGHTS
34. INSIGHTS FROM PRIMARY RESEARCH
35. REPORT CONCLUSION
SECTION IX: APPENDIX
36. TABULATED DATA
37. LIST OF COMPANIES AND ORGANIZATIONS
38. CUSTOMIZATION OPPORTUNITIES
39. ROOTS SUBSCRIPTION SERVICES
40. AUTHOR DETAILS

