
PUBLISHER: Roots Analysis | PRODUCT CODE: 1883724

PUBLISHER: Roots Analysis | PRODUCT CODE: 1883724
Quantum Computing Market: Industry Trends and Global Forecasts,Till 2035 - Distribution by Type of Drug Discovery Service Offered, Therapeutic Area and Key Geographical Regions
Global Quantum Computing Market: Overview
As per Roots Analysis, the global quantum computing market is expected to grow from USD 422 million in the current year to USD 1,633 million, at a CAGR of 14.5% during the forecast period.
The market sizing and opportunity analysis has been segmented across the following parameters:
Type of Drug Discovery Service Offered
- Target Identification / Validation
- Hit Generation / Lead Identification
- Lead Optimization
Therapeutic Area
- Cardiovascular Disorders
- CNS Disorders
- Dermatological Disorders
- Endocrine Disorders
- Gastrointestinal Disorders
- Immunological Disorders
- Infectious Diseases
- Musculoskeletal Disorders
- Oncological Disorders
- Respiratory Disorders
- Others
Key Geographical Regions
- North America
- Europe
- Asia-Pacific
- Middle East and North Africa
- Latin America
Global Quantum Computing Market: Growth and Trends
On average, it requires 10-15 years and investments ranging from USD 4-10 billion to bring a drug to market, which renders the drug discovery process lengthy and resource intensive. To tackle these issues, developers are moving away from conventional methods towards the implementation of innovative discovery approaches. Quantum computing in drug discovery has become a key technology that helps identify promising lead candidates with the necessary physiochemical and pharmacokinetic properties, eliminating the need for extensive screening processes. Quantum computing functions in a fundamentally different manner compared to conventional binary computers, which depend on voltage-driven principles. In contrast to the distinct 0 and 1 states of single bits in conventional computing. Quantum computing leverages the concepts of quantum mechanics, using methods such as superconducting circuits or ion traps. This allows them to attain quantum superposition - a condition where quantum bits (qubits) can be in a concurrent state of both 0 and 1.
In recent years, quantum computing has advanced considerably and influenced the pharmaceutical and healthcare sectors by improving the mapping of interactions between a medication and its intended patient while decreasing the time and expenses related to the development processes. Moreover, due to the advantages linked to quantum computing and its growing demand, particularly in the biopharmaceutical sector for drug discovery and production, this area is anticipated to generate profitable business prospects for service providers.
Global Quantum Computing Market: Key Insights
The report delves into the current state of global quantum computing market and identifies potential growth opportunities within industry. Some key findings from the report include:
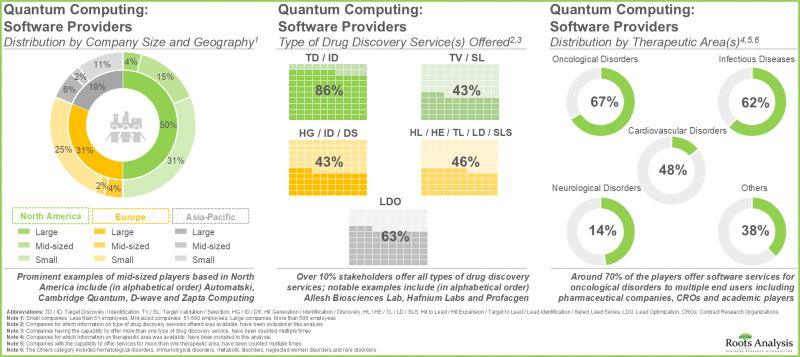
- Presently, over 45 players around the globe claim to offer quantum computing services across different steps of drug discovery.
- Leveraging their expertise, 86% stakeholders offer such services across target discovery / identification, primarily focusing on oncological disorders.
- In pursuit of gaining a competitive edge, manufacturers claim to be steadily expanding their existing capabilities in order to enhance their service portfolios related to quantum computing.
- Grants worth over USD 70 million have been awarded to various organizations that have actively undertaken R&D efforts to evaluate the potential of quantum computing in drug discovery.
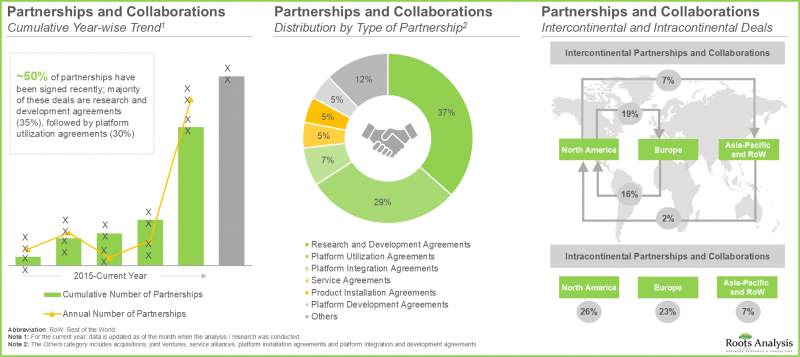
- A considerable increase in the partnership activity has been witnessed in the past few years; close to 50% of the collaborations were inked by firms based in the same region.
- Majority of these deals are research and development agreements (35%), followed by platform utilization agreements (30%).
- More than 30 players, worldwide, claim to offer hardware-as-a-service for quantum computing in drug discovery, and have developed the required expertise in different types of computational approaches.
- Majority of the quantum computing hardware providers, headquartered in North America, were established before the year 2000; in fact, ~50% of the overall market landscape is catered by large companies.
- The rise in the adoption of quantum computing in the biopharmaceutical industry is anticipated to create profitable business opportunities for both software and hardware providers.
- Based on the pioneer-migrator-settler map, we have classified the software providers into different categories; a selection of pioneers is expected to provide valuable offerings to lead the market in the long term.
- We expect the market to grow at an annualized rate of 14.5% in the coming decade; the opportunity is likely to be well distributed across types of drug discovery services, therapeutic areas and key geographical regions.

Global Quantum Computing Market: Key Segments
Lead Optimization Segment Occupies the Largest Share of the Quantum Computing Market
In terms of drug discovery service offered, the market is segmented into target identification / validation, hit generation / lead identification and lead optimization. At present, majority (~62%) of the market share is captured by lead optimization segment. Additionally, this segment is likely to grow at a faster pace compared to the other segments.
CNS Disorders are the Fastest Growing Therapeutic Area Segment in the Quantum Computing Market
In terms of the therapeutic area, the market is segmented into cardiovascular disorders, CNS disorders, dermatological disorders, endocrine disorders, gastrointestinal disorders, immunological disorders, infectious diseases, musculoskeletal disorders, oncological disorders, respiratory disorders and others. Currently, oncological disorders segment captures the highest proportion of quantum computing market. Further, the CNS disorders segment is expected to grow at a relatively higher CAGR.
North America Accounts for the Largest Share of the Market
In terms of key geographical regions, the market is segmented into North America, Europe, Asia- Pacific, Middle East and North Africa, and Latin America. Currently, North America (48%) dominates the quantum computing market and accounts for the largest revenue share. However, the market in Asia Pacific is expected to grow at a higher CAGR.
Example Players in the Global Quantum Computing Market
- Accenture
- Amazon Web Services
- Atos
- Fujitsu
- Huawei
- IBM
- Microsoft
- Xanadu
- XtalPi
Global Quantum Computing Market: Research Coverage
- Market Sizing and Opportunity Analysis: The report features an in-depth analysis of the global quantum computing market, focusing on key market segments, including [A] type of drug discovery service offered, [B] therapeutic area and [C] key geographical regions.
- Software Providers Market Landscape: A comprehensive evaluation of quantum computing software companies, considering various parameters, such as [A] year of establishment, [B] company size, [C] location of headquarters, [D] business capabilities, [E] platform capabilities, [F] type of drug discovery service(s) offered, [G] type of molecule(s) supported, [H] compatible computational approaches, [I] end user(s) and [J] therapeutic area(s).
- Company Competitiveness Analysis: An insightful competitive analysis of quantum computing software companies, examining factors, such as [A] company strength, [B] portfolio strength and [C] portfolio diversity.
- Company Profiles: In-depth profiles of quantum computing software / hardware companies, focusing on [A] company overview, [B] financial information (if available), [C] service portfolio, and [E] recent developments and an informed future outlook.
- Software Providers Market Landscape: A comprehensive evaluation of quantum computing hardware companies, considering various parameters, such as [A] year of establishment, [B] company size, [C] location of headquarters, [D] type of offering(s), [E] data storage on cloud and [F] compatible computational approaches.
- Grant Analysis: An in-depth analysis of over 170 academic grants focused on quantum computing in drug discovery across various relevant parameters, such as [A] year of grants awarded, [B] amount awarded, [C] support period, [D] type of study section, [E] administering institute center, [F] type of grant, [G] activity code, [H] funding mechanism and amount granted, [I] funding institute and support period, [J] prominent program officers, [K] location of recipient organizations, [L] popular recipient organizations, [M] organization type and [N] amount granted to popular recipient.
- Partnerships and Collaborations: A comprehensive analysis of various collaborations and partnerships that have been inked amongst stakeholders in this domain, based on [A] year of partnership, [B] type of partnership and [C] regional activity.
- Use Case Study: A detailed analysis of quantum computing use cases highlighting the applications of quantum computing across various industries, such as [A] chemical industry, [B] cybersecurity, [C] financial modeling, [D] space sciences, [E] oil and gas industry and [F] weather forecasting.
- Porter's Five Forces Analysis: An insightful analysis of the five competitive forces prevalent in quantum computing market supporting drug discovery, including threats for new entrants, bargaining power of buyers, bargaining power of suppliers, threats of substitute product and rivalry among existing competitors.
- Blue Ocean Strategy: A Strategic Guide for Start-Ups to Enter into Highly Competitive Market: A detailed analysis of the current and future market based on blue ocean strategy, covering a strategic plan / guide for emerging players in this industry to help unlock an uncontested market.
Key Questions Answered in this Report
- How many companies are currently engaged in this market?
- Which are the leading companies in this market?
- What factors are likely to influence the evolution of this market?
- What is the current and future market size?
- What is the CAGR of this market?
- How is the current and future market opportunity likely to be distributed across key market segments?
Reasons to Buy this Report
- The report provides a comprehensive market analysis, offering detailed revenue projections of the overall market and its specific sub-segments. This information is valuable to both established market leaders and emerging entrants.
- Stakeholders can leverage the report to gain a deeper understanding of the competitive dynamics within the market. By analyzing the competitive landscape, businesses can make informed decisions to optimize their market positioning and develop effective go-to-market strategies.
- The report offers stakeholders a comprehensive overview of the market, including key drivers, barriers, opportunities, and challenges. This information empowers stakeholders to stay abreast of market trends and make data-driven decisions to capitalize on growth prospects.
Additional Benefits
- Complimentary Excel Data Packs for all Analytical Modules in the Report
- 15% Free Content Customization
- Detailed Report Walkthrough Session with Research Team
- Free Updated report if the report is 6-12 months old or older
TABLE OF CONTENTS
1. PREFACE
- 1.1. Scope of the Report
- 1.2. Research Methodology
- 1.2.1. Research Assumptions
- 1.2.2. Project Methodology
- 1.2.3. Forecast Methodology
- 1.2.4. Robust Quality Control
- 1.2.5. Key Considerations
- 1.2.5.1. Demographics
- 1.2.5.2. Economic Factors
- 1.2.5.3. Government Regulations
- 1.2.5.4. Supply Chain
- 1.2.5.5. COVID Impact / Related Factors
- 1.2.5.6. Market Access
- 1.2.5.7. Healthcare Policies
- 1.2.5.8. Industry Consolidation
- 1.3 Key Questions Answered
- 1.4. Chapter Outlines
2. EXECUTIVE SUMMARY
3. INTRODUCTION
- 3.1. Chapter Overview
- 3.2. Overview of Quantum Computing in Drug Discovery
- 3.3. Drug Discovery and Development Timeline
- 3.4. Historical Evolution of Computational Drug Discovery Approaches
- 3.5. Classification of Quantum Computing Approaches
- 3.6. Applications of Quantum Computing in Drug Discovery Process
- 3.7. Advantages of Quantum Computing in Drug Discovery
- 3.8. Challenges Associated with Quantum Computing in Drug Discovery
- 3.9. Future Perspectives
4. MARKET LANDSCAPE: SOFTWARE PROVIDERS
- 4.1. Quantum Computing Software Providers: Overall Market Landscape
- 4.1.1. Analysis by Year of Establishment
- 4.1.2. Analysis by Company Size
- 4.1.3. Analysis by Location of Headquarters
- 4.1.4. Analysis by Business Capabilities
- 4.1.5. Analysis by Platform Capabilities
- 4.1.6. Analysis by Type of Drug Discovery Service(s) Offered
- 4.1.7. Analysis by Type of Molecule(s) Supported
- 4.1.8. Analysis by Compatible Computational Approaches
- 4.1.9. Analysis by End User(s)
- 4.1.10. Analysis by Therapeutic Area(s)
5. COMPANY COMPETITIVENESS ANALYSIS
- 5.1. Methodology and Key Parameters
- 5.2. Scoring Criteria
- 5.3. Company Competitiveness Analysis: Players based in North America (Peer Group I)
- 5.4. Company Competitiveness Analysis: Players based in Europe (Peer Group II)
- 5.5. Company Competitiveness Analysis: Players based in Asia-Pacific and Rest of the World (Peer Group III)
6. COMPANY PROFILES: SOFTWARE PROVIDERS
- 6.1. Accenture
- 6.1.1. Company Overview
- 6.1.2. Financial Information
- 6.1.3. Service Portfolio
- 6.1.4. Recent Developments and Future Outlook
- 6.2. Atos
- 6.2.1. Company Overview
- 6.2.2. Financial Information
- 6.2.3. Service Portfolio
- 6.2.4. Recent Developments and Future Outlook
- 6.3. Fujitsu
- 6.3.1. Company Overview
- 6.3.2. Financial Information
- 6.3.3. Service Portfolio
- 6.3.4. Recent Developments and Future Outlook
- 6.4. Huawei
- 6.4.1. Company Overview
- 6.4.2. Financial Information
- 6.4.3. Service Portfolio
- 6.4.4. Recent Developments and Future Outlook
- 6.5. Microsoft
- 6.5.1. Company Overview
- 6.5.2. Financial Information
- 6.5.3. Service Portfolio
- 6.5.4. Recent Developments and Future Outlook
- 6.6. Xanadu
- 6.6.1. Company Overview
- 6.6.2. Service Portfolio
- 6.6.3. Recent Developments and Future Outlook
- 6.7. XtalPi
- 6.7.1. Company Overview
- 6.7.2. Service Portfolio
- 6.7.3. Recent Developments and Future Outlook
7. MARKET LANDSCAPE: HARDWARE PROVIDERS
- 7.1. Quantum Computing Hardware Providers: Overall Market Landscape
- 7.1.1. Analysis by Year of Establishment
- 7.1.2. Analysis by Company Size
- 7.1.3. Analysis by Region of Headquarters
- 7.1.4. Analysis by Location of Headquarters
- 7.1.5. Analysis by Type of Offering(s)
- 7.1.6. Analysis by Data Storage on Cloud
- 7.1.7. Analysis by Compatible Computational Approaches
- 7.1.8. Analysis by Type of Offering(s) and Compatible Computational Approaches
8. COMPANY PROFILES: HARDWARE PROVIDERS
- 8.1. Amazon Web Services
- 8.1.1. Company Overview
- 8.1.2. Financial Information
- 8.1.3. Service Portfolio
- 8.1.4. Recent Developments and Future Outlook
- 8.2. IBM
- 8.2.1. Company Overview
- 8.2.2. Financial Information
- 8.2.3. Service Portfolio
- 8.2.4. Recent Developments and Future Outlook
- 8.3. Microsoft
- 8.3.1. Company Overview
- 8.3.2. Financial Information
- 8.3.3. Service Portfolio
- 8.3.4. Recent Developments and Future Outlook
9. ACADEMIC GRANTS ANALYSIS
- 9.1. Analysis Methodology
- 9.2. Key Parameters
- 9.3. Analysis by Year of Grant
- 9.4. Analysis by Amount Awarded
- 9.5. Analysis by Support Period
- 9.6. Analysis by Study Section
- 9.7. Word Cloud Analysis: Emerging Focus Areas
- 9.8. Analysis by Administering Institute Center
- 9.9. Analysis by Type of Grant
- 9.10. Analysis by Activity Code
- 9.11. Analysis by Purpose of Grant
- 9.12. Analysis by Administering Institute Center and Support Period
- 9.13. Prominent Program Officers: Analysis by Number of Grants
- 9.14. Analysis by Location of Recipient Organizations
- 9.15. Analysis by Type of Organization
- 9.16. Popular Recipient Organizations: Analysis by Number of Grants
- 9.17. Popular Recipient Organizations: Analysis by Amount Awarded
10. PARTNERSHIPS AND COLLABORATIONS
- 10.1. Partnership Models
- 10.2. Quantum Computing in Drug Discovery, Drug Manufacturing and Other Services: Partnerships and Collaborations
- 10.3. Analysis by Year of Partnership
- 10.4. Analysis by Type of Partnership
- 10.5. Analysis by Year and Type of Partnership
- 10.6. Most Active Players: Analysis by Number of Partnerships
- 10.7. Word Cloud Analysis: Key Focus Areas
- 10.8. Analysis by Type of Continent
- 10.9. Analysis by Company Size and Type of Partnership
- 10.10. Local and Intercontinental Agreements
- 10.11. Intercontinental and Intracontinental Agreements
11. USE CASE STUDY
- 11.1. Overview of Quantum Computing
- 11.2. Applications of Quantum Computing Across Various Industries
- 11.3. Upcoming Trends in Quantum Computing
- 11.4. Future Perspectives
12. PORTER'S FIVE FORCES ANALYSIS
- 12.1. Methodology and Assumptions
- 12.2. Key Parameters
- 12.2.1. Threats of New Entrants
- 12.2.2. Bargaining Power of Buyers
- 12.2.3. Bargaining Power of Suppliers
- 12.2.4. Threats of Substitute Products
- 12.2.5. Rivalry among Existing Competitors
13. BLUE OCEAN STRATEGY: A STRATEGIC GUIDE FOR START-UPS TO ENTER INTO HIGHLY COMPETITIVE MARKET
- 13.1. Overview of Blue Ocean Strategy
- 13.1.1. Red Oceans
- 13.1.2. Blue Oceans
- 13.1.3. Comparison of Red Ocean Strategy and Blue Ocean Strategy
- 13.1.4. Quantum Computing in Drug Discovery Services Market: Blue Ocean Strategy and Shift Tools
- 13.1.4.1. Value Innovation
- 13.1.4.2. Strategy Canvas
- 13.1.4.3. Four Action Framework
- 13.1.4.4. Eliminate-Raise-Reduce-Create (ERRC) Grid
- 13.1.4.5. Six Path Framework
- 13.1.4.6. Pioneer-Migrator-Settler (PMS) Map
- 13.1.4.7. Three Tiers of Non-customers
- 13.1.4.8. Sequence of Blue Ocean Strategy
- 13.1.4.9. Buyer Utility Map
- 13.1.4.10. The Price Corridor of the Mass
- 13.1.4.11. Four Hurdles to Strategy Execution
- 13.1.4.12. Tipping Point Leadership
- 13.1.4.13. Fair Process
14. MARKET SIZING AND OPPORTUNITY ANALYSIS
- 14.1. Forecast Methodology and Key Assumptions
- 14.2. Quantum Computing in Drug Discovery Services Market, Till 2035
- 14.2.1. Quantum Computing in Drug Discovery Services Market, Till 2035: Analysis by Type of Drug Discovery Service Offered
- 14.2.1.1. Quantum Computing in Drug Discovery Services Market for Target Identification / Validation, Till 2035
- 14.2.1.2. Quantum Computing in Drug Discovery Services Market for Hit Generation / Lead Identification, Till 2035
- 14.2.1.3. Quantum Computing in Drug Discovery Services Market for Target Lead Optimization, Till 2035
- 14.2.2. Quantum Computing in Drug Discovery Services Market, Till 2035: Analysis by Therapeutic Area
- 14.2.2.1. Quantum Computing in Drug Discovery Services Market for Cardiovascular Disorders, Till 2035
- 14.2.2.2. Quantum Computing in Drug Discovery Services Market for CNS Disorders, Till 2035
- 14.2.2.3. Quantum Computing in Drug Discovery Services Market for Dermatological Disorders, Till 2035
- 14.2.2.4. Quantum Computing in Drug Discovery Services Market for Endocrine Disorders, Till 2035
- 14.2.2.5. Quantum Computing in Drug Discovery Services Market for Gastrointestinal Disorders, Till 2035
- 14.2.2.6. Quantum Computing in Drug Discovery Services Market for Immunological Disorders, Till 2035
- 14.2.2.7. Quantum Computing in Drug Discovery Services Market for Infectious Diseases, Till 2035
- 14.2.2.8. Quantum Computing in Drug Discovery Services Market for Musculoskeletal Disorders, Till 2035
- 14.2.2.9. Quantum Computing in Drug Discovery Services Market for Oncological Disorders, Till 2035
- 14.2.2.10. Quantum Computing in Drug Discovery Services Market for Respiratory Disorders, Till 2035
- 14.2.2.11. Quantum Computing in Drug Discovery Services Market for Others, Till 2035
- 14.2.3. Quantum Computing in Drug Discovery Services Market, Till 2035: Analysis by Key Geographical Regions
- 14.2.3.1. Quantum Computing in Drug Discovery Services Market in North America, Till 2035
- 14.2.3.1.1. Quantum Computing in Drug Discovery Services Market in the US, Till 2035
- 14.2.3.1.2. Quantum Computing in Drug Discovery Services Market in Canada, Till 2035
- 14.2.3.2. Quantum Computing in Drug Discovery Services Market for Europe, Till 2035
- 14.2.3.2.1. Quantum Computing in Drug Discovery Services Market in the UK, Till 2035
- 14.2.3.2.2. Quantum Computing in Drug Discovery Services Market in France, Till 2035
- 14.2.3.2.3. Quantum Computing in Drug Discovery Services Market in Germany, Till 2035
- 14.2.3.2.4. Quantum Computing in Drug Discovery Services Market in Rest of Europe, Till 2035
- 14.2.3.3. Quantum Computing in Drug Discovery Services Market in Asia-Pacific, Till 2035
- 14.2.3.3.1. Quantum Computing in Drug Discovery Services Market in China, Till 2035
- 14.2.3.3.2. Quantum Computing in Drug Discovery Services Market in Japan, Till 2035
- 14.2.3.3.3. Quantum Computing in Drug Discovery Services Market in Rest of Asia-Pacific, Till 2035
- 14.2.3.4. Quantum Computing in Drug Discovery Services Market in Latin America, Till 2035
- 14.2.3.5. Quantum Computing in Drug Discovery Services Market in Middle East and North Africa, Till 2035
- 14.2.3.1. Quantum Computing in Drug Discovery Services Market in North America, Till 2035
- 14.2.1. Quantum Computing in Drug Discovery Services Market, Till 2035: Analysis by Type of Drug Discovery Service Offered
15. EXECUTIVE INSIGHTS
16. APPENDIX 1: TABULATED DATA
17. APPENDIX 2: LIST OF COMPANIES AND ORGANIZATIONS
List of Tables
- Table 4.1 List of Quantum Computing Software Providers
- Table 6.1 Accenture: Service Portfolio
- Table 6.2 Accenture: Recent Developments and Future Outlook
- Table 6.3 Atos: Service Portfolio
- Table 6.4 Atos: Recent Developments and Future Outlook
- Table 6.5 Fujitsu: Service Portfolio
- Table 6.6 Fujitsu: Recent Developments and Future Outlook
- Table 6.7 Huawei: Service Portfolio
- Table 6.8 Huawei: Recent Developments and Future Outlook
- Table 6.9 Microsoft: Service Portfolio
- Table 6.10 Microsoft: Recent Developments and Future Outlook
- Table 6.11 Xanadu: Service Portfolio
- Table 6.12 Xanadu: Recent Developments and Future Outlook
- Table 6.13 XtalPi: Service Portfolio
- Table 6.14 XtalPi: Recent Developments and Future Outlook
- Table 7.1 List of Quantum Computing Hardware Providers
- Table 8.1 Amazon Web Services: Recent Developments and Future Outlook
- Table 8.2 IBM: Recent Developments and Future Outlook
- Table 8.3 Microsoft: Recent Developments and Future Outlook
- Table 10.1 Quantum Computing in Drug Discovery Services: List of Partnerships and Collaborations
- Table 16.1 Quantum Computing Software Providers: Distribution by Year of Establishment
- Table 16.2 Quantum Computing Software Providers: Distribution by Company Size
- Table 16.3 Quantum Computing Software Providers: Distribution by Location of Headquarters
- Table 16.4 Quantum Computing Software Providers: Distribution by Business Capabilities
- Table 16.5 Quantum Computing Software Providers: Distribution by Platform Capabilities
- Table 16.6 Quantum Computing Software Providers: Distribution by Type of Drug Discovery Service(s) Offered
- Table 16.7 Quantum Computing Software Providers: Distribution by Type of Molecule(s) Supported
- Table 16.8 Quantum Computing Software Providers: Distribution by Type Compatible Computational Approaches
- Table 16.9 Quantum Computing Software Providers: Distribution by End user(s)
- Table 16.10 Quantum Computing Software Providers: Distribution by Therapeutic Area(s)
- Table 16.11 Accenture: Revenues in USD Billion (Since FY 2017)
- Table 16.12 Atos: Revenues in EUR Billion (Since FY 2017)
- Table 16.13 Fujitsu: Revenues in Yen Billion (Since FY 2017)
- Table 16.14 Huawei: Revenues in CNY Billion (Since FY 2017)
- Table 16.15 Microsoft: Revenues in USD Billion (Since FY 2017)
- Table 16.16 Quantum Computing Hardware Providers: Distribution by Year of Establishment
- Table 16.17 Quantum Computing Hardware Providers: Distribution by Company Size
- Table 16.18 Quantum Computing Hardware Providers: Distribution by Region of Headquarters
- Table 16.19 Quantum Computing Hardware Providers: Distribution by Location of Headquarters
- Table 16.20 Quantum Computing Hardware Providers: Distribution by Type of Offering(s)
- Table 16.21 Quantum Computing Hardware Providers: Distribution by Data Storage on Cloud
- Table 16.22 Quantum Computing Hardware Providers: Distribution by Compatible Computational Approaches
- Table 16.23 Quantum Computing Hardware Providers: Distribution by Type of offering(s) and Compatible Computational Approaches
- Table 16.24 Amazon Web Services: Revenues in USD Billion (Since FY 2017)
- Table 16.25 IBM: Revenues in USD Billion (Since FY 2017)
- Table 16.26 Microsoft: Revenues in USD Billion (Since FY 2017)
- Table 16.27 Academic Grants Analysis: Distribution by Year of Grant
- Table 16.28 Academic Grants Analysis: Distribution by Amount Awarded
- Table 16.29 Academic Grants Analysis: Distribution by Support Period
- Table 16.30 Academic Grants Analysis: Distribution by Study Section
- Table 16.31 Academic Grants Analysis: Distribution by Administrating Institute Center
- Table 16.32 Academic Grants Analysis: Distribution by Type of Grant
- Table 16.33 Academic Grants Analysis: Distribution by Activity Code
- Table 16.34 Academic Grants Analysis: Distribution by Purpose of Grant
- Table 16.35 Academic Grants Analysis: Distribution by Administering Institute Center and Support Period
- Table 16.36 Prominent Program Officers: Distribution by Number of Grants
- Table 16.37 Academic Grants Analysis: Distribution by Location of Organizations
- Table 16.38 Academic Grants Analysis: Distribution by Type of Organization
- Table 16.39 Popular Recipient Organizations: Analysis by Number of Grants
- Table 16.40 Popular Recipient Organizations: Analysis by Amount Awarded
- Table 16.41 Partnerships and Collaborations: Distribution by Year
- Table 16.42 Partnerships and Collaborations: Distribution by Type of Partnership
- Table 16.43 Partnerships and Collaborations: Distribution by Year and Type of Partnership
- Table 16.44 Most Active Players: Distribution by Number of Partnerships
- Table 16.45 Partnerships and Collaborations: Distribution by Type of Continent
- Table 16.46 Partnerships and Collaborations: Distribution by Company Size and Type of Partnership
- Table 16.47 Partnerships and Collaborations: Local and International Agreements
- Table 16.48 Partnerships and Collaborations: Intercontinental and Intracontinental Agreements
- Table 16.49 Quantum Computing in Drug Discovery Services Market, Till 2035: Scenario I, Scenario II and Scenario III (USD Million)
- Table 16.50 Quantum Computing in Drug Discovery Services Market: Distribution by Type of Drug Discovery Service Offered
- Table 16.51 Quantum Computing in Drug Discovery Services Market for Target Identification / Validation, Till 2035: Scenario I, Scenario II and Scenario III (USD Million)
- Table 16.52 Quantum Computing in Drug Discovery Services Market for Hit Generation / Lead Identification, Till 2035: Scenario I, Scenario II and Scenario III (USD Million)
- Table 16.53 Quantum Computing in Drug Discovery Services Market for Target Lead Optimization, Till 2035: Scenario I, Scenario II and Scenario III (USD Million)
- Table 16.54 Quantum Computing in Drug Discovery Services Market: Distribution by Therapeutic Area
- Table 16.55 Quantum Computing in Drug Discovery Services Market for Cardiovascular Disorders, Till 2035: Scenario I, Scenario II and Scenario III (USD Million)
- Table 16.56 Quantum Computing in Drug Discovery Services Market for CNS Disorders, Till 2035: Scenario I, Scenario II and Scenario III (USD Million)
- Table 16.57 Quantum Computing in Drug Discovery Services Market for Dermatological Disorders, Till 2035: Scenario I, Scenario II and Scenario III (USD Million)
- Table 16.58 Quantum Computing in Drug Discovery Services Market for Endocrine Disorders, Till 2035: Scenario I, Scenario II and Scenario III (USD Million)
- Table 16.59 Quantum Computing in Drug Discovery Services Market for Gastrointestinal Disorders, Till 2035: Scenario I, Scenario II and Scenario III (USD Million)
- Table 16.60 Quantum Computing in Drug Discovery Services Market for Immunological Disorders, Till 2035: Scenario I, Scenario II and Scenario III (USD Million)
- Table 16.61 Quantum Computing in Drug Discovery Services Market for Infectious Diseases, Till 2035: Scenario I, Scenario II and Scenario III (USD Million)
- Table 16.62 Quantum Computing in Drug Discovery Services Market for Musculoskeletal Disorders, Till 2035: Scenario I, Scenario II and Scenario III (USD Million)
- Table 16.63 Quantum Computing in Drug Discovery Services Market for Oncological Disorders, Till 2035: Scenario I, Scenario II and Scenario III (USD Million)
- Table 16.64 Quantum Computing in Drug Discovery Services Market for Respiratory Disorders, Till 2035: Scenario I, Scenario II and Scenario III (USD Million)
- Table 16.65 Quantum Computing in Drug Discovery Services Market for Others, Till 2035: Scenario I, Scenario II and Scenario III (USD Million)
- Table 16.66 Quantum Computing in Drug Discovery Services Market: Distribution by Key Geographical Regions
- Table 16.67 Quantum Computing in Drug Discovery Services Market in North America, Till 2035: Scenario I, Scenario II and Scenario III (USD Million)
- Table 16.68 Quantum Computing in Drug Discovery Services Market in the US, Till 2035: Scenario I, Scenario II and Scenario III (USD Million)
- Table 16.69 Quantum Computing in Drug Discovery Services Market in Canada, Till 2035: Scenario I, Scenario II and Scenario III (USD Million)
- Table 16.70 Quantum Computing in Drug Discovery Services Market for Europe, Till 2035: Scenario I, Scenario II and Scenario III (USD Million)
- Table 16.71 Quantum Computing in Drug Discovery Services Market in the UK, Till 2035: Scenario I, Scenario II and Scenario III (USD Million)
- Table 16.72 Quantum Computing in Drug Discovery Services Market in France, Till 2035: Scenario I, Scenario II and Scenario III (USD Million)
- Table 16.73 Quantum Computing in Drug Discovery Services Market in Germany, Till 2035: Scenario I, Scenario II and Scenario III (USD Million)
- Table 16.74 Quantum Computing in Drug Discovery Services Market in Rest of Europe, Till 2035: Scenario I, Scenario II and Scenario III (USD Million)
- Table 16.75 Quantum Computing in Drug Discovery Services Market in Asia-Pacific, Till 2035: Scenario I, Scenario II and Scenario III (USD Million)
- Table 16.76 Quantum Computing in Drug Discovery Services Market in China, Till 2035: Scenario I, Scenario II and Scenario III (USD Million)
- Table 16.77 Quantum Computing in Drug Discovery Services Market in Japan, Till 2035: Scenario I, Scenario II and Scenario III (USD Million)
- Table 16.78 Quantum Computing in Drug Discovery Services Market in Rest of Asia-Pacific, Till 2035: Scenario I, Scenario II and Scenario III (USD Million)
- Table 16.79 Quantum Computing in Drug Discovery Services Market in Latin America, Till 2035: Scenario I, Scenario II and Scenario III (USD Million)
- Table 16.80 Quantum Computing in Drug Discovery Services Market in Middle East and North Africa, Till 2035: Scenario I, Scenario II and Scenario III (USD Million)
List of Figures
- Figure 4.1 Quantum Computing Software Providers: Distribution by Year of Establishment
- Figure 4.2 Quantum Computing Software Providers: Distribution by Company Size
- Figure 4.3 Quantum Computing Software Providers: Distribution by Location of Headquarters
- Figure 4.4 Quantum Computing Software Providers: Distribution by Business Capabilities
- Figure 4.5 Quantum Computing Software Providers: Distribution by Platform Capabilities
- Figure 4.6 Quantum Computing Software Providers: Distribution by Type of Drug Discovery Service(s) Offered
- Figure 4.7 Quantum Computing Software Providers: Distribution by Type of Molecule(s) Supported
- Figure 4.8 Quantum Computing Software Providers: Distribution by Compatible Computational Approaches
- Figure 4.9 Quantum Computing Software Providers: Distribution by End user(s)
- Figure 4.10 Quantum Computing Software Providers: Distribution by Therapeutic Area(s)
- Figure 5.1 Company Competitiveness Analysis: Players based in North America (Peer Group I)
- Figure 5.2 Company Competitiveness Analysis: Players based in Europe (Peer Group II)
- Figure 5.3 Company Competitiveness Analysis: Players based in Asia-Pacific and Rest of the World (Peer Group III)
- Figure 6.1 Accenture: Revenues in USD Billion (Since FY 2017)
- Figure 6.2 Atos: Revenues in EUR Billion (Since FY 2017)
- Figure 6.3 Fujitsu: Revenues in Yen Billion (Since FY 2017)
- Figure 6.4 Huawei: Revenues in CNY Billion (Since FY 2017)
- Figure 6.5 Microsoft: Revenues in USD Billion (Since FY 2017)
- Figure 7.1 Quantum Computing Hardware Providers: Distribution by Year of Establishment
- Figure 7.2 Quantum Computing Hardware Providers: Distribution by Company Size
- Figure 7.3 Quantum Computing Hardware Providers: Distribution by Region of Headquarters
- Figure 7.4 Quantum Computing Hardware Providers: Distribution by Location of Headquarters
- Figure 7.5 Quantum Computing Hardware Providers: Distribution by Type of Offering(s)
- Figure 7.6 Quantum Computing Hardware Providers: Distribution by Data Storage on Cloud
- Figure 7.6 Quantum Computing Hardware Providers: Distribution by Compatible Computational Approaches
- Figure 7.7 Quantum Computing Hardware Providers: Distribution by Type of Offering(s) and Compatible Computational Approaches
- Figure 8.1 Amazon Web Services: Revenues in USD Billion (Since FY 2017)
- Figure 8.2 Amazon Web Services: Service Portfolio
- Figure 8.3 IBM: Revenues in USD Billion (Since FY 2017)
- Figure 8.4 IBM: Service Portfolio
- Figure 8.5 Microsoft: Revenues in USD Billion (Since FY 2017)
- Figure 8.6 Microsoft: Service Portfolio
- Figure 9.1 Academic Grants Analysis: Distribution by Year of Grant
- Figure 9.2 Academic Grants Analysis: Distribution by Amount Awarded
- Figure 9.3 Academic Grants Analysis: Distribution by Support Period
- Figure 9.4 Academic Grants Analysis: Distribution by Study Section
- Figure 9.5 Word Cloud Analysis: Emerging Focus Areas
- Figure 9.6 Academic Grants Analysis: Distribution by Administrating Institute Center
- Figure 9.7 Academic Grants Analysis: Distribution by Type of Grant
- Figure 9.8 Academic Grants Analysis: Distribution by Activity Code
- Figure 9.9 Academic Grants Analysis: Distribution by Purpose of Grant
- Figure 9.10 Academic Grants Analysis: Distribution by Funding Institute Center and Support Period
- Figure 9.11 Prominent Program Officers: Distribution by Number of Grants
- Figure 9.12 Academic Grants Analysis: Distribution by Location of Recipient Organizations
- Figure 9.13 Academic Grants Analysis: Distribution by Type of Organization
- Figure 9.14 Popular Recipient Organizations: Analysis by Number of Grants
- Figure 9.15 Popular Recipient Organizations: Analysis by Amount Awarded
- Figure 10.1 Partnerships and Collaborations: Cumulative Year-wise Trend
- Figure 10.2 Partnerships and Collaborations: Distribution by Type of Partnership
- Figure 10.3 Partnerships and Collaborations: Distribution by Year and Type of Partnership
- Figure 10.4 Most Active Players: Distribution by Number of Partnerships
- Figure 10.5 Word Cloud Analysis: Emerging Focus Areas
- Figure 10.6 Partnerships and Collaborations: Distribution by Type of Continent
- Figure 10.7 Partnerships and Collaborations: Distribution by Company Size and Type of Partnership
- Figure 10.8 Partnerships and Collaborations: Local and International Agreements
- Figure 10.9 Partnerships and Collaborations: Intercontinental and Intracontinental Agreements
- Figure 10.10 Partnerships and Collaborations: Key Value Drivers
- Figure 12.1 Porter's Five Forces: Key Parameters
- Figure 12.2 Porter's Five Forces: Harvey Ball Analysis
- Figure 13.1 Blue Ocean Strategy: Strategy Canvas
- Figure 13.2 Blue Ocean Strategy: Pioneer-Migrator-Settler (PMS) Map
- Figure 14.1 Quantum Computing in Drug Discovery Services Market, Till 2035 (USD Million)
- Figure 14.2 Quantum Computing in Drug Discovery Services Market: Distribution by Type of Drug Discovery Service Offered
- Figure 14.3 Quantum Computing in Drug Discovery Services Market for Target Identification / Validation, Till 2035 (USD Million)
- Figure 14.4 Quantum Computing in Drug Discovery Services Market for Hit Generation / Lead Identification, Till 2035 (USD Million)
- Figure 14.5 Quantum Computing in Drug Discovery Services Market for Target Lead Optimization, Till 2035 (USD Million)
- Figure 14.6 Quantum Computing in Drug Discovery Services Market: Distribution by Therapeutic Area
- Figure 14.7 Quantum Computing in Drug Discovery Services Market for Cardiovascular Disorders, Till 2035 (USD Million)
- Figure 14.8 Quantum Computing in Drug Discovery Services Market for CNS Disorders, Till 2035 (USD Million)
- Figure 14.9 Quantum Computing in Drug Discovery Services Market for Dermatological Disorders, Till 2035 (USD Million)
- Figure 14.10 Quantum Computing in Drug Discovery Services Market for Endocrine Disorders, Till 2035 (USD Million)
- Figure 14.11 Quantum Computing in Drug Discovery Services Market for Gastrointestinal Disorders, Till 2035 (USD Million)
- Figure 14.12 Quantum Computing in Drug Discovery Services Market for Immunological Disorders, Till 2035 (USD Million)
- Figure 14.13 Quantum Computing in Drug Discovery Services Market for Infectious Diseases, Till 2035 (USD Million)
- Figure 14.14 Quantum Computing in Drug Discovery Services Market for Musculoskeletal Disorders, Till 2035 (USD Million)
- Figure 14.15 Quantum Computing in Drug Discovery Services Market for Oncological Disorders, Till 2035 (USD Million)
- Figure 14.16 Quantum Computing in Drug Discovery Services Market for Respiratory Disorders, Till 2035 (USD Million)
- Figure 14.17 Quantum Computing in Drug Discovery Services Market for Others, Till 2035 (USD Million)
- Figure 14.18 Quantum Computing in Drug Discovery Services Market: Distribution by Key Geographical Regions
- Figure 14.19 Quantum Computing in Drug Discovery Services Market in North America, Till 2035 (USD Million)
- Figure 14.20 Quantum Computing in Drug Discovery Services Market in the US, Till 2035 (USD Million)
- Figure 14.21 Quantum Computing in Drug Discovery Services Market in Canada, Till 2035 (USD Million)
- Figure 14.22 Quantum Computing in Drug Discovery Services Market for Europe, Till 2035 (USD Million)
- Figure 14.23 Quantum Computing in Drug Discovery Services Market in the UK, Till 2035 (USD Million)
- Figure 14.24 Quantum Computing in Drug Discovery Services Market in France, Till 2035 (USD Million)
- Figure 14.25 Quantum Computing in Drug Discovery Services Market in Germany, Till 2035 (USD Million)
- Figure 14.26 Quantum Computing in Drug Discovery Services Market in Rest of Europe, Till 2035 (USD Million)
- Figure 14.27 Quantum Computing in Drug Discovery Services Market in Asia-Pacific, Till 2035 (USD Million)
- Figure 14.28 Quantum Computing in Drug Discovery Services Market in China, Till 2035 (USD Million)
- Figure 14.29 Quantum Computing in Drug Discovery Services Market in Japan, Till 2035 (USD Million)
- Figure 14.30 Quantum Computing in Drug Discovery Services Market in Rest of Asia-Pacific, Till 2035 (USD Million)
- Figure 14.31 Quantum Computing in Drug Discovery Services Market in Latin America, Till 2035 (USD Million)
- Figure 14.32 Quantum Computing in Drug Discovery Services Market in Middle East and North Africa, Till 2035 (USD Million)

