
PUBLISHER: Roots Analysis | PRODUCT CODE: 1891252

PUBLISHER: Roots Analysis | PRODUCT CODE: 1891252
NGS Kits Market: Industry Trends and Global Forecasts, Till 2035 - Distribution by Type of Nucleotide Sequenced, Type of End User and Key Geographical Regions
NGS Kits Market: Overview
As per Roots Analysis, the NGS kits market is estimated to grow from USD 1.1 billion in the current year and is anticipated to grow to USD 11.5 billion during the forecast period, till 2035.
NGS Kits Market: Overview
The market sizing and opportunity analysis has been segmented across the following parameters:
Type of Nucleotide Sequenced
- DNA
- RNA
End-user
- Academics and Research Institutes
- Pharmaceutical and Biotechnology Companies
- Hospitals and Clinics
- Other End-users
Key Geographies
- North America
- Europe
- Asia-Pacific
- Latin America
- Middle East and North Africa
- Rest of the World
NGS Kits market: Growth and Trends
The field of genomic data gathering and analysis has progressed notably since Frederick Sanger introduced a gene sequencing technique in 1977. Improvements in DNA sequencing methods have resulted in notable progress across various healthcare-related research areas, including precision medicine and diagnostics. Specifically, the effect of next generation sequencing (NGS) techniques and NGS testing kits, which facilitate whole genome and whole exome sequencing, has been the most significant. This advanced, rapid genome sequencing method has significantly lowered both the expenses and time required. In comparison to the Human Genome Project (~USD 3 billion), the expense of sequencing an individual genome has significantly dropped (to USD 1,000) with present technologies.
Due to the continuous advancements in NGS testing kits and next generation sequencing kits market, stakeholders also expect that, in the coming decade, the previously mentioned cost might drop to USD 100. It is important to note that this reduction in genome sequencing expenses has resulted in a rise in the number of genomes sequenced worldwide.
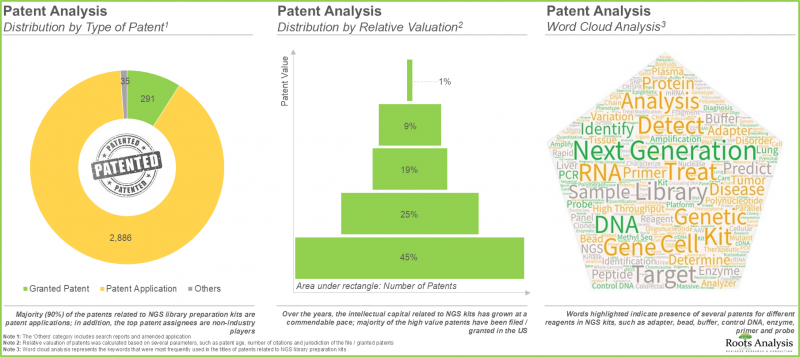
Despite the recent advances in the field of genomics, the nucleotide library preparation process still faces several challenges, including requirement of large amounts of input samples, low volume of yield and concerns related to quality of the product. In addition, the manual DNA library / RNA library preparation process is time consuming, requiring extensive manipulation and expensive reagents. Therefore, innovators in the pharmaceutical industry are constantly identifying / developing ways to improve the process of DNA library / RNA library preparation. Amidst other alternatives, the use of NGS library preparation kits has emerged as a viable option for various drug developers and academic / research institutes to overcome the existing challenges associated with conventional DNA library / RNA library preparation methods. These kits require less input material and are capable of generating precise DNA encoded library / RNA libraries with minimum errors. Presently, more than 280 NGS library preparation kits are available in the market; these are compatible with a broad range of sequencing platforms, including Illumina(R), Ion Torrent(R) and BGI NGS platforms. It is worth mentioning that over 3,200 patents related to NGS library preparation kits have been filed / granted in the past few years, demonstrating the continued innovation in NGS kits market. Driven by the increasing demand for gene therapies and the introduction of novel and advanced NGS techniques, the NGS library preparation kits market is anticipated to witness steady market growth during the forecast period.
NGS Kits Market: Key Insights
The report delves into the current state of the NGS kits market and identifies potential growth opportunities within industry. Some key findings from the report include:
- Presently, more than 280 NGS library preparation kits are being offered by close to 60 players; these kits are compatible with a variety of input samples, including purified RNA / DNA and cells.
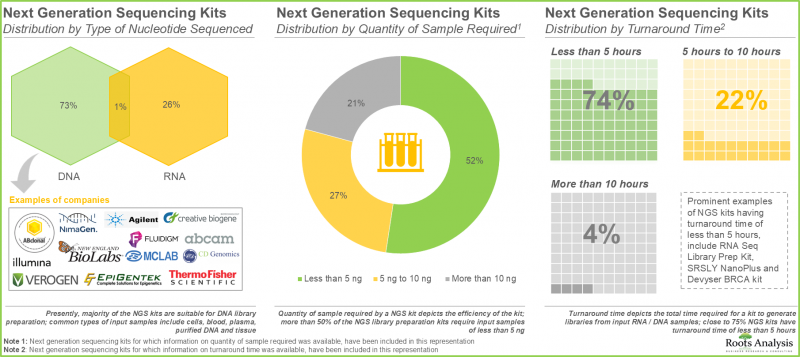
- Leveraging their expertise, stakeholders are offering a myriad of NGS kits for preparing DNA and RNA libraries; majority of these kits require less than 5 ng of input samples
- The current market landscape is fragmented, featuring both new entrants and established players; the US is currently considered to be a hub of innovation for NGS library preparation kits.
- In pursuit of gaining a competitive edge, NGS library preparation kit providers are presently focusing on expansion of their existing capabilities and augmenting their respective product portfolios.
- Over 3,250 patents related to NGS library preparation kits have recently been filed / granted, indicating the heightened pace of innovation in this domain.
- Around 70 industry players claim to offer elaborate portfolios of NGS based services, leveraging a variety of second and third generation sequencing technologies.
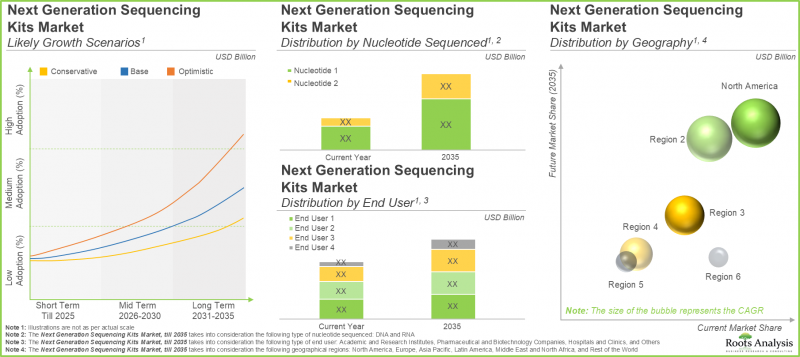
- The market is anticipated to grow at a notable CAGR till 2035; the projected opportunity is likely to be distributed across different type of nucleotide sequenced, end user and key geographical regions.
NGS Kits Market: Key Segments
DNA Segment is Likely to Capture Majority of the NGS Kits Market Share
In terms of type of nucleotide sequenced, the market is segmented across DNA and RNA. In the current year, the DNA segment captures most of the market share (~ 70%). However, the RNA segment will grow at a higher CAGR of 5.1% during the forecast period.
Hospitals and Clinics are Likely to Capture the Highest NGS Kits Market Share in 2035
In terms of end-users, the market is segmented across hospitals and clinics, pharmaceutical and biotechnology companies, academic and research institutes and others. Around 45% of the market share will be captured by hospitals and clinics by 2035, followed by pharmaceutical and biotechnology companies capturing 30% of the market share.
North America is Likely to Propel the Growth of NGS Kits Market
In terms of geographical regions, the market is segmented across North America, Europe, Asia Pacific, MENA, Latin America, and rest of the world. Notably, North America will capture the maximum market share of around 40% by 2035.
Example Players in NGS Kits Market
- Agilent Technologies
- BioDynami
- Creative Biogene
- New England Biolabs
- PerkinElmer
- Thermo Fisher Scientific
- Abcam
- Devyser
- Diagenode
- Lexogen
- Roche
- Tecan
- Enzynomics
- MGI
- Takara Bio
- TIANGEN Biotech
- TransGen Biotech
- Vazym
NGS Kits Market: Research Coverage
- Market Sizing and Opportunity Analysis: The report features an in-depth analysis of the next generation sequencing kits market, focusing on key market segments, including [A] type of nucleotide sequenced, [B] type of end user, [C] and [E] key geographical regions.
- Market Landscape: A detailed assessment of overall competitive landscape next generation sequencing based on several relevant parameters, such as [A] type of nucleotide sequenced, [B] kit components, [C] quantity of sample required, [D] turnaround time, [E] storage temperature, [F] type of sample used, [G] kit shelf life, [H] type of sequencing and [I] type of sequencing platform used.
- Company Competitiveness Analysis: A comprehensive NGS library preparation kits examining factors, such as [A] supplier power and [B] product competitiveness.
- Company Profiles: In-depth profiles of NGS library preparation kits providers in North America, Europe and Asia-Pacific, based on several parameters such as [A] year of establishment, [B] location of headquarters, [C] proprietary technology platforms, [D] recent developments and [E] an informed future outlook.
- Patent Analysis: An in-depth patent analysis to provide an overview of how the industry is evolving from the R&D perspective such as [A] publication year, [B] geographical region, [C] CPC symbols, [D] patent focus areas, [E] type of applicant and [F] leading industry players.
Key Questions Answered in this Report
- How many companies are currently engaged in this market?
- Which are the leading companies in this market?
- What is the current global capacity of developers?
- What factors are likely to influence the evolution of this market?
- What is the current and future market size?
- What is the CAGR of this market?
- How is the current and future market opportunity likely to be distributed across key market segments?
Reasons to Buy this Report
- The report provides a comprehensive market analysis, offering detailed revenue projections of the overall market and its specific sub-segments. This information is valuable to both established market leaders and emerging entrants.
- Stakeholders can leverage the report to gain a deeper understanding of the competitive dynamics within the market. By analyzing the competitive landscape, businesses can make informed decisions to optimize their market positioning and develop effective go-to-market strategies.
- The report offers stakeholders a comprehensive overview of the market, including key drivers, barriers, opportunities, and challenges. This information empowers stakeholders to stay abreast of market trends and make data-driven decisions to capitalize on growth prospects.
Additional Benefits
- Complimentary PPT Insights Packs
- Complimentary Excel Data Packs for all Analytical Modules in the Report
- 15% Free Content Customization
- Detailed Report Walkthrough Session with Research Team
- Free Updated report if the report is 6-12 months old or older
TABLE OF CONTENTS
1. PREFACE
- 1.1. Scope of the Report
- 1.2. Research Methodology
- 1.3. Key Questions Answered
- 1.4. Chapter Outlines
2. EXECUTIVE SUMMARY
3. INTRODUCTION
- 3.1. Chapter Overview
- 3.2. Overview of Genome Sequencing
- 3.3. Types of Genome Sequencing
- 3.3.1. Next Generation Sequencing
- 3.3.1.1. Applications of Next Generation Sequencing
- 3.3.1.1.1. Cancer and Affiliated Biomarker Research
- 3.3.1.1.2. Diagnostics
- 3.3.1.1.3. Personalized / Precision Medicine
- 3.3.1.1.4. Forensics
- 3.3.1.2. Steps Involved in Next Generation Sequencing
- 3.3.1.2.1. Library Preparation
- 3.3.1.2.2. Amplification
- 3.3.1.2.3. Sequencing
- 3.3.1.2.4. Bioinformatics Analysis and Data Interpretation
- 3.3.1.3. Components of Next Generation Sequencing Kits
- 3.3.1.1. Applications of Next Generation Sequencing
- 3.3.1. Next Generation Sequencing
- 3.4. Future Perspectives
4. MARKET LANDSCAPE
- 4.1. Chapter Overview
- 4.2. Next Generation Sequencing Kits: Overall Market Landscape
- 4.2.1. Analysis by Type of Nucleotide Sequenced
- 4.2.2. Analysis by Kit Components
- 4.2.3. Analysis by Quantity of Sample Required
- 4.2.4. Analysis by Turnaround Time
- 4.2.5. Analysis by Storage Temperature
- 4.2.6. Analysis by Type of Sample Used
- 4.2.7. Analysis by Kit Shelf Life
- 4.2.8. Analysis by Type of Sequencing
- 4.2.9. Analysis by Type of Sequencing Platform Used
- 4.3. Next Generation Sequencing Kits: List of Providers
- 4.3.1. Analysis by Year of Establishment
- 4.3.2. Analysis by Company Size
- 4.3.3. Analysis by Location of Headquarters
- 4.3.4. Leading Players: Analysis by Number of Products
5. PRODUCT COMPETITIVENESS ANALYSIS
- 5.1. Chapter Overview
- 5.2. Assumptions and Methodology
- 5.3. Product Competitiveness Analysis: Competitive Landscape
6. COMPANY PROFILES: NEXT GENERATION SEQUENCING KITS PROVIDERS IN NORTH AMERICA
- 6.1. Chapter Overview
- 6.2. Agilent Technologies
- 6.2.1. Company Overview
- 6.2.2. Financial Information
- 6.2.3. NGS Kit Portfolio
- 6.2.4. Recent Developments and Future Outlook
- 6.3. BioDynami
- 6.3.1. Company Overview
- 6.3.2. NGS Kit Portfolio
- 6.3.3. Recent Developments and Future Outlook
- 6.4. Creative Biogene
- 6.4.1. Company Overview
- 6.4.2. NGS Kit Portfolio
- 6.4.3. Recent Developments and Future Outlook
- 6.5. New England Biolabs
- 6.5.1. Company Overview
- 6.5.2. NGS Kit Portfolio
- 6.5.3. Recent Developments and Future Outlook
- 6.6. PerkinElmer
- 6.6.1. Company Overview
- 6.6.2. Financial Information
- 6.6.3. NGS Kit Portfolio
- 6.6.4. Recent Developments and Future Outlook
- 6.7. Thermo Fisher Scientific
- 6.7.1. Company Overview
- 6.7.2. Financial Information
- 6.7.3. NGS Kit Portfolio
- 6.7.4. Recent Developments and Future Outlook
7. COMPANY PROFILES: NEXT GENERATION SEQUENCING KITS PROVIDERS IN EUROPE
- 7.1. Chapter Overview
- 7.2. Abcam
- 7.2.1 Company Overview
- 7.2.2. Financial Information
- 7.2.3. NGS Kit Portfolio
- 7.2.4. Recent Developments and Future Outlook
- 7.3. Devyser
- 7.3.1 Company Overview
- 7.3.2. NGS Kit Portfolio
- 7.3.3. Recent Developments and Future Outlook
- 7.4. Diagenode
- 7.4.1 Company Overview
- 7.4.2. NGS Kit Portfolio
- 7.4.3. Recent Developments and Future Outlook
- 7.5. Lexogen
- 7.5.1 Company Overview
- 7.5.2. NGS Kit Portfolio
- 7.5.3. Recent Developments and Future Outlook
- 7.6. Roche
- 7.6.1 Company Overview
- 7.6.2. Financial Information
- 7.6.3. NGS Kit Portfolio
- 7.6.4. Recent Developments and Future Outlook
- 7.7. Tecan
- 7.7.1 Company Overview
- 7.7.2. Financial Information
- 7.7.3. NGS Kit Portfolio
- 7.7.4. Recent Developments and Future Outlook
8. COMPANY PROFILES: NEXT GENERATION SEQUENCING KITS PROVIDERS IN ASIA PACIFIC
- 8.1. Chapter Overview
- 8.2. Enzynomics
- 8.2.1. Company Overview
- 8.2.2. NGS Kit Portfolio
- 8.2.3. Recent Developments and Future Outlook
- 8.3. MGI
- 8.3.1. Company Overview
- 8.3.2. NGS Kit Portfolio
- 8.3.3. Recent Developments and Future Outlook
- 8.4. Takara Bio
- 8.4.1. Company Overview
- 8.4.2. Financial Information
- 8.4.3. NGS Kit Portfolio
- 8.4.4. Recent Developments and Future Outlook
- 8.5. TIANGEN Biotech
- 8.5.1. Company Overview
- 8.5.2. NGS Kit Portfolio
- 8.5.3. Recent Developments and Future Outlook
- 8.6. TransGen Biotech
- 8.6.1. Company Overview
- 8.6.2. NGS Kit Portfolio
- 8.6.3. Recent Developments and Future Outlook
- 8.7. Vazyme
- 8.7.1. Company Overview
- 8.7.2. NGS Kit Portfolio
- 8.7.3. Recent Developments and Future Outlook
9. PATENT ANALYSIS
- 9.1. Chapter Overview
- 9.2. Scope and Methodology
- 9.3. Next Generation Sequencing Kits: Patent Analysis
- 9.3.1 Analysis by Publication Year
- 9.3.2. Analysis by Geography
- 9.3.3. Analysis by CPC Symbols
- 9.3.4. Emerging Focus Areas
- 9.3.5. Analysis by Type of Applicant
- 9.3.6. Leading Players: Analysis by Number of Patents
- 9.4. Next Generation Sequencing Kits: Patent Benchmarking
- 9.4.1. Analysis by Patent Characteristics
- 9.5. Next Generation Sequencing Kits: Patent Valuation
- 9.6. Leading Patents: Analysis by Number of Citations
10. MARKET FORECAST AND OPPORTUNITY ANALYSIS
- 10.1. Chapter Overview
- 10.2. Forecast Methodology and Key Assumptions
- 10.3. Global Next Generation Sequencing Kits Market, Till 2035
- 10.3.1. Next Generation Sequencing Kits Market, 2021 and 2035: Distribution by Type of Nucleotide Sequenced
- 10.3.1.1. Next Generation Sequencing Kits Market for DNA, Till 2035
- 10.3.1.2. Next Generation Sequencing Market for RNA, Till 2035
- 10.3.2. Next Generation Sequencing Kits Market, 2021 and 2035: Distribution by Type of End User
- 10.3.2.1. Next Generation Sequencing Kits Market for Academic and Research Institutes, Till 2035
- 10.3.2.2. Next Generation Sequencing Kits Market for Pharmaceutical and Biotechnology Companies, Till 2035
- 10.3.2.3. Next Generation Sequencing Kits Market for Hospitals and Clinics, Till 2035
- 10.3.2.4. Next Generation Sequencing Kits Market for Others, Till 2035
- 10.3.3. Next Generation Sequencing Kits Market, 2021 and 2035: Distribution by Geography
- 10.3.3.1. Next Generation Sequencing Kits Market in North America, Till 2035
- 10.3.3.2. Next Generation Sequencing Kits Market in Europe, Till 2035
- 10.3.3.3. Next Generation Sequencing Kits Market in Asia Pacific, Till 2035
- 10.3.3.4. Next Generation Sequencing Kits Market in Middle East and North Africa, Till 2035
- 10.3.3.5. Next Generation Sequencing Kits Market in Latin America, Till 2035
- 10.3.3.6. Next Generation Sequencing Kits Market in Rest of the World, Till 2035
- 10.3.1. Next Generation Sequencing Kits Market, 2021 and 2035: Distribution by Type of Nucleotide Sequenced
11. CASE STUDY: NEXT GENERATION SEQUENCING TECHNOLOGIES AND SERVICE PROVIDERS
- 11.1. Chapter Overview
- 11.2. Historical Evolution of Genome Sequencing
- 11.2.1. First Generation DNA Sequencers
- 11.2.2. Second Generation HT-NGS Platforms
- 11.2.3. Third Generation HT-NGS Platforms
- 11.2.3.1. Heliscope Single Molecule Sequencer
- 11.2.3.2. Single Molecule Real Time Sequencer
- 11.2.3.3. Single Molecule Real Time (RNAP) Sequencer
- 11.2.3.4. Nanopore DNA Sequencer
- 11.2.3.5. Multiplex Polony Technology
- 11.2.3.6. The Ion Torrent Sequencing Technology
- 11.2.4. Comparison of First, Second and Third Generation technologies
- 11.3. Next Generation Sequencing Technologies
- 11.3.1. Analysis by Type of Application
- 11.4. Next Generation Sequencing Service Providers
- 11.4.1. Next Generation Sequencing Service Providers: Industry Players
- 11.4.2. Analysis by Year of Establishment
- 11.4.3. Analysis by Company Size
- 11.4.4. Analysis by Location of Headquarters
- 11.4.5. Analysis by Type of Service Offered
- 11.5. Next Generation Sequencing Service Providers: Non-Industry Players
- 11.5.1. Analysis by Year of Establishment
- 11.5.2. Analysis by Location of Headquarters
- 11.5.3. Analysis by Type of Service Offered
12. CONCLUDING REMARKS
13. EXECUTIVE INSIGHTS
- 13.1. Chapter Overview
- 13.2. Company A
- 13.2.1. Company Snapshot
- 13.2.2. Interview Transcript: General Manager, Very Large Company, Switzerland
14. APPENDIX 1: TABULATED DATA
15. APPENDIX 2: LIST OF COMPANIES AND ORGANIZATIONS
List of Tables
- Table 4.1 Next Generation Sequencing Kits: List of Products
- Table 4.2 Next Generation Sequencing Kits: Information on Type of Sample Used, Kit Shelf Life, Type of Sequencing and Type of Sequencing Platform Used
- Table 4.3 Next Generation Sequencing Kits: List of Providers
- Table 6.1 Leading NGS Kit Providers in North America
- Table 6.2 Agilent Technologies: Company Snapshot
- Table 6.3 Agilent Technologies: NGS Kit Portfolio
- Table 6.4 Agilent Technologies: Recent Developments and Future Outlook
- Table 6.5 BioDynami: Company Snapshot
- Table 6.6 BioDynami: NGS Kit Portfolio
- Table 6.7 BioDynami: Recent Developments and Future Outlook
- Table 6.8 Creative Biogene: Company Snapshot
- Table 6.9 Creative Biogene: NGS Kit Portfolio
- Table 6.10 Creative Biogene: Recent Developments and Future Outlook
- Table 6.11 New England Biolabs: Company Snapshot
- Table 6.12 New England Biolabs: NGS Kit Portfolio
- Table 6.13 New England Biolabs: Recent Developments and Future Outlook
- Table 6.14 PerkinElmer: Company Snapshot
- Table 6.15 PerkinElmer: NGS Kit Portfolio
- Table 6.16 PerkinElmer: Recent Developments and Future Outlook
- Table 6.17 Thermo Fisher Scientific: Company Snapshot
- Table 6.18 Thermo Fisher Scientific: NGS Kit Portfolio
- Table 6.19 Thermo Fisher Scientific: Recent Developments and Future Outlook
- Table 7.1 Leading NGS Kit Providers in Europe
- Table 7.2 Abcam: Company Snapshot
- Table 7.3 Abcam: NGS Kit Portfolio
- Table 7.4 Abcam: Recent Developments and Future Outlook
- Table 7.5 Devyser: Company Snapshot
- Table 7.6 Devyser: NGS Kit Portfolio
- Table 7.7 Devyser: Recent Developments and Future Outlook
- Table 7.8 Diagenode: Company Snapshot
- Table 7.9 Diagenode: NGS Kit Portfolio
- Table 7.10 Diagenode: Recent Developments and Future Outlook
- Table 7.11 Lexogen: Company Snapshot
- Table 7.12 Lexogen: NGS Kit Portfolio
- Table 7.13 Lexogen: Recent Developments and Future Outlook
- Table 7.14 Roche: Company Snapshot
- Table 7.15 Roche: NGS Kit Portfolio
- Table 7.16 Roche: Recent Developments and Future Outlook
- Table 7.17 Tecan: Company Snapshot
- Table 7.18 Tecan: NGS Kit Portfolio
- Table 7.19 Tecan: Recent Developments and Future Outlook
- Table 8.1 Leading NGS Kit Providers in Asia Pacific
- Table 8.2 Enzynomics: Company Snapshot
- Table 8.3 Enzynomics: NGS Kit Portfolio
- Table 8.4 MGI: Company Snapshot
- Table 8.5 MGI: NGS Kit Portfolio
- Table 8.6 Takara Bio: Company Snapshot
- Table 8.7 Takara Bio: NGS Kit Portfolio
- Table 8.8 Takara Bio: Recent Developments and Future Outlook
- Table 8.9 TIANGEN Biotech: Company Snapshot
- Table 8.10 TIANGEN Biotech: NGS Kit Portfolio
- Table 8.11 TransGen Biotech: Company Snapshot
- Table 8.12 TransGen Biotech: NGS Kit Portfolio
- Table 8.13 Vazyme: Company Snapshot
- Table 8.14 Vazyme: NGS Kit Portfolio
- Table 9.1 Patent Analysis: Prominent CPC Symbols
- Table 9.2 Patent Analysis: Most Popular CPC Symbols
- Table 9.3 Patent Analysis: List of Top CPC Symbols
- Table 9.4 Patent Analysis: Summary of Benchmarking Analysis
- Table 9.5 Patent Analysis: Categorization based on Weighted Valuation Scores
- Table 9.6 Patent Portfolio: List of Leading Patents (in terms of Highest Relative Valuation)
- Table 9.7 Patent Portfolio: List of Leading Patents (in terms of Number of Citations)
- Table 11.1 Comparison of First, Second and Third Generation Sequencing Technologies
- Table 11.2 Next Generation Sequencing: List of Available Technologies
- Table 11.3 Next Generation Sequencing Service Providers: List of Industry Players
- Table 11.4 Next Generation Sequencing Service Providers: List of Non-Industry Players
- Table 13.1 Tecan: Company Snapshot
- Table 14.1 Next Generation Sequencing Kits: Distribution by Type of Nucleotide Sequenced
- Table 14.2 Next Generation Sequencing Kits: Distribution by Kit Components
- Table 14.3 Next Generation Sequencing Kits: Distribution by Quantity of Sample Required
- Table 14.4 Next Generation Sequencing Kits: Distribution by Turnaround Time
- Table 14.5 Next Generation Sequencing Kits: Distribution by Storage Temperature
- Table 14.6 Next Generation Sequencing Kits: Distribution by Type of Sample Used
- Table 14.7 Next Generation Sequencing Kits: Distribution by Kit Shelf Life
- Table 14.8 Next Generation Sequencing Kits: Distribution by Type of Sequencing
- Table 14.9 Next Generation Sequencing Kits: Type of Sequencing Platform Used
- Table 14.10 Next Generation Sequencing Kit Providers: Distribution by Year of Establishment
- Table 14.11 Next Generation Sequencing Kit Providers: Distribution by Company Size
- Table 14.12 Next Generation Sequencing Kit Providers: Distribution by Location of Headquarters
- Table 14.13 Leading Players: Distribution by Number of Products
- Table 14.14 Agilent Technologies: Annual Revenues, Since 2016 (USD Billion)
- Table 14.15 PerkinElmer: Annual Revenues, Since 2021 (USD Billion)
- Table 14.16 Thermo Fisher Scientific: Annual Revenues, Since 2016 (USD Billion)
- Table 14.17 Abcam: Annual Revenues, FY 2016-H1 2021 (GBP Million)
- Table 14.18 Roche: Annual Revenues, 2016-H1 2021 (CHF Billion)
- Table 14.19 Tecan: Annual Revenues, 2016-H1 2021 (CHF Million)
- Table 14.20 Takara Bio: Annual Revenues, FY 2016-Q1 2021 (JPY Billion)
- Table 14.21 Patent Analysis: Distribution by Type of Patent
- Table 14.22 Patent Analysis: Distribution by Year of Publication
- Table 14.23 Patent Analysis: Distribution by Location of Patent Jurisdiction (Region-wise)
- Table 14.24 Patent Analysis: Distribution by Location of Jurisdiction (Country-wise)
- Table 14.25 Patent Analysis: Distribution by CPC Symbols
- Table 14.26 Patent Analysis: Cumulative Year-wise Distribution by Type of Applicant
- Table 14.27 Leading Industry Players: Distribution by Number of Patents
- Table 14.28 Leading Non-Industry Players: Distribution by Number of Patents
- Table 14.29 Leading Patent Assignees: Distribution by Number of Patents
- Table 14.30 Patent Analysis: Distribution by Age
- Table 14.31 Patent Analysis: Patent Valuation
- Table 14.32 Global Next Generation Sequencing Kits Market, Till 2035: Conservative, Base and Optimistic Scenarios (USD Billion)
- Table 14.33 Next Generation Sequencing Kits Market, 2021 and 2035: Distribution by Type of Nucleotide Sequenced (USD Billion)
- Table 14.34 Next Generation Sequencing Kits Market for DNA, Till 2035: Conservative, Base and Optimistic Scenarios (USD Billion)
- Table 14.35 Next Generation Sequencing Market for RNA, Till 2035: Conservative, Base and Optimistic Scenarios (USD Billion)
- Table 14.36 Next Generation Sequencing Kits Market, 2021 and 2035: Distribution by Type of End User (USD Billion)
- Table 14.37 Next Generation Sequencing Kits Market for Academic and Research Institutes, Till 2035: Conservative, Base and Optimistic Scenarios (USD Billion)
- Table 14.38 Next Generation Sequencing Kits Market for Pharmaceutical and Biotechnology Companies, Till 2035: Conservative, Base and Optimistic Scenarios (USD Billion)
- Table 14.39 Next Generation Sequencing Kits Market for Hospitals and Clinics, Till 2035: Conservative, Base and Optimistic Scenarios (USD Billion)
- Table 14.40 Next Generation Sequencing Kits Market for Others, Till 2035: Conservative, Base and Optimistic Scenarios (USD Billion)
- Table 14.41 Next Generation Sequencing Kits, 2021 and 2035: Distribution by Geography (USD Billion)
- Table 14.42 Next Generation Sequencing Kits Market in North America, Till 2035: Conservative, Base and Optimistic Scenarios (USD Billion)
- Table 14.43 Next Generation Sequencing Kits Market in Europe, Till 2035: Conservative, Base and Optimistic Scenarios (USD Billion)
- Table 14.44 Next Generation Sequencing Kits Market in Asia-Pacific, Till 2035: Conservative, Base and Optimistic Scenarios (USD Billion)
- Table 14.45 Next Generation Sequencing Kits Market in Middle East and North Africa, Till 2035: Conservative, Base and Optimistic Scenarios (USD Billion)
- Table 14.46 Next Generation Sequencing Kits Market in Latin America, Till 2035: Conservative, Base and Optimistic Scenarios (USD Billion)
- Table 14.47 Next Generation Sequencing Kits Market in Rest of the World, Till 2035: Conservative, Base and Optimistic Scenarios (USD Billion)
- Table 14.48 Next Generation Sequencing Technologies: Analysis by Type of Application
- Table 14.49 Next Generation Sequencing Service Providers (Industry Players): Distribution by Year of Establishment
- Table 14.50 Next Generation Sequencing Service Providers (Industry Players): Distribution by Company Size
- Table 14.51 Next Generation Sequencing Service Providers (Industry Players): Distribution by Location of Headquarters
- Table 14.52 Next Generation Sequencing Service Providers (Industry Players): Distribution by Type of Service Offered
- Table 14.53 Next Generation Sequencing Service Providers (Non-Industry Players): Distribution by Year of Establishment
- Table 14.54 Next Generation Sequencing Service Providers (Non-Industry Players): Distribution by Location of Headquarters
- Table 14.55 Next Generation Sequencing Service Providers (Non-Industry Players): Distribution by Type of Service Offered
List of Figures
- Figure 2.1 Executive Summary: Market Forecast
- Figure 2.2 Executive Summary: Overall Market Landscape
- Figure 2.3 Executive Summary: Patent Analysis
- Figure 3.1 Types of Sequencing
- Figure 3.2 Applications of Next Generation Sequencing
- Figure 3.3 Steps Involved in Next Generation Sequencing
- Figure 4.1 Next Generation Sequencing Kits: Distribution by Type of Nucleotide Sequenced
- Figure 4.2 Next Generation Sequencing Kits: Distribution by Kit Components
- Figure 4.3 Next Generation Sequencing Kits: Distribution by Quantity of Sample Required
- Figure 4.4 Next Generation Sequencing Kits: Distribution by Turnaround Time
- Figure 4.5 Next Generation Sequencing Kits: Distribution by Storage Temperature
- Figure 4.6 Next Generation Sequencing Kits: Distribution by Type of Sample Used
- Figure 4.7 Next Generation Sequencing Kits: Distribution by Kit Shelf Life
- Figure 4.8 Next Generation Sequencing Kits: Distribution by Type of Sequencing
- Figure 4.9 Next Generation Sequencing Kits: Distribution by Type of Sequencing Platform Used
- Figure 4.10 Next Generation Sequencing Kit Providers: Distribution by Year of Establishment
- Figure 4.11 Next Generation Sequencing Kit Providers: Distribution by Company Size
- Figure 4.12 Next Generation Sequencing Kit Providers: Distribution by Location of Headquarters
- Figure 4.13 Leading Players: Distribution by Number of Products
- Figure 5.1 Next Generation Sequencing Kits: Dot Plot Analysis
- Figure 5.2 Product Competitiveness Analysis: Competitive Landscape
- Figure 6.1 Agilent Technologies: Annual Revenues, Since 2016 (USD Billion)
- Figure 6.2 PerkinElmer: Annual Revenues, Since 2016 (USD Billion)
- Figure 6.3 Thermo Fisher Scientific: Annual Revenues, Since 2016 (USD Billion)
- Figure 7.1 Abcam: Annual Revenues, Since 2016 (GBP Million)
- Figure 7.2 Roche: Annual Revenues, Since 2016 (CHF Billion)
- Figure 7.3 Tecan: Annual Revenues, Since 2016 (CHF Million)
- Figure 8.1 Takara Bio: Annual Revenues, Since 2016 (JPY Billion)
- Figure 9.1 Patent Analysis: Distribution by Type of Patent
- Figure 9.2 Patent Analysis: Distribution by Year of Publication
- Figure 9.3 Patent Analysis: Distribution by Location of Patent Jurisdiction (Region-wise)
- Figure 9.4 Patent Analysis: Distribution by Location of Patent Jurisdiction (Country-wise)
- Figure 9.5 Patent Analysis: Distribution by CPC Symbols
- Figure 9.6 Patent Analysis: Emerging Focus Areas
- Figure 9.7 Patent Analysis: Cumulative Year-wise Distribution by Type of Applicant
- Figure 9.8 Leading Industry Players: Distribution by Number of Patents
- Figure 9.9 Leading Non-Industry Players: Distribution by Number of Patents
- Figure 9.10 Leading Patent Assignees: Distribution by Number of Patents
- Figure 9.11 Patent Benchmarking: Distribution of Leading Industry Player by Patent Characteristics (CPC Symbols)
- Figure 9.12 Patent Analysis: Distribution by Age
- Figure 9.13 Patent Analysis: Patent Valuation
- Figure 10.1 Global Next Generation Sequencing Kits Market, Till 2035 (USD Billion)
- Figure 10.2 Next Generation Sequencing Kits: Likely Growth Scenarios
- Figure 10.3 Next Generation Sequencing Kits Market: Distribution by Type of Nucleotide Sequenced (USD Billion)
- Figure 10.4 Next Generation Sequencing Kits Market for DNA, Till 2035 (USD Billion)
- Figure 10.5 Next Generation Sequencing Market for RNA, Till 2035 (USD Billion)
- Figure 10.6 Next Generation Sequencing Kits Market: Distribution by Type of End User (USD Billion)
- Figure 10.7 Next Generation Sequencing Kits Market for Academic and Research Institutes, Till 2035 (USD Billion)
- Figure 10.8 Next Generation Sequencing Kits Market for Pharmaceutical and Biotechnology Companies, Till 2035 (USD Billion)
- Figure 10.9 Next Generation Sequencing Kits Market for Hospitals and Clinics, Till 2035 (USD Billion)
- Figure 10.10 Next Generation Sequencing Kits Market for Others, Till 2035 (USD Billion)
- Figure 10.11 Next Generation Sequencing Kits: Distribution by Geography(USD Billion)
- Figure 10.12 Next Generation Sequencing Kits Market in North America, Till 2035 (USD Billion)
- Figure 10.13 Next Generation Sequencing Kits Market in Europe, Till 2035 (USD Billion)
- Figure 10.14 Next Generation Sequencing Kits Market in Asia Pacific, Till 2035 (USD Billion)
- Figure 10.15 Next Generation Sequencing Kits Market in Middle East and North Africa, Till 2035 (USD Billion)
- Figure 10.16 Next Generation Sequencing Kits Market in Latin America, Till 2035 (USD Billion)
- Figure 10.17 Next Generation Sequencing Kits Market in Rest of the World, Till 2035 (USD Billion)
- Figure 11.1 Third Generation HT-NGS Platforms
- Figure 11.2 Next Generation Sequencing Technologies: Analysis by Type of Application
- Figure 11.3 Next Generation Sequencing Service Providers (Industry Players): Distribution by Year of Establishment
- Figure 11.4 Next Generation Sequencing Service Providers (Industry Players): Distribution by Company Size
- Figure 11.5 Next Generation Sequencing Service Providers (Industry Players): Distribution by Location of Headquarters
- Figure 11.6 Next Generation Sequencing Service Providers (Industry Players): Distribution by Type of Service Offered
- Figure 11.7 Next Generation Sequencing Service Providers (Non-Industry Players): Distribution by Year of Establishment
- Figure 11.8 Next Generation Sequencing Service Providers (Non-Industry Players): Distribution by Location of Headquarters
- Figure 11.9 Next Generation Sequencing Service Providers (Non-Industry Players): Distribution by Type of Service Offered
- Figure 12.1 Concluding Remarks: Overall Market Landscape
- Figure 12.2 Concluding Remarks: Patent Analysis
- Figure 12.3 Concluding Remarks: Market Forecast

