
PUBLISHER: Roots Analysis | PRODUCT CODE: 1958445

PUBLISHER: Roots Analysis | PRODUCT CODE: 1958445
Smart Dust Market, Till 2035: Distribution by Type of Dust, Type of Component, Type of Manufacturing Process, End User, and Geographical Regions: Industry Trends and Global Forecasts
Smart Dust Market Overview
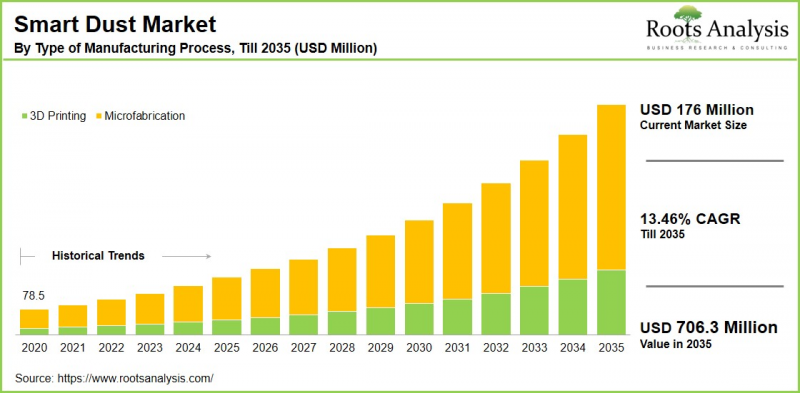
As per Roots Analysis, the global smart dust market size is estimated to grow from USD 176 million in the current year USD 706.3 million by 2035, at a CAGR of 13.46% during the forecast period, till 2035.
The opportunity for smart dust market has been distributed across the following segments:
Type of Dust
- Biodegradable
- Non-Biodegradable
Type of Component
- Active Optical Transmission
- Control Circuitry
- Passive Optical Transmission
- Sensors
- Signal Processing
- Others
Type of Manufacturing Process
- 3D Printing
- Microfabrication
End User
- Aerospace and Defense
- BFSI
- Consumer Goods & Retail
- Healthcare
- Manufacturing
- Media & Entertainment
- Others
Geographical Regions
- North America
- US
- Canada
- Mexico
- Other North American countries
- Europe
- Austria
- Belgium
- Denmark
- France
- Germany
- Ireland
- Italy
- Netherlands
- Norway
- Russia
- Spain
- Sweden
- Switzerland
- UK
- Other European countries
- Asia
- China
- India
- Japan
- Singapore
- South Korea
- Other Asian countries
- Latin America
- Brazil
- Chile
- Colombia
- Venezuela
- Other Latin American countries
- Middle East and North Africa
- Egypt
- Iran
- Iraq
- Israel
- Kuwait
- Saudi Arabia
- UAE
- Other MENA countries
- Rest of the World
- Australia
- New Zealand
- Other countries
Smart Dust Market: Growth and Trends
The collection of tiny wireless sensors is referred to as smart dust. These sensors are capable of detecting various environmental changes, including temperature, light, sound, and chemical variations, and often measure under a millimeter in size. It is important to note that smart dust operates by collecting and transmitting data in real-time through wireless communication, allowing for comprehensive monitoring in various environments. Significantly, the benefits of smart dust include its efficiency in gathering large volumes of data, its compact size enabling deployment in hard-to-access locations, and its potential to improve decision-making with real-time analytics.
The smart dust market globally is predicted to experience substantial growth during the forecast period, driven by accelerated industrialization in developing nations like China and India. Moreover, recent advancements and innovations in smart dust products, including greater integration with artificial intelligence and machine learning, are noteworthy. Innovations, such as the increasing demand for Internet of Things (IoT) applications, promote smooth data exchange across sectors like healthcare, manufacturing, and agriculture.
Additionally, progress in nanotechnology and the creation of microelectromechanical systems (MEMS) are advancing the possibilities for smart dust applications, making them more adaptable and affordable for real-time monitoring of essential processes. Considering the above mentioned factors, the smart dust market is expected to grow at a significant rate during the forecast period.
Smart Dust Market: Key Segments
Market Share by Type of Dust
Based on type of dust, the global smart dust market is segmented into biodegradable and non-biodegradable. According to our estimates, currently, the non-biodegradable segment captures the majority of the market share. This dominance can be attributed to its superior durability, stability, and performance across various applications.
However, the biodegradable segment is expected to grow at a higher CAGR during the forecast period. This trend can be linked to the rising environmental concerns and a growing demand for sustainable technologies, as biodegradable smart dust can naturally decompose, thereby minimizing ecological impact.
Market Share by Type of Component
Based on type of component, the global smart dust market is segmented into active optical transmission, control circuitry, passive optical transmission, sensors, signal processing and others. According to our estimates, currently, the sensors segment captures the majority of the market share. This dominance is due to their essential function in facilitating the primary operations of smart dust systems, which involves gathering and relaying real-time data for various uses, such as environmental monitoring, healthcare, and industrial automation.
Market Share by Type of Manufacturing Process
Based on type of manufacturing process, the global smart dust market is segmented into 3D printing and microfabrication. According to our estimates, currently, the microfabrication segment captures the majority of the market share. This is due to its unmatched precision and capability to produce complex micro and nanoscale structures vital for the operation of smart dust devices.
However, the 3D printing segment is expected to grow at a higher CAGR during the forecast period, due to its capacity to manufacture intricate and customized designs at a microscale, which perfectly meets the detailed requirements of smart dust applications.
Market Share by End User
Based on end user, the global smart dust market is segmented into aerospace and defense, BFSI, consumer goods & retail, healthcare, manufacturing, media & entertainment and others. According to our estimates, currently, the healthcare segment captures the majority of the market share and this segment is projected to grow at a higher CAGR during the forecast period. This growth can be attributed to the essential requirement for advanced monitoring and data collection technologies that improve patient care and operational efficiencies.
Market Share by Geographical Regions
Based on geographical regions, the smart dust market is segmented into North America, Europe, Asia, Latin America, Middle East and North Africa, and the rest of the world. According to our estimates, currently Asia captures the majority share of the market.
In addition, the market in North America is expected to grow at a higher CAGR during the forecast period, owing to the advancements in technology and innovation, especially within the sectors of defense, healthcare, and industrial automation.
Example Players in Smart Dust Market
- Analog Devices
- BetaBatt
- Bosch Sensortec
- Defendec
- Hitachi
- Honeywell
- IBM
- Infineon Technologies
- Maxim Integrated
- Memsic
- Panasonic
- Sony
- Texas Instruments
- Valarm
Smart Dust Market: Research Coverage
The report on the smart dust market features insights on various sections, including:
- Market Sizing and Opportunity Analysis: An in-depth analysis of the smart dust market, focusing on key market segments, including [A] type of dust, [B] type of component, [C] type of manufacturing process, [D] end user, and [E] geographical regions.
- Competitive Landscape: A comprehensive analysis of the companies engaged in the smart dust market, based on several relevant parameters, such as [A] year of establishment, [B] company size, [C] location of headquarters and [D] ownership structure.
- Company Profiles: Elaborate profiles of prominent players engaged in the smart dust market, providing details on [A] location of headquarters, [B] company size, [C] company mission, [D] company footprint, [E] management team, [F] contact details, [G] financial information, [H] operating business segments, [I] portfolio, [J] moat analysis, [K] recent developments, and an informed future outlook.
- Megatrends: An evaluation of ongoing megatrends in the smart dust industry.
- Patent Analysis: An insightful analysis of patents filed / granted in the smart dust domain, based on relevant parameters, including [A] type of patent, [B] patent publication year, [C] patent age and [D] leading players.
- Recent Developments: An overview of the recent developments made in the smart dust market, along with analysis based on relevant parameters, including [A] year of initiative, [B] type of initiative, [C] geographical distribution and [D] most active players.
- Porter's Five Forces Analysis: An analysis of five competitive forces prevailing in the smart dust market, including threats of new entrants, bargaining power of buyers, bargaining power of suppliers, threats of substitute products and rivalry among existing competitors.
- SWOT Analysis: An insightful SWOT framework, highlighting the strengths, weaknesses, opportunities and threats in the domain. Additionally, it provides Harvey ball analysis, highlighting the relative impact of each SWOT parameter.
- Value Chain Analysis: A comprehensive analysis of the value chain, providing information on the different phases and stakeholders involved in the smart dust market.
Key Questions Answered in this Report
- How many companies are currently engaged in smart dust market?
- Which are the leading companies in this market?
- What factors are likely to influence the evolution of this market?
- What is the current and future market size?
- What is the CAGR of this market?
- How is the current and future market opportunity likely to be distributed across key market segments?
Reasons to Buy this Report
- The report provides a comprehensive market analysis, offering detailed revenue projections of the overall market and its specific sub-segments. This information is valuable to both established market leaders and emerging entrants.
- Stakeholders can leverage the report to gain a deeper understanding of the competitive dynamics within the market. By analyzing the competitive landscape, businesses can make informed decisions to optimize their market positioning and develop effective go-to-market strategies.
- The report offers stakeholders a comprehensive overview of the market, including key drivers, barriers, opportunities, and challenges. This information empowers stakeholders to stay abreast of market trends and make data-driven decisions to capitalize on growth prospects.
Additional Benefits
- Complimentary Excel Data Packs for all Analytical Modules in the Report
- 15% Free Content Customization
- Detailed Report Walkthrough Session with Research Team
- Free Updated report if the report is 6-12 months old or older
TABLE OF CONTENTS
SECTION I: REPORT OVERVIEW
1. PREFACE
- 1.1. Introduction
- 1.2. Market Share Insights
- 1.3. Key Market Insights
- 1.4. Report Coverage
- 1.5. Key Questions Answered
- 1.6. Chapter Outlines
2. RESEARCH METHODOLOGY
- 2.1. Chapter Overview
- 2.2. Research Assumptions
- 2.3. Database Building
- 2.3.1. Data Collection
- 2.3.2. Data Validation
- 2.3.3. Data Analysis
- 2.4. Project Methodology
- 2.4.1. Secondary Research
- 2.4.1.1. Annual Reports
- 2.4.1.2. Academic Research Papers
- 2.4.1.3. Company Websites
- 2.4.1.4. Investor Presentations
- 2.4.1.5. Regulatory Filings
- 2.4.1.6. White Papers
- 2.4.1.7. Industry Publications
- 2.4.1.8. Conferences and Seminars
- 2.4.1.9. Government Portals
- 2.4.1.10. Media and Press Releases
- 2.4.1.11. Newsletters
- 2.4.1.12. Industry Databases
- 2.4.1.13. Roots Proprietary Databases
- 2.4.1.14. Paid Databases and Sources
- 2.4.1.15. Social Media Portals
- 2.4.1.16. Other Secondary Sources
- 2.4.2. Primary Research
- 2.4.2.1. Introduction
- 2.4.2.2. Types
- 2.4.2.2.1. Qualitative
- 2.4.2.2.2. Quantitative
- 2.4.2.3. Advantages
- 2.4.2.4. Techniques
- 2.4.2.4.1. Interviews
- 2.4.2.4.2. Surveys
- 2.4.2.4.3. Focus Groups
- 2.4.2.4.4. Observational Research
- 2.4.2.4.5. Social Media Interactions
- 2.4.2.5. Stakeholders
- 2.4.2.5.1. Company Executives (CXOs)
- 2.4.2.5.2. Board of Directors
- 2.4.2.5.3. Company Presidents and Vice Presidents
- 2.4.2.5.4. Key Opinion Leaders
- 2.4.2.5.5. Research and Development Heads
- 2.4.2.5.6. Technical Experts
- 2.4.2.5.7. Subject Matter Experts
- 2.4.2.5.8. Scientists
- 2.4.2.5.9. Doctors and Other Healthcare Providers
- 2.4.2.6. Ethics and Integrity
- 2.4.2.6.1. Research Ethics
- 2.4.2.6.2. Data Integrity
- 2.4.3. Analytical Tools and Databases
- 2.4.1. Secondary Research
3. MARKET DYNAMICS
- 3.1. Forecast Methodology
- 3.1.1. Top-Down Approach
- 3.1.2. Bottom-Up Approach
- 3.1.3. Hybrid Approach
- 3.2. Market Assessment Framework
- 3.2.1. Total Addressable Market (TAM)
- 3.2.2. Serviceable Addressable Market (SAM)
- 3.2.3. Serviceable Obtainable Market (SOM)
- 3.2.4. Currently Acquired Market (CAM)
- 3.3. Forecasting Tools and Techniques
- 3.3.1. Qualitative Forecasting
- 3.3.2. Correlation
- 3.3.3. Regression
- 3.3.4. Time Series Analysis
- 3.3.5. Extrapolation
- 3.3.6. Convergence
- 3.3.7. Forecast Error Analysis
- 3.3.8. Data Visualization
- 3.3.9. Scenario Planning
- 3.3.10. Sensitivity Analysis
- 3.4. Key Considerations
- 3.4.1. Demographics
- 3.4.2. Market Access
- 3.4.3. Reimbursement Scenarios
- 3.4.4. Industry Consolidation
- 3.5. Robust Quality Control
- 3.6. Key Market Segmentations
- 3.7. Limitations
4. MACRO-ECONOMIC INDICATORS
- 4.1. Chapter Overview
- 4.2. Market Dynamics
- 4.2.1. Time Period
- 4.2.1.1. Historical Trends
- 4.2.1.2. Current and Forecasted Estimates
- 4.2.2. Currency Coverage
- 4.2.2.1. Overview of Major Currencies Affecting the Market
- 4.2.2.2. Impact of Currency Fluctuations on the Industry
- 4.2.3. Foreign Exchange Impact
- 4.2.3.1. Evaluation of Foreign Exchange Rates and Their Impact on Market
- 4.2.3.2. Strategies for Mitigating Foreign Exchange Risk
- 4.2.4. Recession
- 4.2.4.1. Historical Analysis of Past Recessions and Lessons Learnt
- 4.2.4.2. Assessment of Current Economic Conditions and Potential Impact on the Market
- 4.2.5. Inflation
- 4.2.5.1. Measurement and Analysis of Inflationary Pressures in the Economy
- 4.2.5.2. Potential Impact of Inflation on the Market Evolution
- 4.2.6. Interest Rates
- 4.2.6.1. Overview of Interest Rates and Their Impact on the Market
- 4.2.6.2. Strategies for Managing Interest Rate Risk
- 4.2.7. Commodity Flow Analysis
- 4.2.7.1. Type of Commodity
- 4.2.7.2. Origins and Destinations
- 4.2.7.3. Values and Weights
- 4.2.7.4. Modes of Transportation
- 4.2.8. Global Trade Dynamics
- 4.2.8.1. Import Scenario
- 4.2.8.2. Export Scenario
- 4.2.9. War Impact Analysis
- 4.2.9.1. Russian-Ukraine War
- 4.2.9.2. Israel-Hamas War
- 4.2.10. COVID Impact / Related Factors
- 4.2.10.1. Global Economic Impact
- 4.2.10.2. Industry-specific Impact
- 4.2.10.3. Government Response and Stimulus Measures
- 4.2.10.4. Future Outlook and Adaptation Strategies
- 4.2.11. Other Indicators
- 4.2.11.1. Fiscal Policy
- 4.2.11.2. Consumer Spending
- 4.2.11.3. Gross Domestic Product (GDP)
- 4.2.11.4. Employment
- 4.2.11.5. Taxes
- 4.2.11.6. R&D Innovation
- 4.2.11.7. Stock Market Performance
- 4.2.11.8. Supply Chain
- 4.2.11.9. Cross-Border Dynamics
- 4.2.1. Time Period
SECTION II: QUALITATIVE INSIGHTS
5. EXECUTIVE SUMMARY
6. INTRODUCTION
- 6.1. Chapter Overview
- 6.2. Overview of Smart Dust Market
- 6.2.1. Type of Dust
- 6.2.2. Type of Component
- 6.2.3. Type of Manufacturing Process
- 6.2.4. Type of End User
- 6.3. Future Perspective
7. REGULATORY SCENARIO
SECTION III: MARKET OVERVIEW
8. COMPREHENSIVE DATABASE OF LEADING PLAYERS
9. COMPETITIVE LANDSCAPE
- 9.1. Chapter Overview
- 9.2. Smart Dust: Overall Market Landscape
- 9.2.1. Analysis by Year of Establishment
- 9.2.2. Analysis by Company Size
- 9.2.3. Analysis by Location of Headquarters
- 9.2.4. Analysis by Ownership Structure
10. WHITE SPACE ANALYSIS
11. COMPANY COMPETITIVENESS ANALYSIS
12. STARTUP ECOSYSTEM IN THE SMART DUST MARKET
- 12.1. Smart Dust Market: Market Landscape of Startups
- 12.1.1. Analysis by Year of Establishment
- 12.1.2. Analysis by Company Size
- 12.1.3. Analysis by Company Size and Year of Establishment
- 12.1.4. Analysis by Location of Headquarters
- 12.1.5. Analysis by Company Size and Location of Headquarters
- 12.1.6. Analysis by Ownership Structure
- 12.2. Key Findings
SECTION IV: COMPANY PROFILES
13. COMPANY PROFILES
- 13.1. Chapter Overview
- 13.2. Analog Devices*
- 13.2.1. Company Overview
- 13.2.2. Company Mission
- 13.2.3. Company Footprint
- 13.2.4. Management Team
- 13.2.5. Contact Details
- 13.2.6. Financial Performance
- 13.2.7. Operating Business Segments
- 13.2.8. Service / Product Portfolio (project specific)
- 13.2.9. MOAT Analysis
- 13.2.10. Recent Developments and Future Outlook
- 13.3. BetaBatt
- 13.4. Bosch Sensortec
- 13.5. Defendec
- 13.6. Hitachi
- 13.7. Honeywell
- 13.8. IBM
- 13.9. Infineon Technologies
- 13.10. Maxim Integrated
- 13.11. Memsic
- 13.12. Panasonic
- 13.13. Sony
- 13.14. Texas Instruments
- 13.15. Valarm
SECTION V: MARKET TRENDS
14. MEGA TRENDS ANALYSIS
15. UNMET NEED ANALYSIS
16. PATENT ANALYSIS
17. RECENT DEVELOPMENTS
- 17.1. Chapter Overview
- 17.2. Recent Funding
- 17.3. Recent Partnerships
- 17.4. Other Recent Initiatives
SECTION VI: MARKET OPPORTUNITY ANALYSIS
18. GLOBAL SMART DUST MARKET
- 18.1. Chapter Overview
- 18.2. Key Assumptions and Methodology
- 18.3. Trends Disruption Impacting Market
- 18.4. Demand Side Trends
- 18.5. Supply Side Trends
- 18.6. Global Smart Dust Market, Historical Trends (Since 2020) and Forecasted Estimates (Till 2035)
- 18.7. Multivariate Scenario Analysis
- 18.7.1. Conservative Scenario
- 18.7.2. Optimistic Scenario
- 18.8. Investment Feasibility Index
- 18.9. Key Market Segmentations
19. MARKET OPPORTUNITIES BASED ON TYPE OF DUST
- 19.1. Chapter Overview
- 19.2. Key Assumptions and Methodology
- 19.3. Revenue Shift Analysis
- 19.4. Market Movement Analysis
- 19.5. Penetration-Growth (P-G) Matrix
- 19.6. Smart Dust Market for Biodegradable: Historical Trends (Since 2020) and Forecasted Estimates (Till 2035)
- 19.7. Smart Dust Market for Non-Biodegradable: Historical Trends (Since 2020) and Forecasted Estimates (Till 2035)
- 19.8. Data Triangulation and Validation
- 19.8.1. Secondary Sources
- 19.8.2. Primary Sources
- 19.8.3. Statistical Modeling
20. MARKET OPPORTUNITIES BASED ON TYPE OF COMPONENT
- 20.1. Chapter Overview
- 20.2. Key Assumptions and Methodology
- 20.3. Revenue Shift Analysis
- 20.4. Market Movement Analysis
- 20.5. Penetration-Growth (P-G) Matrix
- 20.6. Smart Dust Market for Active Optical Transmission: Historical Trends (Since 2020) and Forecasted Estimates (Till 2035)
- 20.7. Smart Dust Market for Control Circuitry: Historical Trends (Since 2020) and Forecasted Estimates (Till 2035)
- 20.8. Smart Dust Market for Passive Optical Transmission: Historical Trends (Since 2020) and Forecasted Estimates (Till 2035)
- 20.9. Smart Dust Market for Sensors: Historical Trends (Since 2020) and Forecasted Estimates (Till 2035)
- 20.10. Smart Dust Market for Signal Processing: Historical Trends (Since 2020) and Forecasted Estimates (Till 2035)
- 20.11. Smart Dust Market for Others: Historical Trends (Since 2020) and Forecasted Estimates (Till 2035)
- 20.12. Data Triangulation and Validation
- 20.12.1. Secondary Sources
- 20.12.2. Primary Sources
- 20.12.3. Statistical Modeling
21. MARKET OPPORTUNITIES BASED ON MANUFACTURING PROCESS
- 21.1. Chapter Overview
- 21.2. Key Assumptions and Methodology
- 21.3. Revenue Shift Analysis
- 21.4. Market Movement Analysis
- 21.5. Penetration-Growth (P-G) Matrix
- 21.6. Smart Dust Market for 3D Printing: Historical Trends (Since 2020) and Forecasted Estimates (Till 2035)
- 21.7. Smart Dust Market for Microfabrication: Historical Trends (Since 2020) and Forecasted Estimates (Till 2035)
- 21.8. Data Triangulation and Validation
- 21.8.1. Secondary Sources
- 21.8.2. Primary Sources
- 21.8.3. Statistical Modeling
22. MARKET OPPORTUNITIES BASED ON END USER
- 22.1. Chapter Overview
- 22.2. Key Assumptions and Methodology
- 22.3. Revenue Shift Analysis
- 22.4. Market Movement Analysis
- 22.5. Penetration-Growth (P-G) Matrix
- 22.6. Smart Dust Market for Aerospace and Defense: Historical Trends (Since 2020) and Forecasted Estimates (Till 2035)
- 22.7. Smart Dust Market for BFSI: Historical Trends (Since 2020) and Forecasted Estimates (Till 2035)
- 22.8. Smart Dust Market for Consumer Goods & Retail: Historical Trends (Since 2020) and Forecasted Estimates (Till 2035)
- 22.9. Smart Dust Market for Healthcare: Historical Trends (Since 2020) and Forecasted Estimates (Till 2035)
- 22.10. Smart Dust Market for Manufacturing: Historical Trends (Since 2020) and Forecasted Estimates (Till 2035)
- 22.11. Smart Dust Market for Media & Entertainment: Historical Trends (Since 2020) and Forecasted Estimates (Till 2035)
- 22.12. Smart Dust Market for Others: Historical Trends (Since 2020) and Forecasted Estimates (Till 2035)
- 22.13. Data Triangulation and Validation
- 22.13.1. Secondary Sources
- 22.13.2. Primary Sources
- 22.13.3. Statistical Modeling
23. MARKET OPPORTUNITIES FOR SMART DUST IN NORTH AMERICA
- 23.1. Chapter Overview
- 23.2. Key Assumptions and Methodology
- 23.3. Revenue Shift Analysis
- 23.4. Market Movement Analysis
- 23.5. Penetration-Growth (P-G) Matrix
- 23.6. Smart Dust Market in North America: Historical Trends (Since 2020) and Forecasted Estimates (Till 2035)
- 23.6.1. Smart Dust Market in the US: Historical Trends (Since 2020) and Forecasted Estimates (Till 2035)
- 23.6.2. Smart Dust Market in Canada: Historical Trends (Since 2020) and Forecasted Estimates (Till 2035)
- 23.6.3. Smart Dust Market in Mexico: Historical Trends (Since 2020) and Forecasted Estimates (Till 2035)
- 23.6.4. Smart Dust Market in Other North American Countries: Historical Trends (Since 2020) and Forecasted Estimates (Till 2035)
- 23.7. Data Triangulation and Validation
24. MARKET OPPORTUNITIES FOR SMART DUST IN EUROPE
- 24.1. Chapter Overview
- 24.2. Key Assumptions and Methodology
- 24.3. Revenue Shift Analysis
- 24.4. Market Movement Analysis
- 24.5. Penetration-Growth (P-G) Matrix
- 24.6. Smart Dust Market in Europe: Historical Trends (Since 2020) and Forecasted Estimates (Till 2035)
- 24.6.1. Smart Dust Market in Austria: Historical Trends (Since 2020) and Forecasted Estimates (Till 2035)
- 24.6.2. Smart Dust Market in Belgium: Historical Trends (Since 2020) and Forecasted Estimates (Till 2035)
- 24.6.3. Smart Dust Market in Denmark: Historical Trends (Since 2020) and Forecasted Estimates (Till 2035)
- 24.6.4. Smart Dust Market in France: Historical Trends (Since 2020) and Forecasted Estimates (Till 2035)
- 24.6.5. Smart Dust Market in Germany: Historical Trends (Since 2020) and Forecasted Estimates (Till 2035)
- 24.6.6. Smart Dust Market in Ireland: Historical Trends (Since 2020) and Forecasted Estimates (Till 2035)
- 24.6.7. Smart Dust Market in Italy: Historical Trends (Since 2020) and Forecasted Estimates (Till 2035)
- 24.6.8. Smart Dust Market in Netherlands: Historical Trends (Since 2020) and Forecasted Estimates (Till 2035)
- 24.6.9. Smart Dust Market in Norway: Historical Trends (Since 2020) and Forecasted Estimates (Till 2035)
- 24.6.10. Smart Dust Market in Russia: Historical Trends (Since 2020) and Forecasted Estimates (Till 2035)
- 24.6.11. Smart Dust Market in Spain: Historical Trends (Since 2020) and Forecasted Estimates (Till 2035)
- 24.6.12. Smart Dust Market in Sweden: Historical Trends (Since 2020) and Forecasted Estimates (Till 2035)
- 24.6.13. Smart Dust Market in Switzerland: Historical Trends (Since 2020) and Forecasted Estimates (Till 2035)
- 24.6.14. Smart Dust Market in the UK: Historical Trends (Since 2020) and Forecasted Estimates (Till 2035)
- 24.6.15. Smart Dust Market in Other European Countries: Historical Trends (Since 2020) and Forecasted Estimates (Till 2035)
- 24.7. Data Triangulation and Validation
25. MARKET OPPORTUNITIES FOR SMART DUST IN ASIA
- 25.1. Chapter Overview
- 25.2. Key Assumptions and Methodology
- 25.3. Revenue Shift Analysis
- 25.4. Market Movement Analysis
- 25.5. Penetration-Growth (P-G) Matrix
- 25.6. Smart Dust Market in Asia: Historical Trends (Since 2020) and Forecasted Estimates (Till 2035)
- 25.6.1. Smart Dust Market in China: Historical Trends (Since 2020) and Forecasted Estimates (Till 2035)
- 25.6.2. Smart Dust Market in India: Historical Trends (Since 2020) and Forecasted Estimates (Till 2035)
- 25.6.3. Smart Dust Market in Japan: Historical Trends (Since 2020) and Forecasted Estimates (Till 2035)
- 25.6.4. Smart Dust Market in Singapore: Historical Trends (Since 2020) and Forecasted Estimates (Till 2035)
- 25.6.5. Smart Dust Market in South Korea: Historical Trends (Since 2020) and Forecasted Estimates (Till 2035)
- 25.6.6. Smart Dust Market in Other Asian Countries: Historical Trends (Since 2020) and Forecasted Estimates (Till 2035)
- 25.7. Data Triangulation and Validation
26. MARKET OPPORTUNITIES FOR SMART DUST IN MIDDLE EAST AND NORTH AFRICA (MENA)
- 26.1. Chapter Overview
- 26.2. Key Assumptions and Methodology
- 26.3. Revenue Shift Analysis
- 26.4. Market Movement Analysis
- 26.5. Penetration-Growth (P-G) Matrix
- 26.6. Smart Dust Market in Middle East and North Africa (MENA): Historical Trends (Since 2020) and Forecasted Estimates (Till 2035)
- 26.6.1. Smart Dust Market in Egypt: Historical Trends (Since 2020) and Forecasted Estimates (Till 205)
- 26.6.2. Smart Dust Market in Iran: Historical Trends (Since 2020) and Forecasted Estimates (Till 2035)
- 26.6.3. Smart Dust Market in Iraq: Historical Trends (Since 2020) and Forecasted Estimates (Till 2035)
- 26.6.4. Smart Dust Market in Israel: Historical Trends (Since 2020) and Forecasted Estimates (Till 2035)
- 26.6.5. Smart Dust Market in Kuwait: Historical Trends (Since 2020) and Forecasted Estimates (Till 2035)
- 26.6.6. Smart Dust Market in Saudi Arabia: Historical Trends (Since 2020) and Forecasted Estimates (Till 2035)
- 26.6.7. Smart Dust Market in United Arab Emirates (UAE): Historical Trends (Since 2020) and Forecasted Estimates (Till 2035)
- 26.6.8. Smart Dust Market in Other MENA Countries: Historical Trends (Since 2020) and Forecasted Estimates (Till 2035)
- 26.7. Data Triangulation and Validation
27. MARKET OPPORTUNITIES FOR SMART DUST IN LATIN AMERICA
- 27.1. Chapter Overview
- 27.2. Key Assumptions and Methodology
- 27.3. Revenue Shift Analysis
- 27.4. Market Movement Analysis
- 27.5. Penetration-Growth (P-G) Matrix
- 27.6. Smart Dust Market in Latin America: Historical Trends (Since 2020) and Forecasted Estimates (Till 2035)
- 27.6.1. Smart Dust Market in Argentina: Historical Trends (Since 2020) and Forecasted Estimates (Till 2035)
- 27.6.2. Smart Dust Market in Brazil: Historical Trends (Since 2020) and Forecasted Estimates (Till 2035)
- 27.6.3. Smart Dust Market in Chile: Historical Trends (Since 2020) and Forecasted Estimates (Till 2035)
- 27.6.4. Smart Dust Market in Colombia Historical Trends (Since 2020) and Forecasted Estimates (Till 2035)
- 27.6.5. Smart Dust Market in Venezuela: Historical Trends (Since 2020) and Forecasted Estimates (Till 2035)
- 27.6.6. Smart Dust Market in Other Latin American Countries: Historical Trends (Since 2020) and Forecasted Estimates (Till 2035)
- 27.7. Data Triangulation and Validation
28. MARKET OPPORTUNITIES FOR SMART DUST IN REST OF THE WORLD
- 28.1. Chapter Overview
- 28.2. Key Assumptions and Methodology
- 28.3. Revenue Shift Analysis
- 28.4. Market Movement Analysis
- 28.5. Penetration-Growth (P-G) Matrix
- 28.6. Smart Dust Market in Rest of the World: Historical Trends (Since 2020) and Forecasted Estimates (Till 2035)
- 28.6.1. Smart Dust Market in Australia: Historical Trends (Since 2020) and Forecasted Estimates (Till 2035)
- 28.6.2. Smart Dust Market in New Zealand: Historical Trends (Since 2020) and Forecasted Estimates (Till 2035)
- 28.6.3. Smart Dust Market in Other Countries
- 28.7. Data Triangulation and Validation
29. MARKET CONCENTRATION ANALYSIS: DISTRIBUTION BY LEADING PLAYERS
30. ADJACENT MARKET ANALYSIS
SECTION VII: STRATEGIC TOOLS
31. KEY WINNING STRATEGIES
32. PORTER'S FIVE FORCES ANALYSIS
33. SWOT ANALYSIS
34. VALUE CHAIN ANALYSIS
35. ROOTS STRATEGIC RECOMMENDATIONS
- 35.1. Chapter Overview
- 35.2. Key Business-related Strategies
- 35.2.1. Research & Development
- 35.2.2. Product Manufacturing
- 35.2.3. Commercialization / Go-to-Market
- 35.2.4. Sales and Marketing
- 35.3. Key Operations-related Strategies
- 35.3.1. Risk Management
- 35.3.2. Workforce
- 35.3.3. Finance
- 35.3.4. Others
SECTION VIII: OTHER EXCLUSIVE INSIGHTS
36. INSIGHTS FROM PRIMARY RESEARCH
37. REPORT CONCLUSION
SECTION IX: APPENDIX
38. TABULATED DATA
39. LIST OF COMPANIES AND ORGANIZATIONS
40. CUSTOMIZATION OPPORTUNITIES
41. ROOTS SUBSCRIPTION SERVICES
42. AUTHOR DETAILS

