
PUBLISHER: Roots Analysis | PRODUCT CODE: 1993591

PUBLISHER: Roots Analysis | PRODUCT CODE: 1993591
US Renewable Energy Market, till 2035: Distribution by Type of Renewable Energy, Solar Power, Hydroelectric Power, Bioenergy and Geothermal Power, Independent System Operator, Application Area, Investment, and US States: Industry Trends and Forecasts
US Renewable Energy Market Outlook
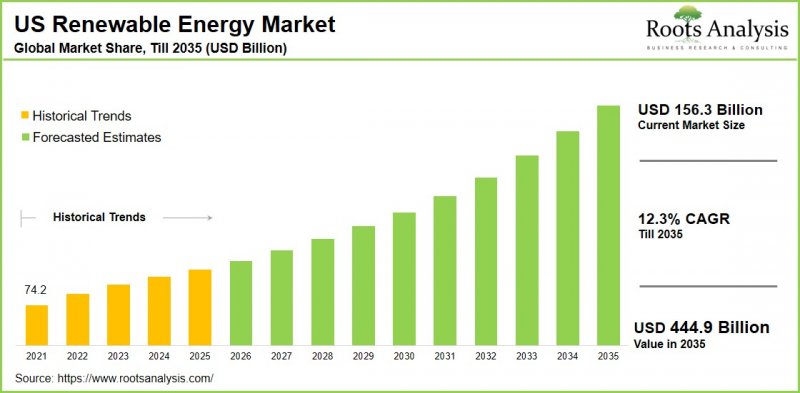
As per Roots Analysis, the global US renewable energy market size is estimated to grow from USD 156.3 billion in current year to USD 444.9 billion by 2035, at a CAGR of 12.3% during the forecast period, till 2035.
According to reports by the World Economic Forum and International Renewable Energy Agency, global renewable energy capacity expanded by an impressive 15.1%, reaching approximately 4,448 GW of installed capacity. This sustained global acceleration has created a strong foundation for the United States renewable energy market, which is currently undergoing a strategic phase of recalibration while maintaining resilient growth momentum.
Growth in the US renewable energy market is being significantly propelled by robust solar investment activity, substantially exceeding prior projections. In parallel, offshore wind development continues to gain traction, reflecting long-term structural strength despite regulatory complexities. Technological convergence is further reshaping market dynamics, shifting the focus from sheer generation capacity to enhanced grid intelligence, operational efficiency, and cost optimization. As these innovations mature, the US renewable energy market is projected to witness sustained expansion throughout the forecast period.
Strategic Insights for Senior Leaders
Key Drivers Propelling Growth of US Renewable Energy Market
The growth of the US renewable energy market is primarily driven by the rising corporate demand for clean, reliable power, as large industrial and commercial enterprises are facing pressure from evolving ESG disclosure requirements to decarbonize operations. This shift is accelerating the adoption of corporate renewable Power Purchase Agreements (PPAs), green tariff programs, and behind-the-meter energy solutions. Simultaneously, the continued decline in the levelized cost of energy (LCOE) is strengthening the economic case for renewables, with 91% of new renewable energy projects are proving more cost-competitive than fossil fuel alternatives.
Complementing these trends, governments worldwide are intensifying policy support for low-emission power generation through financial incentives, regulatory frameworks, and sustainability-driven initiatives, thereby accelerating renewable deployment across commercial, industrial, and utility-scale applications.
US Renewable Energy Market: Competitive Landscape of Companies in this Industry
The competitive landscape of the global US renewable energy market comprises a mix of well-established industry participants and emerging innovators. The market remains largely concentrated among major industry players, including AES Corporation, Chevron Corporation, Constellation Energy, and Duke Energy, which continue to leverage diversified portfolios, and capital strength to maintain leadership positions. At the same time, nearly 35% of renewable energy startups are headquartered in Texas and California, underscoring the presence of mature innovation ecosystems and strong state-level policy frameworks that support resilient and clean energy technologies.
US-based renewable energy startups have secured substantial funding across diverse financing models to advance clean energy generation through geothermal, solar, and wind sources. Notably, approximately 90% of total investments have originated from private sector participants, reflecting robust investor confidence in the commercial scalability and long-term viability of renewable technologies.
Regulatory Framework Governing the US Renewable Energy Market
Regulatory frameworks governing renewable energy development across the United States vary significantly by state yet collectively align toward the shared objective of strengthening energy resilience. These frameworks also aim to accelerate the transition to sustainable power sources such as solar, wind, and advanced battery storage systems.
Many states have adopted Renewable Portfolio Standards (RPS) or Clean Energy Standards (CES), requiring utilities to procure progressively larger shares, typically ranging from 15% to 50% of electricity from renewable sources. These mandates, reinforced by state-level incentives, have played a pivotal role in stimulating renewable energy deployment and capital investment.
However, the fragmented nature of state-level regulatory regimes can also create structural challenges that hinder project execution and discourage investment. Variations in permitting processes and interconnection standards often create inconsistencies with local jurisdictions
Recent federal policy shifts, including the One Big Beautiful Bill Act (OBBBA) of 2025, have further influenced the investment climate by tightening eligibility timelines for wind and solar tax credits. Additionally, permitting processes governed by statutes such as the National Environmental Policy Act (NEPA) often prolong project timelines due to extensive environmental reviews and interagency coordination complexities.
Key Challenges in the US Renewable Energy Market
The renewable energy sector continues to face operational and structural challenges stemming from supply chain volatility, infrastructure constraints, and project development risks. Global supply chain disruptions and evolving trade policies expose the industry to fluctuations in input costs for critical components such as solar modules, wind turbines, inverters, and battery systems. These dynamics often result in procurement delays and pricing uncertainty, which can adversely affect project timelines and overall financial viability.
At the same time, limitations associated with energy storage technologies, particularly high capital costs and performance constraints, restrict the effective management of intermittency in renewable power generation. Consequently, grid reliability and scalability are affected, especially in off-grid and hybrid configurations where inadequate storage capacity may result in service disruptions.
US renewable energy Market: Key Market Segmentation
Market Share by Type of Renewable Energy
- Wind Power (NAICS Code: 221115)
- Solar Power (NAICS Code: 221114)
- Hydroelectric Power (NAICS Code: 221111)
- Bio Energy (NAICS Code: 221117)
- Geothermal (NAICS Code: 221116)
Market Share by Type of Organization
- Independent System Operators
- Regional Transmission Organizations
- Independent System Operators / Regional Transmission Organizations
- Non-Regional Transmission Organizations
Market Share by Type of Independent System Operators
- Midcontinent ISO
- Electric Reliability Council of Texas
- California ISO
- Pennsylvania Jersey Maryland
- Southwest Power Pool
- New York ISO
- New England ISO
Market Share by Application Area
- Residential
- Commercial
- Building Energy Service
- Data Centers and IT Services
- Education and Institutes
- Healthcare Facilities
- Other Applications
- Industrial
- Manufacturing
- Construction
- Mining
- Agriculture
- Other Application Areas
Market Share by Type of Investment
- Private Sector Investments
- Government-funded Investments
- Public-private Investments
Market Share by US States
- Texas
- California
- Iowa
- Oklahoma
- Illinois
- Kansas
- Florida
- Colorado
- New Mexico
- Minnesota
- Arizona
- Nevada
- Indiana
- Georgia
- North Dakota
- North Carolina
- Michigan
- New York
- South Dakota
- Oregon
- Virginia
- Nebraska
- Wyoming
- Ohio
- Washington
- Missouri
- Wisconsin
- Utah
- Pennsylvania
- Montana
- Maine
- Arkansas
- Idaho
- South Carolina
- Alabama
- Mississippi
- Louisiana
- Massachusetts
- New Jersey
- West Virginia
- Maryland
- Hawaii
- Tennessee
- Kentucky
- New Hampshire
- Connecticut
- Rhode Island
- Vermont
- Delaware
- Alaska
Example Players in US Renewable Energy Market
- AES
- Chevron
- Constellation
- Duke Energy
- Duke Energy
- EDF power solutions
- First Solar
- LS Power
- NextEra Energy
- Ormat Technologies
- Pacific Gas and Electric
- Southern California Edison
- Southern Company
- Vistra
- Xcel Energy
US Renewable Energy Market: Report Coverage
The report on the US renewable energy market features insights on various sections, including:
- Market Sizing and Opportunity Analysis: An in-depth analysis of the US renewable energy market, focusing on key market segments, including [A] type of renewable energy, [B] solar power, [C] hydroelectric power, [D] bioenergy and geothermal power, [E] type of organization, [F] type of independent system operator, [G] application area, [H] type of investment, and [I] US states.
- Competitive Landscape: A comprehensive analysis of the companies engaged in the US renewable energy market, based on several relevant parameters, such as [A] year of establishment, [B] company size, [C] location of headquarters and [D] ownership structure.
- Company Profiles: Elaborate profiles of prominent players engaged in the US renewable energy market, providing details on [A] location of headquarters, [B] company size, [C] company mission, [D] company footprint, [E] management team, [F] contact details, [G] financial information, [H] operating business segments, [I] product / technology portfolio, [J] recent developments, and an informed future outlook.
- Patent Analysis: An insightful analysis of patents filed / granted in the US renewable energy domain, based on relevant parameters, including [A] type of patent, [B] patent publication year, [C] patent age and [D] leading players.
- Recent Developments: An overview of the recent developments made in the US renewable energy domain, along with analysis based on relevant parameters, including [A] year of initiative, [B] type of initiative, [C] geographical distribution and [D] most active players.
Key Questions Answered in this Report
- What is the current and future market size?
- Who are the leading companies in this market?
- What are the growth drivers that are likely to influence the evolution of this market?
- What are the key partnership and funding trends shaping this industry?
- Which region is likely to grow at higher CAGR till 2035?
- How is the current and future market opportunity likely to be distributed across key market segments?
Reasons to Buy this Report
- Detailed Market Analysis: The report provides a comprehensive market analysis, offering detailed revenue projections of the overall market and its specific sub-segments. This information is valuable to both established market leaders and emerging entrants.
- In-depth Analysis of Trends: Stakeholders can leverage the report to gain a deeper understanding of the competitive dynamics within the market. Each report maps ecosystem activity across partnerships, funding, and patent landscapes to reveal growth hotspots and white spaces in the industry.
- Opinion of Industry Experts: The report features extensive interviews and surveys with key opinion leaders and industry experts to validate market trends mentioned in the report.
- Decision-ready Deliverables: The report offers stakeholders with strategic frameworks (Porter's Five Forces, value chain, SWOT), and complimentary Excel / slide packs with customization support.
Additional Benefits
- Complimentary Dynamic Excel Dashboards for Analytical Modules
- Exclusive 15% Free Content Customization
- Personalized Interactive Report Walkthrough with Our Expert Research Team
- Free Report Updates for Versions Older than 6-12 Months
TABLE OF CONTENTS
1. PROJECT OVERVIEW
- 1.1. Context
- 1.2. Project Objectives
2. RESEARCH METHODOLOGY
- 2.1. Chapter Overview
- 2.2. Research Assumptions
- 2.2.1. Market Landscape and Market Trends
- 2.2.2. Market Forecast and Opportunity Analysis
- 2.2.3. Comparative Analysis
- 2.3. Database Building
- 2.3.1. Data Collection
- 2.3.2. Data Validation
- 2.3.3. Data Analysis
- 2.4. Project Methodology
- 2.4.1. Secondary Research
- 2.4.1.1. Annual Reports
- 2.4.1.2. Academic Research Papers
- 2.4.1.3. Company Websites
- 2.4.1.4. Investor Presentations
- 2.4.1.5. Regulatory Filings
- 2.4.1.6. White Papers
- 2.4.1.7. Industry Publications
- 2.4.1.8. Conferences and Seminars
- 2.4.1.9. Government Portals
- 2.4.1.10. Media and Press Releases
- 2.4.1.11. Newsletters
- 2.4.1.12. Industry Databases
- 2.4.1.13. Roots Proprietary Databases
- 2.4.1.14. Paid Databases and Sources
- 2.4.1.15. Social Media Portals
- 2.4.1.16. Other Secondary Sources
- 2.4.2. Primary Research
- 2.4.2.1. Types of Primary Research
- 2.4.2.1.1. Qualitative Research
- 2.4.2.1.2. Quantitative Research
- 2.4.2.1.3. Hybrid Approach
- 2.4.2.2. Advantages of Primary Research
- 2.4.2.3. Techniques for Primary Research
- 2.4.2.3.1. Interviews
- 2.4.2.3.2. Surveys
- 2.4.2.3.3. Focus Groups
- 2.4.2.3.4. Observational Research
- 2.4.2.3.5. Social Media Interactions
- 2.4.2.4. Key Opinion Leaders Considered in Primary Research
- 2.4.2.4.1. Company Executives (CXOs)
- 2.4.2.4.2. Board of Directors
- 2.4.2.4.3. Company Presidents and Vice Presidents
- 2.4.2.4.4. Research and Development Heads
- 2.4.2.4.5. Technical Experts
- 2.4.2.4.6. Subject Matter Experts
- 2.4.2.4.7. Scientists
- 2.4.2.4.8. Doctors and Other Healthcare Providers
- 2.4.2.5. Ethics and Integrity
- 2.4.2.5.1. Research Ethics
- 2.4.2.5.2. Data Integrity
- 2.4.2.1. Types of Primary Research
- 2.4.3. Analytical Tools and Databases
- 2.4.1. Secondary Research
- 2.5. Robust Quality Control
3. MARKET DYNAMICS
- 3.1. Chapter Overview
- 3.2. Forecast Methodology
- 3.2.1. Top-down Approach
- 3.2.2. Bottom-up Approach
- 3.2.3. Hybrid Approach
- 3.3. Market Assessment Framework
- 3.3.1. Total Addressable Market (TAM)
- 3.3.2. Serviceable Addressable Market (SAM)
- 3.3.3. Serviceable Obtainable Market (SOM)
- 3.3.4. Currently Acquired Market (CAM)
- 3.4. Forecasting Tools and Techniques
- 3.4.1. Qualitative Forecasting
- 3.4.2. Correlation
- 3.4.3. Regression
- 3.4.4. Extrapolation
- 3.4.5. Convergence
- 3.4.6. Sensitivity Analysis
- 3.4.7. Scenario Planning
- 3.4.8. Data Visualization
- 3.4.9. Time Series Analysis
- 3.4.10. Forecast Error Analysis
- 3.5. Key Considerations
- 3.5.1. Demographics
- 3.5.2. Government Regulations
- 3.5.3. Reimbursement Scenarios
- 3.5.4. Market Access
- 3.5.5. Supply Chain
- 3.5.6. Industry Consolidation
- 3.5.7. Pandemic / Unforeseen Disruptions Impact
- 3.6. Limitations
4. MACRO-ECONOMIC INDICATORS
- 4.1. Chapter Overview
- 4.2. Market Dynamics
- 4.2.1. Time Period
- 4.2.1.1. Historical Trends
- 4.2.1.2. Current and Forecasted Estimates
- 4.2.2. Currency Coverage
- 4.2.2.1. Major Currencies Affecting the Market
- 4.2.2.2. Factors Affecting Currency Fluctuations
- 4.2.2.3. Impact of Currency Fluctuations on the Industry
- 4.2.3. Foreign Currency Exchange Rate
- 4.2.3.1. Impact of Foreign Exchange Rate Volatility on the Market
- 4.2.3.2. Strategies for Mitigating Foreign Exchange Risk
- 4.2.4. Recession
- 4.2.4.1. Assessment of Current Economic Conditions and Potential Impact on the Market
- 4.2.4.2. Historical Analysis of Past Recessions and Lessons Learnt
- 4.2.5. Inflation
- 4.2.5.1. Measurement and Analysis of Inflationary Pressures in the Economy
- 4.2.5.2. Potential Impact of Inflation on the Market Evolution
- 4.2.6. Interest Rates
- 4.2.6.1. Interest Rates and Their Impact on the Market
- 4.2.6.2. Strategies for Managing Interest Rate Risk
- 4.2.7. Commodity Flow Analysis
- 4.2.7.1. Type of Commodity
- 4.2.7.2. Origins and Destinations
- 4.2.7.3. Values and Weights
- 4.2.7.4. Modes of Transportation
- 4.2.8. Global Trade Dynamics
- 4.2.8.1. Import Scenario
- 4.2.8.2. Export Scenario
- 4.2.8.3. Trade Policies
- 4.2.8.4. Strategies for Mitigating the Risks Associated with Trade Barriers
- 4.2.8.5. Impact of Trade Barriers on the Market
- 4.2.9. War Impact Analysis
- 4.2.9.1. Russian-Ukraine War
- 4.2.9.2. Israel-Hamas War
- 4.2.10. COVID Impact / Related Factors
- 4.2.10.1. Global Economic Impact
- 4.2.10.2. Industry-specific Impact
- 4.2.10.3. Government Response and Stimulus Measures
- 4.2.10.4. Future Outlook and Adaptation Strategies
- 4.2.11. Other Indicators
- 4.2.11.1. Fiscal Policy
- 4.2.11.2. Consumer Spending
- 4.2.11.3. Gross Domestic Product (GDP)
- 4.2.11.4. Employment
- 4.2.11.5. Taxes
- 4.2.11.6. Stock Market Performance
- 4.2.11.7. Cross-Border Dynamics
- 4.2.1. Time Period
- 4.3. Conclusion
5. EXECUTIVE SUMMARY
6. INTRODUCTION
- 6.1. Renewable Energy Overview
- 6.2. Types of Renewable Energy Sources
- 6.3. Need for Renewable Energy
- 6.4. Key Application Areas of Renewable Energy
- 6.5. Key Challenges Associated with Deployment of Renewables
- 6.6. Future Innovations Driving Renewable Energy
7. REGULATORY SCENARIO
8. US RENEWABLE ENERGY MARKET LANDSCAPE OF INCUMBENTS
- 8.1. Methodology and Key Parameters
- 8.2. US Renewable Energy Market: Landscape of Incumbents
- 8.2.1. Analysis by Year of Establishment
- 8.2.2. Analysis by Company Size
- 8.2.3. Analysis by Location of Headquarters (State)
- 8.2.4. Analysis by Type of Offering
- 8.2.5. Analysis by Type of Renewable Energy
- 8.2.6. Analysis by Application Area
- 8.2.7. Analysis by Type of Investment
9. COMPANY COMPETITIVENESS ANALYSIS
- 9.1. Methodology and Key Parameters
- 9.2. Scoring Criteria
- 9.3. Comparison of Top 15 US Renewable Energy Solution Providers Studied
- 9.4. Overview of Top US Renewable Energy Solution Providers
10. US RENEWABLE ENERGY MARKET: STARTUP ECOSYSTEM ANALYSIS
- 10.1. Methodology and Key Parameters
- 10.2. US Renewable Energy Market: Startup Ecosystem Analysis
- 10.2.1. Analysis by Year of Establishment
- 10.2.2. Analysis by Company Size
- 10.2.3. Analysis by Location of Headquarters (State)
- 10.2.4. Analysis by Type of Offering
- 10.2.5. Analysis by Type of Renewable Energy
- 10.2.6. Analysis by Application Area
- 10.2.7. Analysis by Type of Investment
11. COMPANY PROFILES
- 11.1. Chapter Overview
- 11.2. AES*
- 11.2.1. Company Details
- 11.2.2. US Renewable Energy Portfolio
- 11.2.3. Initiatives in the US Renewable Energy Market
- 11.2.4. Roots Analysis View
- 11.3. Chevron
- 11.4. Constellation
- 11.5. Dominion Energy
- 11.6. Duke Energy
- 11.7. Duke Energy
- 11.8. EDF power solutions
- 11.9. First Solar
- 11.10. LS Power
- 11.11. NextEra Energy
- 11.12. Ormat Technologies
- 11.13. Pacific Gas and Electric
- 11.14. Southern California Edison
- 11.15. Southern Company
- 11.16. Vistra
- 11.17. Xcel Energy
- Similar details are presented for other companies mentioned below (based on information in the public domain)
12. KEY WINNING STRATEGIES
13. PORTER'S FIVE FORCES ANALYSIS
14. MEGA TRENDS ANALYSIS
15. PATENT ANALYSIS
- 15.1. Methodology and Key Parameters
- 15.2. US Renewable Energy Market: Patent Analysis
- 15.2.1. Analysis by Application Year
- 15.2.2. Analysis by Type of Patent
- 15.2.3. Analysis by Patent Jurisdiction
- 15.2.4. Analysis by Publication Year
- 15.2.5. Analysis by Type of Patent and Publication Year
- 15.2.6. Analysis by Publication Year and Type of Applicant
- 15.2.7. Leading Players: Analysis by Number of Patents
- 15.2.8. Leading Individual Patent Assignees: Analysis by Number of Patents
- 15.2.9. Analysis by Patent Age
- 15.2.10. Patent Valuation
16. RECENT DEVELOPMENTS
- 16.1. Chapter Overview
- 16.2. US Renewable Energy Market: Partnerships and Collaborations
- 16.2.1. Partnership Models
- 16.2.1.1. Analysis by Month and Year of Partnership
- 16.2.1.2. Analysis by Type of Partnership
- 16.2.1.3. Analysis by Type of Renewable Energy
- 16.2.1.4. Intercontinental and Intracontinental Deals
- 16.2.1. Partnership Models
- 16.3. US Renewable Energy Market: Recent Expansions
- 16.3.1. Expansion Models
- 16.3.1.1. Analysis by Month and Year of Expansion
- 16.3.1.2. Analysis by Type of Expansion
- 16.3.1.3. Analysis by Status of Expansion
- 16.3.1.4. Analysis by Type of Renewable Energy
- 16.3.1. Expansion Models
17. MARKET IMPACT ANALYSIS
- 17.1. Market Drivers
- 17.2. Market Restraints
- 17.3. Market Opportunities
- 17.4. Market Challenges
18. US RENEWABLE ENERGY MARKET
- 18.1. Key Assumptions and Methodology
- 18.2. US Renewable Energy Market: Historical Trends (Since 2021) and Forecasted Estimates (Till 2035)
- 18.2.1. Scenario Analysis
- 18.2.1.1. Conservative Scenario
- 18.2.1.2. Optimistic Scenario
- 18.2.1. Scenario Analysis
- 18.3. Key Market Segmentations
19. MARKET OPPORTUNITIES BASED ON TYPE OF RENEWABLE ENERGY
- 19.1. Key Assumptions and Methodology
- 19.2. US Renewable Energy Market: Distribution by Type of Renewable Energy
- 19.2.1. US Renewable Energy Market for Wind Power: Historical Trends (Since 2021) and Forecasted Estimates (Till 2035)
- 19.2.2. US Renewable Energy Market for Solar Power: Historical Trends (Since 2021) and Forecasted Estimates (Till 2035)
- 19.2.3. US Renewable Energy Market for Hydroelectric Power: Historical Trends (Since 2021) and Forecasted Estimates (Till 2035)
- 19.2.4. US Renewable Energy Market for Bio Energy: Historical Trends (Since 2021) and Forecasted Estimates (Till 2035)
- 19.2.5. US Renewable Energy Market for Geothermal Power: Historical Trends (Since 2021) and Forecasted Estimates (Till 2035)
- 19.3. Data Triangulation and Validation
20. MARKET OPPORTUNITIES BASED ON TYPE OF ORGANIZATION
- 20.1. Key Assumptions and Methodology
- 20.2. US Renewable Energy Market: Distribution by Type of Organization
- 20.2.1. US Renewable Energy Market for Independent System Operators (ISOs): Historical Trends (Since 2021) and Forecasted Estimates (Till 2035)
- 20.2.2. US Renewable Energy Market for Regional Transmission Organizations (RTOs): Historical Trends (Since 2021) and Forecasted Estimates (Till 2035)
- 20.2.3. US Renewable Energy Market for Independent System Operators (ISOs) / Regional Transmission Organizations (RTOs): Historical Trends (Since 2021) and Forecasted Estimates (Till 2035)
- 20.2.4. US Renewable Energy Market for Non-Regional Transmission Organizations (RTOs): Historical Trends (Since 2021) and Forecasted Estimates (Till 2035)
- 20.3. Data Triangulation and Validation
21. MARKET OPPORTUNITIES BASED ON TYPE OF INDEPENDENT SYSTEM OPERATOR
- 21.1. Key Assumptions and Methodology
- 21.2. US Renewable Energy Market: Distribution by Type of Independent System Operator
- 21.2.1. US Renewable Energy Market for Midcontinent ISO (MISO): Historical Trends (Since 2021) and Forecasted Estimates (Till 2035)
- 21.2.2. US Renewable Energy Market for Electric Reliability Council of Texas (ERCOT): Historical Trends (Since 2021) and Forecasted Estimates (Till 2035)
- 21.2.3. US Renewable Energy Market for California ISO (CAISO): Historical Trends (Since 2021) and Forecasted Estimates (Till 2035)
- 21.2.4. US Renewable Energy Market for Pennsylvania Jersey Maryland (PJM): Historical Trends (Since 2021) and Forecasted Estimates (Till 2035)
- 21.2.5. US Renewable Energy Market for Southwest Power Pool (SPP): Historical Trends (Since 2021) and Forecasted Estimates (Till 2035)
- 21.2.6. US Renewable Energy Market for New York ISO (NYISO): Historical Trends (Since 2021) and Forecasted Estimates (Till 2035)
- 21.2.7. US Renewable Energy Market for New England ISO (NEISO): Historical Trends (Since 2021) and Forecasted Estimates (Till 2035)
- 21.3. Data Triangulation and Validation
22. MARKET OPPORTUNITIES BASED ON APPLICATION AREA
- 22.1. Key Assumptions and Methodology
- 22.2. US Renewable Energy Market: Distribution by Application Area
- 22.2.1. US Renewable Energy Market for Residential: Historical Trends (Since 2021) and Forecasted Estimates (Till 2035)
- 22.2.2. US Renewable Energy Market for Commercial: Historical Trends (Since 2021) and Forecasted Estimates (Till 2035)
- 22.2.2.1. Commercial US Renewable Energy Market for Building Energy Service: Historical Trends (Since 2021) and Forecasted Estimates (Till 2035)
- 22.2.2.2. Commercial US Renewable Energy Market for Data Centers and IT Services: Historical Trends (Since 2021) and Forecasted Estimates (Till 2035)
- 22.2.2.3. Commercial US Renewable Energy Market for Healthcare Facilities: Historical Trends (Since 2021) and Forecasted Estimates (Till 2035)
- 22.2.2.4. Commercial US Renewable Energy Market for Other Applications: Historical Trends (Since 2021) and Forecasted Estimates (Till 2035)
- 22.2.3. US Renewable Energy Market for Industrial: Historical Trends (Since 2021) and Forecasted Estimates (Till 2035)
- 22.2.3.1. Industrial US Renewable Energy Market for Manufacturing: Historical Trends (Since 2021) and Forecasted Estimates (Till 2035)
- 22.2.3.2. Industrial US Renewable Energy Market for Construction: Historical Trends (Since 2021) and Forecasted Estimates (Till 2035)
- 22.2.3.3. Industrial US Renewable Energy Market for Mining: Historical Trends (Since 2021) and Forecasted Estimates (Till 2035)
- 22.2.3.4. Industrial US Renewable Energy Market for Agriculture: Historical Trends (Since 2021) and Forecasted Estimates (Till 2035)
- 22.2.4. US Renewable Energy Market for Other Application Areas: Historical Trends (Since 2021) and Forecasted Estimates (Till 2035)
- 22.3. Data Triangulation and Validation
23. MARKET OPPORTUNITIES BASED ON TYPE OF INVESTMENT
- 23.1. Key Assumptions and Methodology
- 23.2. US Renewable Energy Market: Distribution by Type of Investment
- 23.2.1. US Renewable Energy Market for Private Sector Investments: Historical Trends (Since 2021) and Forecasted Estimates (Till 2035)
- 23.2.2. US Renewable Energy Market for Government-funded Investments: Historical Trends (Since 2021) and Forecasted Estimates (Till 2035)
- 23.2.3. US Renewable Energy Market for Public-private Investments: Historical Trends (Since 2021) and Forecasted Estimates (Till 2035)
- 23.3. Data Triangulation and Validation
24. MARKET OPPORTUNITIES BASED ON US STATES
- 24.1. Key Assumptions and Methodology
- 24.2. US Renewable Energy Market: Distribution by US States
- 24.2.1. US Renewable Energy Market in Texas: Historical Trends (Since 2021) and Forecasted Estimates (Till 2035)
- 24.2.2. US Renewable Energy Market in California: Historical Trends (Since 2021) and Forecasted Estimates (Till 2035)
- 24.2.3. US Renewable Energy Market in Iowa: Historical Trends (Since 2021) and Forecasted Estimates (Till 2035)
- 24.2.4. US Renewable Energy Market in Oklahoma: Historical Trends (Since 2021) and Forecasted Estimates (Till 2035)
- 24.2.5. US Renewable Energy Market in Illinois: Historical Trends (Since 2021) and Forecasted Estimates (Till 2035)
- 24.2.6. US Renewable Energy Market in Kansas: Historical Trends (Since 2021) and Forecasted Estimates (Till 2035)
- 24.2.7. US Renewable Energy Market in Florida: Historical Trends (Since 2021) and Forecasted Estimates (Till 2035)
- 24.2.8. US Renewable Energy Market in Colorado: Historical Trends (Since 2021) and Forecasted Estimates (Till 2035)
- 24.2.9. US Renewable Energy Market in New Mexico: Historical Trends (Since 2021) and Forecasted Estimates (Till 2035)
- 24.2.10. US Renewable Energy Market in Minnesota: Historical Trends (Since 2021) and Forecasted Estimates (Till 2035)
- 24.2.11. US Renewable Energy Market in Arizona: Historical Trends (Since 2021) and Forecasted Estimates (Till 2035)
- 24.2.12. US Renewable Energy Market in Nevada: Historical Trends (Since 2021) and Forecasted Estimates (Till 2035)
- 24.2.13. US Renewable Energy Market in Indiana: Historical Trends (Since 2021) and Forecasted Estimates (Till 2035)
- 24.2.14. US Renewable Energy Market in Georgia: Historical Trends (Since 2021) and Forecasted Estimates (Till 2035)
- 24.2.15. US Renewable Energy Market in North Dakota: Historical Trends (Since 2021) and Forecasted Estimates (Till 2035)
- 24.2.16. US Renewable Energy Market in North Carolina: Historical Trends (Since 2021) and Forecasted Estimates (Till 2035)
- 24.2.17. US Renewable Energy Market in Michigan: Historical Trends (Since 2021) and Forecasted Estimates (Till 2035)
- 24.2.18. US Renewable Energy Market in New York: Historical Trends (Since 2021) and Forecasted Estimates (Till 2035)
- 24.2.19. US Renewable Energy Market in South Dakota: Historical Trends (Since 2021) and Forecasted Estimates (Till 2035)
- 24.2.20. US Renewable Energy Market in Oregon: Historical Trends (Since 2021) and Forecasted Estimates (Till 2035)
- 24.2.21. US Renewable Energy Market in Virginia: Historical Trends (Since 2021) and Forecasted Estimates (Till 2035)
- 24.2.22. US Renewable Energy Market in Nebraska: Historical Trends (Since 2021) and Forecasted Estimates (Till 2035)
- 24.2.23. US Renewable Energy Market in Wyoming: Historical Trends (Since 2021) and Forecasted Estimates (Till 2035)
- 24.2.24. US Renewable Energy Market in Ohio: Historical Trends (Since 2021) and Forecasted Estimates (Till 2035)
- 24.2.25. US Renewable Energy Market in Washington: Historical Trends (Since 2021) and Forecasted Estimates (Till 2035)
- 24.2.26. US Renewable Energy Market in Missouri: Historical Trends (Since 2021) and Forecasted Estimates (Till 2035)
- 24.2.27. US Renewable Energy Market in Wisconsin: Historical Trends (Since 2021) and Forecasted Estimates (Till 2035)
- 24.2.28. US Renewable Energy Market in Utah: Historical Trends (Since 2021) and Forecasted Estimates (Till 2035)
- 24.2.29. US Renewable Energy Market in Pennsylvania: Historical Trends (Since 2021) and Forecasted Estimates (Till 2035)
- 24.2.30. US Renewable Energy Market in Montana: Historical Trends (Since 2021) and Forecasted Estimates (Till 2035)
- 24.2.31. US Renewable Energy Market in Maine: Historical Trends (Since 2021) and Forecasted Estimates (Till 2035)
- 24.2.32. US Renewable Energy Market in Arkansas: Historical Trends (Since 2021) and Forecasted Estimates (Till 2035)
- 24.2.33. US Renewable Energy Market in Idaho: Historical Trends (Since 2021) and Forecasted Estimates (Till 2035)
- 24.2.34. US Renewable Energy Market in South Carolina: Historical Trends (Since 2021) and Forecasted Estimates (Till 2035)
- 24.2.35. US Renewable Energy Market in Alabama: Historical Trends (Since 2021) and Forecasted Estimates (Till 2035)
- 24.2.36. US Renewable Energy Market in Mississippi: Historical Trends (Since 2021) and Forecasted Estimates (Till 2035)
- 24.2.37. US Renewable Energy Market in Louisiana: Historical Trends (Since 2021) and Forecasted Estimates (Till 2035)
- 24.2.38. US Renewable Energy Market in Massachusetts: Historical Trends (Since 2021) and Forecasted Estimates (Till 2035)
- 24.2.39. US Renewable Energy Market in New Jersey: Historical Trends (Since 2021) and Forecasted Estimates (Till 2035)
- 24.2.40. US Renewable Energy Market in West Virginia: Historical Trends (Since 2021) and Forecasted Estimates (Till 2035)
- 24.2.41. US Renewable Energy Market in Maryland: Historical Trends (Since 2021) and Forecasted Estimates (Till 2035)
- 24.2.42. US Renewable Energy Market in Hawaii: Historical Trends (Since 2021) and Forecasted Estimates (Till 2035)
- 24.2.43. US Renewable Energy Market in Tennessee: Historical Trends (Since 2021) and Forecasted Estimates (Till 2035)
- 24.2.44. US Renewable Energy Market in Kentucky: Historical Trends (Since 2021) and Forecasted Estimates (Till 2035)
- 24.2.45. US Renewable Energy Market in New Hampshire: Historical Trends (Since 2021) and Forecasted Estimates (Till 2035)
- 24.2.46. US Renewable Energy Market in Connecticut: Historical Trends (Since 2021) and Forecasted Estimates (Till 2035)
- 24.2.47. US Renewable Energy Market in Rhode Island: Historical Trends (Since 2021) and Forecasted Estimates (Till 2035)
- 24.2.48. US Renewable Energy Market in Vermont: Historical Trends (Since 2021) and Forecasted Estimates (Till 2035)
- 24.2.49. US Renewable Energy Market in Delaware: Historical Trends (Since 2021) and Forecasted Estimates (Till 2035)
- 24.2.50. US Renewable Energy Market in Alaska: Historical Trends (Since 2021) and Forecasted Estimates (Till 2035)
- 24.3. Data Triangulation and Validation
25. CONCLUDING INSIGHTS
26. APPENDIX I: TABULATED DATA
27. APPENDIX II: LIST OF COMPANIES AND ORGANIZATIONS

