
PUBLISHER: Roots Analysis | PRODUCT CODE: 2028467

PUBLISHER: Roots Analysis | PRODUCT CODE: 2028467
ADC Technology Market (3rd Edition) by Generation of Technology, Type of Conjugation, Type of Linker, and Geographical Regions - Industry Trends and Global Forecasts, Till 2040
ADC Technology Market: Overview
As per Roots Analysis, the antibody drug conjugate (ADC) technology market is estimated to grow from USD 3.44 billion in the current year to USD 9.51 billion by 2040, at a CAGR of 7.5% during the forecast period, till 2040.
ADC Technology Market: Growth and Trends
Antibody-drug conjugates (ADCs) have emerged as a compelling alternative to conventional anticancer therapies. These advanced biotherapeutics combine a cytotoxic payload with a monoclonal antibody via a linker; however, their structural complexity presents challenges in achieving optimal tolerability and efficacy, necessitating advanced conjugation technologies that enable controlled assembly while maintaining favorable safety profiles.
ADC conjugation approaches typically involve antibody engineering to facilitate precise attachment of linker-drug payloads, while linker technologies focus on developing stable moieties that ensure efficient and targeted payload delivery. Continuous optimization of these elements enables the production of homogeneous ADCs with high drug-to-antibody ratios (DARs), resulting in improved stability and enhanced therapeutic performance within the tumor microenvironment.
Furthermore, homogeneous ADCs incorporating advanced linker chemistries demonstrate reduced immunogenicity and improved target specificity, enabling precise delivery with minimal off-target effects. Driven by these advantages, both emerging companies and established players are actively investing in innovative conjugation platforms, more potent payloads, and next-generation linker technologies.
In addition, ADC developers are increasingly forming strategic partnerships with specialized technology providers to access advanced capabilities and domain expertise. Supported by the rising demand for targeted oncology therapies, the ADC linker and conjugation technologies market is poised for significant growth in the coming years.
Growth Drivers: Strategic Enablers of Market Expansion
The ADC technology market is propelled by surging global cancer prevalence, an aging and increasingly obese population, and an intensifying demand for precision oncology therapies that deliver potent payloads selectively to tumor cells while sparing healthy tissue. Advancements in site-specific conjugation methods such as engineered cysteines, enzymatic transglutaminase approaches, and chemoenzymatic platforms are enabling homogeneous drug-to-antibody ratios (DARs) that dramatically enhance pharmacokinetic profiles, therapeutic windows, and overall safety compared to traditional stochastic lysine or cysteine linkages. Concurrently, next-generation linker chemistries, dominated by cleavable systems facilitate precise intracellular payload release, minimizing systemic toxicity and off-target effects; these are amplified by heavy R&D investments, prolific clinical pipelines, strategic pharma-biotech collaborations, CDMO partnerships for scalable manufacturing, and regulatory accelerations that together foster innovation in stable, tumor-activated designs and propel market growth.
Market Challenges: Critical Barriers Impeding Progress
Batch-to-batch variability remains a key challenge in ADC manufacturing due to the use of multiple conjugation chemistries, which often yield heterogeneous mixtures comprising unconjugated antibodies, free toxins, and ADC products. This heterogeneity leads to variability in drug-to-antibody ratios (DARs) and conjugation sites, resulting in inconsistencies across batches. In addition, off-target toxicity continues to pose significant safety concerns, as unintended release of cytotoxic payloads can impact healthy tissues, including the liver, bone marrow, and nervous system. Despite advancements in antibody and linker technologies, maintaining an optimal balance between safety and therapeutic efficacy remains complex. These challenges can adversely affect clinical outcomes and hinder development timelines, underscoring the need for more precise and controlled conjugation approaches.
ADC Technology Market: Key Insights
The report delves into the current state of the ADC technology market and identifies potential growth opportunities within industry. Some key findings from the report include:
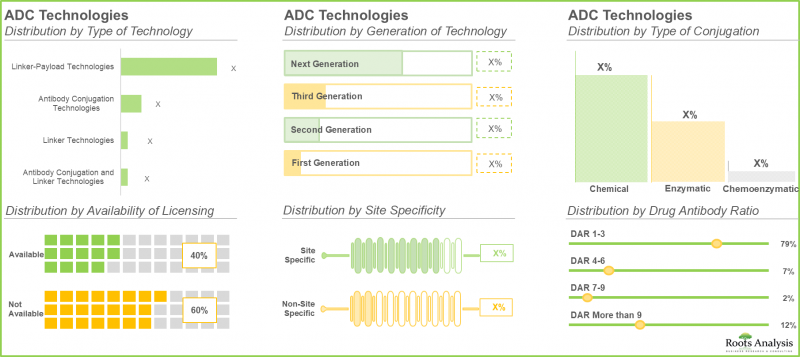
- At present, over 130 antibody drug conjugate technologies are being offered by various companies across the globe; of these, over 60% of the technologies use chemical conditions for conjugation of antibody fragment.
- The patent activity in the domain has increased at a steady pace during the given period; majority (~50%) of the patents were filed / granted in North America.
- A steady growth in the partnership activity has been observed in recent years; licensing agreements emerged as the most prominent type of partnership model in this domain.
- More than 50% of the technology providers have signed multiple partnerships to out-license their technologies, reflecting high demand for specialized ADC platforms, including linkers, payloads, and site-specific technologies.
- In the long term, technologies utilizing chemical conjugation methods are likely to drive the overall market; notably, Asia-pacific is anticipated to be the fastest growing region.
- The ADC technologies market in North America is expected to capture maximum share by 2040; further, majority of the technologies are next-generation technologies.
- Given the increasing prevalence of chronic as well as genetic diseases, the need for advanced ADC technologies has increased considerably, thereby increasing the market opportunity for these technologies.
ADC Technology Market
The market sizing and opportunity analysis has been segmented across the following parameters:
By Generation of Technology
- Next-Generation
- Third-Generation
- Second-Generation
- First-Generation
By Type of Conjugation
- Chemical
- Chemoenzymatic
- Enzymatic
By Type of Linker
- Cleavable
- Non-cleavable
By Geographical Regions
- North America
- Europe
- Asia-Pacific
- Latin America
- Middle East and North Africa
ADC Technology Market: Key Segments
Which Type of Linker Accounts for the Largest Share of Market?
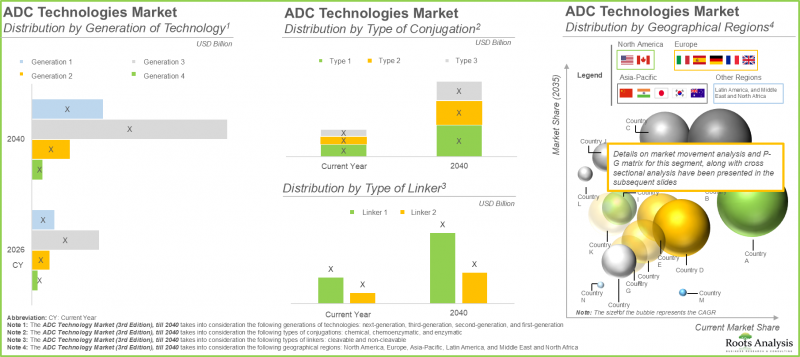
In the current year, the cleavable linker segment is expected to account for the largest share of the ADC technology market, driven by its ability to enable selective payload release within target cells through intracellular triggers, thereby balancing systemic stability with efficient drug activation at tumor sites. In contrast, the non-cleavable linker segment is projected to register a higher CAGR over the forecast period.
Which Type of Conjugation Holds the Highest Share in the Market?
Based on current market analysis, chemical conjugation is anticipated to dominate the ADC technology market in the current year, owing to its established scalability, cost-effectiveness, and proven clinical performance in approved therapies. This approach facilitates the consistent production of ADCs with reliable drug-to-antibody ratios (DARs). Additionally, chemoenzymatic conjugation technologies are expected to witness a higher CAGR during the forecast period, supported by their potential for enhanced precision and control.
Which Generation of Technology Accounts for the Largest Share in the ADC Technology Market?
The third-generation ADC technologies segment is projected to hold the largest market share in the current year, a trend expected to persist in the near term. This dominance is attributed to advancements such as site-specific conjugation and the incorporation of highly potent payloads, including topoisomerase I inhibitors, which offer improved therapeutic indices by maximizing efficacy while minimizing off-target toxicity. Furthermore, successful clinical outcomes and regulatory approvals of therapies such as Enhertu (trastuzumab deruxtecan) and Trodelvy (sacituzumab govitecan) have strengthened stakeholder confidence and accelerated market adoption.
North America: Dominating the Market by Securing Highest Share
North America is projected to dominate the ADC technology market, capturing the largest share in the current year. Meanwhile, the Asia-Pacific region is expected to exhibit the fastest growth through 2040, driven by a strong and evolving ADC ecosystem, increasing regulatory approvals, robust research and development activity, and a rising oncology burden.
Example Players in ADC Technology Market
- Ajinomoto Bio-Pharma Services
- Alteogen
- Antikor Biopharma
- Catalent Biologics
- Debiopharm
- Heidelberg Pharma
- Iksuda Therapeutics
- LigaChem Biosciences
- Mersana Therapeutics
- NBE Therapeutics
- Sutro Biopharma
- Synaffix
ADC Technology Market: Research Coverage
- Market Sizing and Opportunity Analysis: The report features an in-depth analysis of the medical device contract manufacturing market, focusing on key market segments, including [A] generation of technology [B] type of conjugation, [C] type of linker, and [D] geographical regions.
- ADC Technology Market Landscape: A detailed assessment of the overall ADC technology market landscape, along with information on several relevant parameters, such as [A] company overview, [B] type of technology, [C] availability of licensing, [D] generation of technology, [E] site specificity, [F] type of conjugation, [G] drug antibody ratio, [H] compatible linker, [I] conjugation chemistry, [J] conjugation site, and [K] type of linker.
- Technology Competitiveness Analysis: An in-depth technology competitiveness analysis of ADC technologies segregated based on their location of headquarters of their respective providers based on various relevant parameters, such as [A] portfolio strength, [B] technology competitiveness, as well as [C] partnership activity in terms of number of partnerships.
- Company Profiles: In-depth profiles of leading players engaged in engaged in offering ADC technologies based on several parameters such as [A] year of establishment, [B] location of headquarters, [C] product portfolio, [D] recent developments and [E] an informed future outlook.
- Patent Analysis: A detailed analysis of the patents that have been filed / granted for ADC technologies, based on important parameters such as, [A] type of patent, [B] publication year, [C] application year, [D] number of granted patents and patent applications, [E] patent jurisdiction, [F] CPC symbols, [G] patent age, [H] type of applicant, and [I] individual patent assignees (in terms of size of intellectual property portfolio).
- Partnerships and Collaborations: An in-depth analysis of the partnerships inked between various stakeholders in this domain, featuring a detailed set of analyses based on various parameters, such as [A] year of partnership, [B] type of partnership, [C] type of partner, [D] most popular technologies, [E] most active players and [F] regional analysis of the partnership activity.
- Business Model Analysis: An insightful analysis on business models adopted by various technology providers engaged in this domain along with the information on parameters, such as [A] year of partnership, [B] purpose of partnership, [C] type of business model adopted, [D] type of investment (upfront payments and milestone payments), [E] amount of investment and [F] most active players.
- Likely Partners Analysis: An in-depth analysis of several antibody drug conjugate therapeutics developers that are likely to partner with ADC technology providers in the near future, based on several relevant parameters, such as [A] developer score (based on year of establishment and company size), [B] portfolio score (based on type of linker and antibody structure), [C] pipeline score (based on stage of development of a drug and number of pre-clinical molecules) and [D] therapeutic area.
- Brand Positioning Analysis: A detailed brand positioning analysis of prominent antibody conjugation technology providers, highlighting the current perceptions regarding their proprietary technologies by taking into consideration several relevant aspects, such as [A] experience of the technology provider, [B] number of technologies offered, [C] product diversity, [D] number of patents and [E] number of partnerships.
- Case Study: A detailed case study on overall landscape of the ADC therapeutics market, based on a number of parameters, such as [A] stage of development, [B] target disease indication, [C] therapeutic area, [D] line of treatment, [E] dosing frequency, [F] type of therapy, [G] target antigen, [H] antibody isotype, [I] payload / cytotoxin / warhead, [J] payload type, [K] type of linker, [L] type of linker (cleavable / non-cleavable).
- Market Impact Analysis: An in-depth analysis of the factors that can impact the growth of the market. It also features identification and analysis of key drivers, potential restraints, emerging opportunities, and existing challenges in this domain.
Key Questions Answered in this Report
- Which are the leading companies in the ADC technology market?
- Which region dominates the ADC technology market?
- What are the key trends observed in the ADC technology market?
- What factors are likely to influence the evolution of this market?
- What are the primary challenges faced by ADC technology providers?
- What is the current and future market size?
- What is the CAGR of this market?
- How is the current and future market opportunity likely to be distributed across key market segments?
Reasons to Buy this Report
- The report provides a comprehensive market analysis, offering detailed revenue projections of the overall market and its specific sub-segments. This information is valuable to both established market leaders and emerging entrants.
- The report offers stakeholders a comprehensive overview of the market, including key drivers, barriers, opportunities, and challenges. This information empowers stakeholders to stay abreast of market trends and make data-driven decisions to capitalize on growth prospects.
- The report can aid businesses in identifying future opportunities in any sector. It also helps in understanding if those opportunities are worth pursuing.
- The report helps in identifying customer demand by understanding the needs, preferences, and behavior of the target audience in order to tailor products or services effectively.
- The report equips new entrants with requisite information regarding a particular market to help them build successful business strategies.
- The report allows for more effective communication with the audience and in building strong business relations.
Additional Benefits
- Complimentary Excel Data Packs for all Analytical Modules in the Report
- 15% Free Content Customization
- Detailed Report Walkthrough Session with Research Team
- Free Updated report if the report is 6-12 months old or older
TABLE OF CONTENTS
1. PREFACE
- 1.1. Introduction
- 1.2. Market Share Insights
- 1.3. Key Market Insights
- 1.4. Report Coverage
- 1.5. Key Questions Answered
- 1.6. Chapter Outlines
2. RESEARCH METHODOLOGY
- 2.1. Chapter Overview
- 2.2. Research Assumptions
- 2.2.1. Market Landscape and Market Trends
- 2.2.2. Market Forecast and Opportunity Analysis
- 2.2.3. Comparative Analysis
- 2.3. Database Building
- 2.3.1. Data Collection
- 2.3.2. Data Validation
- 2.3.3. Data Analysis
- 2.4. Project Methodology
- 2.4.1. Secondary Research
- 2.4.1.1. Annual Reports
- 2.4.1.2. Academic Research Papers
- 2.4.1.3. Company Websites
- 2.4.1.4. Investor Presentations
- 2.4.1.5. Regulatory Filings
- 2.4.1.6. White Papers
- 2.4.1.7. Industry Publications
- 2.4.1.8. Conferences and Seminars
- 2.4.1.9. Government Portals
- 2.4.1.10. Media and Press Releases
- 2.4.1.11. Newsletters
- 2.4.1.12. Industry Databases
- 2.4.1.13. Roots Proprietary Databases
- 2.4.1.14. Paid Databases and Sources
- 2.4.1.15. Social Media Portals
- 2.4.1.16. Other Secondary Sources
- 2.4.2. Primary Research
- 2.4.2.1. Types of Primary Research
- 2.4.2.1.1. Qualitative Research
- 2.4.2.1.2. Quantitative Research
- 2.4.2.1.3. Hybrid Approach
- 2.4.2.2. Advantages of Primary Research
- 2.4.2.3. Techniques for Primary Research
- 2.4.2.3.1. Interviews
- 2.4.2.3.2. Surveys
- 2.4.2.3.3. Focus Groups
- 2.4.2.3.4. Observational Research
- 2.4.2.3.5. Social Media Interactions
- 2.4.2.4. Key Opinion Leaders Considered in Primary Research
- 2.4.2.4.1. Company Executives (CXOs)
- 2.4.2.4.2. Board of Directors
- 2.4.2.4.3. Company Presidents and Vice Presidents
- 2.4.2.4.4. Research and Development Heads
- 2.4.2.4.5. Technical Experts
- 2.4.2.4.6. Subject Matter Experts
- 2.4.2.4.7. Scientists
- 2.4.2.4.8. Doctors and Other Healthcare Providers
- 2.4.2.5. Ethics and Integrity
- 2.4.2.5.1. Research Ethics
- 2.4.2.5.2. Data Integrity
- 2.4.2.1. Types of Primary Research
- 2.4.3. Analytical Tools and Databases
- 2.4.1. Secondary Research
- 2.5. Robust Quality Control
3. MARKET DYNAMICS
- 3.1. Chapter Overview
- 3.2. Forecast Methodology
- 3.2.1. Top-down Approach
- 3.2.2. Bottom-up Approach
- 3.2.3. Hybrid Approach
- 3.3. Market Assessment Framework
- 3.3.1. Total Addressable Market (TAM)
- 3.3.2. Serviceable Addressable Market (SAM)
- 3.3.3. Serviceable Obtainable Market (SOM)
- 3.3.4. Currently Acquired Market (CAM)
- 3.4. Forecasting Tools and Techniques
- 3.4.1. Qualitative Forecasting
- 3.4.2. Correlation
- 3.4.3. Regression
- 3.4.4. Extrapolation
- 3.4.5. Convergence
- 3.4.6. Sensitivity Analysis
- 3.4.7. Scenario Planning
- 3.4.8. Data Visualization
- 3.4.9. Time Series Analysis
- 3.4.10. Forecast Error Analysis
- 3.5. Key Considerations
- 3.5.1. Demographics
- 3.5.2. Government Regulations
- 3.5.3. Reimbursement Scenarios
- 3.5.4. Market Access
- 3.5.5. Supply Chain
- 3.5.6. Industry Consolidation
- 3.5.7. Pandemic / Unforeseen Disruptions Impact
- 3.6. Limitations
4. MACRO-ECONOMIC INDICATORS
- 4.1. Chapter Overview
- 4.2. Market Dynamics
- 4.2.1. Time Period
- 4.2.1.1. Historical Trends
- 4.2.1.2. Current and Forecasted Estimates
- 4.2.2. Currency Coverage
- 4.2.2.1. Major Currencies Affecting the Market
- 4.2.2.2. Factors Affecting Currency Fluctuations on the Industry
- 4.2.2.3. Impact of Currency Fluctuations on the Industry
- 4.2.3. Foreign Currency Exchange Rate
- 4.2.3.1. Impact of Foreign Exchange Rate Volatility on the Market
- 4.2.3.2. Strategies for Mitigating Foreign Exchange Risk
- 4.2.4. Recession
- 4.2.4.1. Assessment of Current Economic Conditions and Potential Impact on the Market
- 4.2.4.2. Historical Analysis of Past Recessions and Lessons Learnt
- 4.2.5. Inflation
- 4.2.5.1. Measurement and Analysis of Inflationary Pressures in the Economy
- 4.2.5.2. Potential Impact of Inflation on the Market Evolution
- 4.2.6. Interest Rates
- 4.2.6.1. Interest Rates and Their Impact on the Market
- 4.2.6.2. Strategies for Managing Interest Rate Risk
- 4.2.7. Commodity Flow Analysis
- 4.2.7.1. Type of Commodity
- 4.2.7.2. Origins and Destinations
- 4.2.7.3. Values and Weights
- 4.2.7.4. Modes of Transportation
- 4.2.8. Global Trade Dynamics
- 4.2.8.1. Import Scenario
- 4.2.8.2. Export Scenario
- 4.2.8.3. Trade Policies
- 4.2.8.4. Strategies for Mitigating the Risks Associated with Trade Barriers
- 4.2.8.5. Impact of Trade Barriers on the Market
- 4.2.9. War Impact Analysis
- 4.2.9.1. Russian-Ukraine War
- 4.2.9.2. Israel-Hamas War
- 4.2.10. COVID Impact / Related Factors
- 4.2.10.1. Global Economic Impact
- 4.2.10.2. Industry-specific Impact
- 4.2.10.3. Government Response and Stimulus Measures
- 4.2.10.4. Future Outlook and Adaptation Strategies
- 4.2.11. Other Indicators
- 4.2.11.1. Fiscal Policy
- 4.2.11.2. Consumer Spending
- 4.2.11.3. Gross Domestic Product
- 4.2.11.4. Employment
- 4.2.11.5. Taxes
- 4.2.11.6. Stock Market Performance
- 4.2.11.7. Cross Border Dynamics
- 4.2.1. Time Period
- 4.3. Conclusion
5. EXECUTIVE SUMMARY
6. INTRODUCTION
- 6.1. Chapter Overview
- 6.2. Antibody Drug Conjugates
- 6.2.1. Components of an ADC
- 6.2.1.1. Antibody
- 6.2.1.2. Cytotoxin
- 6.2.1.3. Linker
- 6.2.1. Components of an ADC
- 6.3. Advantages of ADCs over Conventional Therapeutics
- 6.4. ADC Linker Technologies
- 6.4.1. Non-cleavable Linkers
- 6.4.2. Cleavable Linkers
- 6.5. ADC Conjugation Technologies
- 6.5.1. Chemical Conjugation
- 6.5.2. Enzymatic Conjugation
- 6.6. Future Perspective
7. MARKET LANDSCAPE: ADC CONJUGATION AND LINKER TECHNOLOGIES
- 7.1. Chapter Overview
- 7.2. ADC Conjugation and Linker Technologies: Overall Market Landscape
- 7.2.1. Analysis by Type of Technology
- 7.2.2. Analysis by Availability of Licensing
- 7.2.3. Analysis by Generation of Technology
- 7.3.4. Analysis by Type of Conjugation
- 7.3.5. Analysis by Site Specificity
- 7.3.6. Analysis by Drug Antibody Ratio (DAR)
- 7.3.7. Analysis by Conjugation Chemistry
- 7.3.8. Analysis by Conjugation Site
- 7.3.9. Analysis by Type of Linker
- 7.3. ADC Conjugation and Linker Technology Providers
- 7.3.1. Analysis by Year of Establishment
- 7.3.2. Analysis by Company Size
- 7.3.3. Analysis by Location of Headquarters
- 7.3.4. Analysis by Year of Establishment and Location of Headquarters
8. TECHNOLOGY COMPETITIVENESS ANALYSIS
- 8.1. Chapter Overview
- 8.2. Assumptions and Key Parameters
- 8.3. Methodology
- 8.4. ADC Technologies: Technology Competitiveness Analysis
- 8.4.1. Technologies Offered by Providers based in North America (Peer Group I)
- 8.4.2. Technologies Offered by Providers based in Europe (Peer Group II)
- 8.4.3. Technologies Offered by Providers based in Asia-Pacific (Peer Group III)
9. COMPANY PROFILES
- 9.1. Chapter Overview
- 9.2. ADC Technology Developers Headquartered in North America
- 9.2.1. Ajinomoto Bio-Pharma Services
- 9.2.1.2. Company Overview
- 9.2.1.3. Financial Information
- 9.2.1.4. Technology Portfolio
- 9.2.1.5. Recent Developments and Future Outlook
- 9.2.2. Catalent Biologics
- 9.2.2.1. Company Overview
- 9.2.2.2. Financial Information
- 9.2.2.3. Technology Portfolio
- 9.2.2.4. Recent Developments and Future Outlook
- 9.2.3. Mersana Therapeutics
- 9.2.3.1. Company Overview
- 9.2.3.2. Financial Information
- 9.2.3.3. Technology Portfolio
- 9.2.3.4. Recent Developments and Future Outlook
- 9.2.4. Sutro Biopharma
- 9.2.4.1. Company Overview
- 9.2.4.2. Financial Information
- 9.2.4.3. Technology Portfolio
- 9.2.4.4. Recent Developments and Future Outlook
- 9.2.1. Ajinomoto Bio-Pharma Services
- 9.3. ADC Technology Developers Headquartered in Europe
- 9.3.1. Antikor Biopharma
- 9.3.1.1. Company Overview
- 9.3.1.2. Technology Portfolio
- 9.3.1.3. Recent Developments and Future Outlook
- 9.3.2. Debiopharm
- 9.3.2.1. Company Overview
- 9.3.2.2. Technology Portfolio
- 9.3.2.3. Recent Developments and Future Outlook
- 9.3.3. Heidelberg Pharma
- 9.3.3.1. Company Overview
- 9.3.3.2. Financial Information
- 9.3.3.3. Technology Portfolio
- 9.3.3.4. Recent Developments and Future Outlook
- 9.3.4. Iksuda Therapeutics
- 9.3.4.1. Company Overview
- 9.3.4.2. Technology Portfolio
- 9.3.4.3. Recent Developments and Future Outlook
- 9.3.5. NBE-Therapeutics
- 9.3.5.1. Company Overview
- 9.3.5.2. Financial Information
- 9.3.5.3. Technology Portfolio
- 9.3.5.4. Recent Developments and Future Outlook
- 9.3.6. Synaffix (a Lonza Company)
- 9.3.6.1. Company Overview
- 9.3.6.2. Financial Information
- 9.3.6.3. Technology Portfolio
- 9.3.6.4. Recent Developments and Future Outlook
- 9.3.1. Antikor Biopharma
- 9.4. ADC Technology Developers Headquartered in Asia-Pacific and Rest of the World
- 9.4.1. Alteogen
- 9.4.1.1. Company Overview
- 9.4.1.2. Technology Portfolio
- 9.4.1.3. Recent Developments and Future Outlook
- 9.5.2. LigaChem Biosciences
- 9.5.2.1. Company Overview
- 9.5.2.2. Technology Portfolio
- 9.5.2.3. Recent Developments and Future outlook
- 9.4.1. Alteogen
10. PATENT ANALYSIS
- 10.1. Chapter Overview
- 10.2. Scope and Methodology
- 10.3. ADC Conjugation and Linker Technologies: Patent Analysis
- 10.3.1. Analysis by Patent Publication Year
- 10.3.2. Analysis by Type of Patent and Publication Year
- 10.3.3. Analysis by Patent Application Year
- 10.3.4. Analysis by Patent Jurisdiction
- 10.3.5. Analysis by CPC Symbols
- 10.3.6. Analysis by Type of Applicant
- 10.3.7. Leading Industry Players: Analysis by Number of Patents
- 10.3.8. Leading Non-Industry Players: Analysis by Number of Patents
- 10.4. Patent Benchmarking Analysis
- 10.4.1. Analysis by Patent Characteristics
- 10.5. Patent Valuation
- 10.6. Leading Patents by Number of Citations
11. PARTNERSHIPS AND COLLABORATIONS
- 11.1. Chapter Overview
- 11.2. Partnership Models
- 11.3. ADC Linker and Conjugation Technologies: Partnerships and Collaborations
- 11.3.1. Analysis by Year of Partnership
- 11.3.2. Analysis by Type of Partnership
- 11.3.3. Analysis by Year of Partnership and Type of Partnership
- 11.3.4. Analysis by Purpose of Partnership
- 11.3.5. Analysis by Type of Partner
- 11.3.6. Most Active Players: Analysis by Number of Partnerships
- 11.3.7. Most Popular Technologies: Analysis by Number of Partnerships
- 11.4. Analysis by Geography
- 11.4.1. Local and International Agreements
- 11.4.12. Intercontinental and Intracontinental Agreements
12. BUSINESS MODEL ANALYSIS
- 12.1. Chapter Overview
- 12.2 Business Models
- 12.3. ADC Technology Providers: Business Model Analysis
- 12.3.1. Analysis by Purpose of Partnership
- 12.3.2. Analysis by Year of Partnership and Purpose of Partnership
- 12.3.3. Analysis by Type of Business Model Adopted
- 12.3.4. Analysis by Deal Value
- 12.3.5. Analysis by Type of Business Model Adopted and Deal Value
- 12.4. Most Active Players: Analysis by Number of Partnerships
- 12.4.1. Lonza
- 12.4.1.1. Analysis by Purpose of Partnership
- 12.4.1.2. Analysis of Year of Partnership and Business Model Adopted
- 12.4.2. LigaChem Biosciences
- 12.4.2.1. Analysis by Purpose of Partnership
- 12.4.2.2. Analysis by Year of Partnership and Business Model Adopted
- 12.4.3. Debiopharm
- 12.4.3.1. Analysis by Purpose of Partnership
- 12.4.3.2. Analysis by Year of Partnership and Business Model Adopted
- 12.4.4. Duality Biologics
- 12.4.4.1. Analysis by Year of Partnership and Business Model Adopted
- 12.4.5. IntoCell
- 12.4.5.1. Analysis by Purpose of Partnership
- 12.4.5.2. Analysis by Year of Partnership and Business Model Adopted
- 12.4.1. Lonza
- 12.5. Concluding Remarks
13. LIKELY PARTNER ANALYSIS
- 13.1. Chapter Overview
- 13.2. Assumptions and Key Parameters
- 13.3. Scope and Methodology
- 13.4. Potential Strategic Partners in North America
- 13.4.1. Most Likely Partners
- 13.4.2. Likely Partners
- 13.4.3. Less Likely Partners
- 13.5. Potential Strategic Partners in Europe
- 13.5.1. Most Likely Partners
- 13.5.2. Likely Partners
- 13.5.3. Less Likely Partners
- 13.6. Potential Strategic Partners in Asia-Pacific and Rest of the World
- 13.6.1. Most Likely Partners
- 13.6.2. Likely Partners
- 13.6.3. Less Likely Partners
14. BRAND POSITIONING ANALYSIS
- 14.1. Chapter Overview
- 14.2 Scope and Methodology
- 14.3. Key Parameters
- 14.4. Brand Positioning Matrix: ADC Technology Providers
- 14.4.1. Brand Positioning Matrix: Byondis
- 14.4.2. Brand Positioning Matrix: Catalent Biologics
- 14.4.3. Brand Positioning Matrix: Creative Biolabs
- 14.4.4. Brand Positioning Matrix: Duality Biologics
- 14.4.5. Brand Positioning Matrix: GeneQuantum Healthcare
- 14.4.6. Brand Positioning Matrix: Mersana Therapeutics
- 14.4.7. Brand Positioning Matrix: OBI Pharma
- 14.4.8. Brand Positioning Matrix: Synaffix
- 14.4.9. Brand Positioning Matrix: Tubulis
- 14.4.10. Brand Positioning Matrix: Zymeworks
15. CASE STUDY: ANTIBODY DRUG CONJUGATES
- 15.1. Chapter Overview
- 15.2. Antibody-Drug Conjugates: Overall Market Landscape
- 15.2.1. Analysis by Stage of Development
- 15.2.2. Analysis by Target Indication
- 15.2.3. Analysis by Therapeutics Area
- 15.2.4. Analysis by Line of Treatment
- 15.2.5. Analysis by Dosing Frequency
- 15.2.6. Analysis by Type of Therapy
- 15.2.7. Analysis by Target Antigen
- 15.2.8. Analysis by Antibody Isotypes
- 15.2.9. Analysis by Type of Linker (Cleavable / Non-cleavable)
- 15.2.10. Analysis by Payload / Cytotoxin / Warhead
- 15.2.11. Analysis by Type of Payload
- 15.3. Antibody-Drug Conjugate Developers: Overall Landscape
- 15.3.1. Analysis by Year of Establishment
- 15.3.2. Analysis by Company Size
- 15.3.3. Analysis by Location of Headquarters
- 15.3.4. Most Active Player: Analysis by Number of Therapies
16. MARKET IMPACT ANALYSIS
- 16.1. Chapter Overview
- 16.2. Market Drivers
- 16.3. Market Restraints
- 16.4. Market Opportunities
- 16.5. Market Challenges
- 16.6. Conclusion
17. GLOBAL ADC TECHNOLOGY MARKET
- 17.1. Chapter Overview
- 17.2. Key Assumptions and Methodology
- 17.3. Global ADC Technology Market: Historical Trends (since 2025) and Forecasted Estimates (till 2040)
- 17.3.1. Roots Analysis Perspective on Market Growth
- 17.3.2. Scenario Analysis
- 17.3.1.1. Conservative Scenario
- 17.3.1.2. Optimistic Scenario
- 17.4. Key Market Segmentations
18. ADC TECHNOLOGY MARKET, BY GENERATION OF TECHNOLOGY
- 18.1. Chapter Overview
- 18.2. Key Assumptions and Methodology
- 18.3. ADC Technology Market: Distribution by Generation of Technology
- 18.3.1. ADC Technology Market for Next-Generation: Historical Trends (since 2025) and Forecasted Estimates (till 2040)
- 18.3.2. ADC Technology Market for Third-Generation: Historical Trends (since 2025) and Forecasted Estimates (till 2040)
- 18.3.3. ADC Technology Market for Second-Generation: Historical Trends (since 2025) and Forecasted Estimates (till 2040)
- 18.3.4. ADC Technology Market for First-Generation: Historical Trends (since 2025) and Forecasted Estimates (till 2040)
- 18.4. Data Triangulation and Validation
19. ADC TECHNOLOGY MARKET, BY TYPE OF CONJUGATION
- 19.1. Chapter Overview
- 19.2. Key Assumptions and Methodology
- 19.3. ADC Technology Market: Distribution by Type of Conjugation
- 19.3.1. ADC Technology Market for Chemical Conjugation: Historical Trends (since 2025) and Forecasted Estimates (till 2040)
- 19.3.2. ADC Technology Market for Chemoenzymatic Conjugation: Historical Trends (since 2025) and Forecasted Estimates (till 2040)
- 19.3.3. ADC Technology Market for Enzymatic Conjugation: Historical Trends (since 2025) and Forecasted Estimates (till 2040)
- 19.4. Data Triangulation and Validation
20. ADC TECHNOLOGY MARKET, BY TYPE OF LINKER
- 20.1. Chapter Overview
- 20.2. Key Assumptions and Methodology
- 20.3. ADC Technology Market: Distribution by Type of Linker
- 20.3.1. ADC Technology Market for Cleavable Linker: Historical Trends (since 2025) and Forecasted Estimates (till 2040)
- 20.3.2. ADC Technology Market for Non-cleavable Linker: Historical Trends (since 2025) and Forecasted Estimates (till 2040)
- 20.4. Data Triangulation and Validation
21. ADC TECHNOLOGY MARKET, BY GEOGRAPHICAL REGIONS
- 21.1. Chapter Overview
- 21.2. Key Assumptions and Methodology
- 21.3. ADC Technology Market: Distribution by Geographical Regions
- 21.3.1. ADC Technology Market in North America: Historical Trends (since 2025) and Forecasted Estimates (till 2040)
- 21.3.2. ADC Technology Market in Europe: Historical Trends (since 2025) and Forecasted Estimates (till 2040)
- 21.3.3. ADC Technology Market in Asia-Pacific: Historical Trends (since 2025) and Forecasted Estimates (till 2040)
- 21.3.4. ADC Technology Market in Latin America: Historical Trends (since 2025) and Forecasted Estimates (till 2040)
- 21.3.5. ADC Technology Market in Middle East and North Africa: Historical Trends (since 2025) and Forecasted Estimates (till 2040)
- 21.4. Data Triangulation and Validation
- *Detailed information on cross sectional analysis is available in the Excel Data Packs shared along with the report**
22. CONCLUSION
23. EXECUTIVE INSIGHTS
- 23.1. Chapter Overview
- 23.2. Company A
- 23.2.1. Company Snapshot
- 23.2.2. Interview Transcript: * Oncology Business Development and Preclinical Project Leader, R&D Oncology
- 23.3. Company B
- 23.3.1. Company Snapshot
- 23.3.2. Interview Transcript: Associate General Manager
- 2.4. Company C
- 23.4.1. Company Snapshot
- 23.4.2. Interview Transcript: Scientist II
- 23.5. Company D
- 23.5.1. Company Snapshot
- 23.5.2. Interview Transcript: Co-Founder and Chief Scientific Officer
- 23.6. Company E
- 23.6.1. Company Snapshot
- 23.6.2. Interview Transcript: Head of Strategy and Business Development
- 23.7. Company F
- 23.7.1. Company Snapshot
- 23.7.2. Interview Transcript: Board Member
- 23.8. Company G
- 23.8.1. Company Snapshot
- 23.8.2. Interview Transcript: General Manager, Research and Development, Director of ADC Process Development and Tech Transfer
- 23.9. Company H
- 23.9.1. Company Snapshot
- 23.9.2. Interview Transcript: Head of Research and Development
- 23.10. Company I
- 23.10.1. Company Snapshot
- 23.10.2. Interview Transcript: Former Chief Business Officer
- 23.11. Company J
- 23.11.1. Company Snapshot
- 23.11.2. Interview Transcript: Chief Executive Officer
- 23.12. Company K
- 23.12.1. Company Snapshot
- 23.12.2. Interview Transcript: Chief Scientific Officer
24. APPENDIX 1: TABULATED DATA
25. APPENDIX 2: LIST OF COMPANIES AND ORGANIZATIONS
List of Tables
- Table 6.1. Commonly Used Cytotoxins in ADC Therapeutics
- Table 6.2 OEB Bands: Guidelines by SafeBridge Consultants
- Table 7.1. ADC Technologies: Information on Type of Technology, Status of Technology, Availability of Licensing, and Generation of Technology
- Table 7.2. ADC Technologies: Information on Type of Conjugation, Site Specificity, and Drug Antibody Ratio
- Table 7.3. ADC Technologies: Information on Conjugation Chemistry, Conjugation Site, and Type of Linker
- Table 7.4 List of ADC Conjugation and Linker Technology Providers
- Table 9.1. ADC Linkers and Conjugation Technologies: List of Companies Profiled
- Table 9.2. Ajinomoto Bio-Pharma Services: Company Overview
- Table 9.3. Ajinomoto Bio-Pharma Services: Technology Portfolio
- Table 9.4. Ajinomoto Bio-Pharma Services: Recent Developments and Future Outlook
- Table 9.5. Catalent Biologics: Company Overview
- Table 9.6. Catalent Biologics: Technology Portfolio
- Table 9.7. Catalent Biologics: Antibody Drug Conjugates Portfolio
- Table 9.8. Catalent Biologics: Recent Developments and Future Outlook
- Table 9.9. Mersana Therapeutics: Company Overview
- Table 9.10. Mersana Therapeutics: Technology Portfolio
- Table 9.11. Mersana Therapeutics: Antibody Drug Conjugates Portfolio
- Table 9.12. Mersana Therapeutics: Recent Developments and Future Outlook
- Table 9.13. Sutro Biopharma: Company Overview
- Table 9.14. Sutro Biopharma: Technology Portfolio
- Table 9.15. Sutro Biopharma: Antibody Drug Conjugates Portfolio
- Table 9.16. Sutro Biopharma: Recent Developments and Future Outlook
- Table 9.17. Antikor Biopharma: Company Overview
- Table 9.18. Antikor Biopharma: Technology Portfolio
- Table 9.19. Antikor Biopharma: Antibody Drug Conjugates Portfolio
- Table 9.20. Debiopharm: Company Overview
- Table 9.21. Debiopharm: Technology Portfolio
- Table 9.22. Debiopharm: Antibody Drug Conjugates Portfolio
- Table 9.23. Debiopharm: Recent Developments and Future Outlook
- Table 9.24. Heidelberg Pharma: Company Overview
- Table 9.25. Heidelberg Pharma: Technology Portfolio
- Table 9.26. Heidelberg Pharma: Antibody Drug Conjugates Portfolio
- Table 9.27. Heidelberg Pharma: Recent Developments and Future Outlook
- Table 9.28. Iksuda Therapeutics: Company Overview
- Table 9.29. Iksuda Therapeutics: Technology Portfolio
- Table 9.30. Iksuda Therapeutics: Antibody Drug Conjugates Portfolio
- Table 9.31. Iksuda Therapeutics: Recent Developments and Future Outlook
- Table 9.32. NBE Therapeutics: Company Overview
- Table 9.33. NBE Therapeutics: Technology Portfolio
- Table 9.34. NBE Therapeutics: Antibody Drug Conjugates Portfolio
- Table 9.35. NBE Therapeutics: Recent Developments and Future Outlook
- Table 9.36. Synaffix: Company Overview
- Table 9.37. Synaffix: Technology Portfolio
- Table 9.38. Synaffix: Recent Developments and Future Outlook
- Table 9.39. Catalent Biologics: Company Overview
- Table 9.40. Alteogen: Technology Portfolio
- Table 9.41. Alteogen: Antibody Drug Conjugates Portfolio
- Table 9.42. LigaChem Biosciences: Company Overview
- Table 9.43. LigaChem Biosciences: Technology Portfolio
- Table 9.44. LigaChem Biosciences: Antibody Drug Conjugates Portfolio
- Table 9.45. LigaChem Biosciences: Recent Developments and Future Outlook
- Table 10.1. Patent Analysis: Top CPC Sections
- Table 10.2. Patent Analysis: Top CPC Symbols
- Table 10.3. Patent Analysis: Top CPC Codes
- Table 10.4. Patent Analysis: Summary of Benchmarking Analysis
- Table 10.5. Patent Analysis: Categorization based on Weighted Valuation Scores
- Table 10.6. Patent Portfolio: List of Leading Patents (by Number of Citations)
- Table 11.1. ADC Technologies: Partnerships and Collaborations
- Table 12.1. ADC Technology Providers: Information on Business Model Adopted, Purpose of Partnership, and Deal Financials
- Table 13.1. ADC Technology: Most Likely Partners in North America
- Table 13.2. ADC Technology: Likely Partners in North America
- Table 13.3. ADC Technology: Less Likely Partners in North America
- Table 13.4. ADC Technology: Most Likely Partners in Europe
- Table 13.5. ADC Technology: Likely Partners in Europe
- Table 13.6. ADC Technology: Less Likely Partners in Europe
- Table 13.7. ADC Technology: Most Likely Partners in Asia-Pacific
- Table 13.8. ADC Technology: Likely Partners in Asia-Pacific
- Table 13.9. ADC Technology: Less Likely Partners in Asia-Pacific
- Table 15.1. Antibody Drug Conjugates: Information on Developer, Stage of Development, Target Indication and Therapeutic Area
- Table 15.2. Antibody Drug Conjugates: Information on Drug Candidates, Line of Treatment, Dosing Frequency and Type of Therapy
- Table 15.3. Antibody Drug Conjugates: Information on Target Antigen, Antibody Isotype, Type of Linker (Cleavable and Non-Cleavable), Payload / Cytotoxin / Warhead Type of Payload
- Table 15.4. Antibody-Drug Conjugate Developers: Information on Year of Establishment, Location of Headquarters (Country / Region), and Company Size
- Table 23.12. Debiopharm: Company Snapshot
- Table 23.1. Ajinomoto: Company Snapshot
- Table 23.1 Abzena: Company Snapshot
- Table 23.2. MedLink Therapeutics: Company Snapshot
- Table 23.3 Merck KGaA: Company Snapshot
- Table 23.4 Singzyme: Company Snapshot
- Table 23.5 Ajinomoto: Company Snapshot
- Table 23.6 Eucodis Bioscience: Company Snapshot
- Table 23.7 Shanghai Miracogen: Company Snapshot
- Table 23.8 NBE-Therapeutics: Company Snapshot
- Table 23.9 Synaffix: Company Snapshot
- Table 24.1 ADC Conjugation and Linker Technologies: Distribution by Type of Technology
- Table 24.2 ADC Conjugation and Linker Technologies: Distribution by Availability of Licensing
- Table 24.3 ADC Conjugation and Linker Technologies: Distribution by Generation of Technology
- Table 24.4 ADC Conjugation Technologies: Distribution by Type of Conjugation
- Table 24.5 ADC Conjugation Technologies: Distribution by Site Specificity
- Table 24.6 ADC Conjugation Technologies: Distribution by Drug Antibody Ratio
- Table 24.7 ADC Conjugation Technologies: Distribution by Compatible Linker
- Table 24.8 ADC Conjugation Technologies: Distribution by Conjugation Chemistry
- Table 24.9 ADC Conjugation Technologies: Distribution by Conjugation Site
- Table 24.10 ADC Linker and Linker-Payload Technologies: Distribution by Type of Linker
- Table 24.11 ADC Conjugation and Linker Technology Providers: Distribution by Year of Establishment
- Table 24.12 ADC Conjugation and Linker Technology Providers: Distribution by Company Size
- Table 24.13 ADC Conjugation and Linker Technology Providers: Distribution by Location of Headquarters
- Table 24.14 ADC Conjugation and Linker Technology Providers: Distribution by Year of Establishment and Location of Headquarters
- Table 24.15 Ajinomoto Bio-Pharma Services: Annual Revenues, FY 2021-H1 FY 2025 (JPY Billion)
- Table 24.16 Novo Nordisk (parent company of Catalent Biologics): Annual Revenues, FY 2021-9M FY 2025 (DKK Billion)
- Table 24.17 Mersana Therapeutics: Annual Revenues, FY 2021-9M FY 2025 (USD Million)
- Table 24.18 Sutro Biopharma: Annual Revenues, Fy 2021-9M FY 2025 (USD Million)
- Table 24.19 Heidelberg Pharma: Annual Revenues, FY 2021- 9M FY 2025 (EUR Million)
- Table 24.20 Boehringer Ingelheim (parent company of NBE Therapeutics): Annual Revenues, FY 2021-H1 FY 2025 (EUR Billion)
- Table 24.21 Lonza (parent company of Synaffix): Annual Revenues, FY 2021-9M FY 2025 (CHF Billion)
- Table 24.22 LigaChem Biosciences: Annual Revenues, FY 2021-9M FY 2025 (KRW Billion)
- Table 24.23 Patent Analysis: Distribution by Type of Patent
- Table 24.24 Patent Analysis: Cumulative Distribution by Publication Year, 2021-2025
- Table 24.25 Patent Analysis: Cumulative Distribution by Application Year, Pre-2019-2025
- Table 24.26 Patent Analysis: Distribution of Type of Patent by Publication Year, 2021-2025
- Table 24.27 Patent Analysis: Distribution by Patent Jurisdiction
- Table 24.28 Patent Analysis: Cumulative Year-wise Distribution by Type of Applicant
- Table 24.29 Leading Industry Players: Distribution by Number of Patents
- Table 24.30 Leading Patent Assignees: Distribution by Number of Patents
- Table 24.31 Patent Analysis: Distribution by Patent Age
- Table 24.32. ADC Technologies: Patent Valuation
- Table 24.33. Partnerships and Collaborations: Distribution by Year of Partnership
- Table 24.34. Partnerships and Collaborations: Distribution by Type of Partnership
- Table 24.35. Partnerships and Collaborations: Distribution by Year of Partnership and Type of Partnership, 2021-2025 (till November)
- Table 24.36. Most Active Players: Distribution by Number of Partnerships
- Table 24.37. Most Popular Technologies: Distribution by Number of Partnerships
- Table 24.38. Partnerships and Collaborations: Local and International Agreements
- Table 24.39. Partnerships and Collaborations: Intercontinental and Intracontinental Agreements
- Table 24.40. Business Models Analysis: Distribution by Purpose of Partnership
- Table 24.41. Business Models Analysis: Distribution by Year and Purpose of Partnership, 2021-2025 (till November)
- Table 24.42. Business Models Analysis: Distribution by Type of Business Model Adopted
- Table 24.43. Business Models Analysis: Distribution by Deal Value
- Table 24.44. Business Models Analysis: Distribution by Type of Business Model Adopted and Deal Value
- Table 24.45. Most Active Players: Analysis by Number of Partnerships
- Table 24.46. Lonza: Distribution by Purpose of Partnership
- Table 24.47. Lonza: Distribution by Year of Partnership and Business Model Adopted
- Table 24.48. LigaChem Biosciences: Distribution by Purpose of Partnership
- Table 24.49. LigaChem Biosciences: Distribution by Year of Partnership and Business Model Adopted
- Table 24.50. Debiopharm: Distribution by Purpose of Partnership
- Table 24.51. Debiopharm: Distribution by Year of Partnership and Business Model Adopted
- Table 24.52. Duality Biologics: Distribution by Purpose of Partnership
- Table 24.53. IntoCell: Distribution by Purpose of Partnership
- Table 24.54. IntoCell: Distribution by Year of Partnership and Business Model Adopted
- Table 24.55. Antibody-Drug Conjugates: Distribution by Stage of Development
- Table 24.56. Antibody-Drug Conjugates: Distribution by Target Indication
- Table 24.57. Antibody-Drug Conjugates: Distribution by Therapeutic Area
- Table 24.58. Antibody-Drug Conjugates: Distribution by Line of Treatment
- Table 24.59. Antibody-Drug Conjugates: Distribution by Dosing Frequency
- Table 24.60. Antibody-Drug Conjugates: Distribution by Type of Therapy
- Table 24.61. Antibody-Drug Conjugates: Distribution by Target Antigen
- Table 24.62. Antibody-Drug Conjugates: Distribution by Antibody Isotypes
- Table 24.63. Antibody-Drug Conjugates: Distribution by Type of Linker (Cleavable / Non-Cleavable)
- Table 24.64. Antibody-Drug Conjugates: Distribution by Payload / Cytotoxin / Warhead
- Table 24.65. Antibody-Drug Conjugates: Distribution by Type of Payload
- Table 24.66. Antibody-Drug Conjugate Developers: Distribution by Year of Establishment
- Table 24.67. Antibody-Drug Conjugate Developers: Distribution by Company Size
- Table 24.68. Antibody-Drug Conjugate Developers: Distribution by Location of Headquarters (Region)
- Table 24.69. Antibody-Drug Conjugate Developers: Distribution by Location of Headquarters (Country)
- Table 24.70. Most Active Players: Distribution by Number of Antibody-Drug Conjugates
- Table 24.71. Global ADC Technology Market, Historical Trends (Since 2025) and Forecasted Estimates (Till 2040): Conservative, Base and Optimistic Scenario, 2025-2040 (USD Billion)
- Table 24.72. ADC Technology Market: Distribution by Generation of Technology
- Table 24.73. ADC Technology Market for Next-Generation Technologies: Historical Trends (Since 2025) and Forecasted Estimates (Till 2040) (USD Billion)
- Table 24.74. ADC Technology Market for Third-Generation Technologies: Historical Trends (Since 2025) and Forecasted Estimates (Till 2040) (USD Billion)
- Table 24.75. ADC Technology Market for Second-Generation Technologies: Historical Trends (Since 2025) and Forecasted Estimates (Till 2040) (USD Billion)
- Table 24.76. ADC Technology Market for First-Generation Technologies: Historical Trends (Since 2025) and Forecasted Estimates (Till 2040) (USD Billion)
- Table 24.77. ADC Technology Market: Distribution by Type of Conjugation
- Table 24.78. ADC Technology Market for Chemical Conjugation: Historical Trends (Since 2025) and Forecasted Estimates (Till 2040) (USD Billion)
- Table 24.79. ADC Technology Market for Chemoenzymatic Conjugation: Historical Trends (Since 2025) and Forecasted Estimates (Till 2040) (USD Billion)
- Table 24.80. ADC Technology Market for Enzymatic Conjugation: Historical Trends (Since 2025) and Forecasted Estimates (Till 2040) (USD Billion)
- Table 24.81. ADC Technology Market: Distribution by Type of Linker
- Table 24.82 ADC Technology Market for Cleavable Linkers: Historical Trends (Since 2025) and Forecasted Estimates (Till 2040) (USD Billion)
- Table 24.83 ADC Technology Market for Non-Cleavable Linkers: Historical Trends (Since 2025) and Forecasted Estimates (Till 2040) (USD Billion)
- Table 24.84 ADC Technology Market: Distribution by Geographical Regions
- Table 24.85 ADC Technology Market in North America: Historical Trends (Since 2025) and Forecasted Estimates (Till 2040) (USD Billion)
- Table 24.86 ADC Technology Market in Europe: Historical Trends (Since 2025) and Forecasted Estimates (Till 2040) (USD Billion)
- Table 24.87 ADC Technology Market in Asia-Pacific: Historical Trends (Since 2025) and Forecasted Estimates (Till 2040) (USD Billion)
- Table 24.88 ADC Technology Market in Latin America: Historical Trends (Since 2025) and Forecasted Estimates (Till 2040) (USD Billion)
- Table 24.89 ADC Technology Market in Middle East and North Africa: Historical Trends (Since 2025) and Forecasted Estimates (Till 2040) (USD Billion)
List of Figures
- Figure 2.1 Research Methodology: Project Methodology
- Figure 2.2 Research Methodology: Data Sources for Secondary Research
- Figure 2.3 Research Methodology: Robust Quality Control
- Figure 3.1 Market Dynamics: Forecast Methodology
- Figure 3.2 Market Dynamics: Market Assessment Framework
- Figure 4.1 Lessons Learnt from Past Recessions
- Figure 5.1 Executive Summary: Market Landscape
- Figure 5.2 Executive Summary: Market Trends
- Figure 5.3 Executive Summary: Market Sizing and Opportunity Analysis
- Figure 6.1 Components of ADCs
- Figure 6.2 Types of Linkers
- Figure 7.1 ADC Technologies: Distribution by Type of Technology
- Figure 7.2 ADC Technologies: Distribution by Availability of Licensing
- Figure 7.3 ADC Technologies: Distribution by Generation of Technology
- Figure 7.4 ADC Technologies: Distribution by Type of Conjugation
- Figure 7.5 ADC Technologies: Distribution by Site Specificity
- Figure 7.6 ADC Technologies: Distribution by Drug Antibody Ratio
- Figure 7.7 ADC Technologies: Distribution by Conjugation Chemistry
- Figure 7.8 ADC Technologies: Distribution by Conjugation Site
- Figure 7.9 ADC Technologies: Distribution by Type of Linker
- Figure 7.10 ADC Technology Providers: Distribution by Year of Establishment
- Figure 7.11 ADC Technology Providers: Distribution by Company Size
- Figure 7.12 ADC Technology Providers: Distribution by Location of Headquarters
- Figure 7.13 ADC Technology Providers: Distribution by Year of Establishment and Location of Headquarters
- Figure 8.1 Technology Competitiveness Analysis: Distribution of Technologies Offered by Players based in North America (Peer Group I)
- Figure 8.2 Technology Competitiveness Analysis: Distribution of Technologies Offered by Players based in Europe (Peer Group II)
- Figure 8.3 Technology Competitiveness Analysis: Distribution of Technologies Offered by Players based in Asia-Pacific (Peer Group III)
- Figure 9.1 Ajinomoto Bio-Pharma Services: Annual Revenues, FY 2021-H1 FY 2025 (JPY Billion)
- Figure 9.2 Novo Nordisk (parent company of Catalent Biologics): Annual Revenues, FY 2021-9M FY 2025 (DKK Billion)
- Figure 9.3 Mersana Therapeutics: Annual Revenues, FY 2021-9M FY 2025 (USD Million)
- Figure 9.4 Sutro Biopharma: Annual Revenues, FY 2021-9M FY 2025 (USD Million)
- Figure 9.5 Heidelberg Pharma: Annual Revenues, FY 2021- 9M FY 2025 (EUR Million)
- Figure 9.6 Boehringer Ingelheim (parent company of NBE Therapeutics): Annual Revenues, FY 2021-H1 FY 2025 (EUR Billion)
- Figure 9.7 Lonza (parent company of Synaffix): Annual Revenues, FY 2021-9M FY 2025 (CHF Billion)
- Figure 9.8 LigaChem Biosciences: Annual Revenues, FY 2021-9M FY 2025 (KRW Billion)
- Figure 10.1 Patent Analysis: Distribution by Type of Patent
- Figure 10.2 Patent Analysis: Cumulative Distribution by Publication Year, 2021-2025
- Figure 10.3 Patent Analysis: Cumulative Distribution by Application Year, Pre-2019-2025
- Figure 10.4 Patent Analysis: Distribution of Type of Patent by Publication Year, 2021-2025
- Figure 10.5 Patent Analysis: Distribution by Patent Jurisdiction
- Figure 10.6 Patent Analysis: Distribution by CPC Symbols
- Figure 10.7 Patent Analysis: Cumulative Year-wise Distribution by Type of Applicant
- Figure 10.9 Leading Industry Players: Distribution by Number of Patents
- Figure 10.10 Leading Patent Assignees: Distribution by Number of Patents
- Figure 10.11 Patent Benchmarking Analysis: Distribution of Patent Characteristics (CPC Codes) by Leading Industry Players
- Figure 10.12 Patent Benchmarking Analysis: Distribution of Leading Industry Players by Patent Characteristics (CPC Codes)
- Figure 10.13 Patent Analysis: Distribution by Patent Age
- Figure 10.14. ADC Technologies: Patent Valuation
- Figure 11.1 Partnerships and Collaborations: Cumulative year-wise Trend, 2021-2025 (till November)
- Figure 11.2 Partnerships and Collaborations: Distribution by Type of Partnership
- Figure 11.3 Partnerships and Collaborations: Distribution by Year of Partnership and Type of Partnership, 2021-2025 (till November)
- Figure 11.4 Most Active Players: Distribution by Number of Partnerships
- Figure 11.5 Most Popular Technologies: Distribution by Number of Partnerships
- Figure 11.6 Partnerships and Collaborations: Local and International Agreements
- Figure 11.7 Partnerships and Collaborations: Intercontinental and Intracontinental Agreements
- Figure 12.1 Business Models Analysis: Distribution by Purpose of Partnership
- Figure 12.2 Business Models Analysis: Distribution by Year and Purpose of Partnership, 2021-2025 (till November)
- Figure 12.3 Business Models Analysis: Distribution by Type of Business Model Adopted
- Figure 12.4 Business Models Analysis: Distribution by Deal Value
- Figure 12.5 Business Models Analysis: Distribution by Type of Business Model Adopted and Deal Value
- Figure 12.6 Most Active Players: Analysis by Number of Partnerships
- Figure 12.7 Lonza: Distribution by Purpose of Partnership
- Figure 12.8 Lonza: Distribution by Year of Partnership and Business Model Adopted
- Figure 12.9 LigaChem Biosciences: Distribution by Purpose of Partnership
- Figure 12.10 LigaChem Biosciences: Distribution by Year of Partnership and Business Model Adopted
- Figure 12.11 Debiopharm: Distribution by Purpose of Partnership
- Figure 12.12 Debiopharm: Distribution by Year of Partnership and Business Model Adopted
- Figure 12.13 Duality Biologics: Distribution by Year of Partnership and Business Model Adopted
- Figure 12.14 IntoCell: Distribution by Purpose of Partnership
- Figure 12.15 IntoCell: Distribution by Year of Partnership and Business Model Adopted
- Figure 14.1 Brand Positioning Analysis: Competitive Advantage
- Figure 14.2 Brand Positioning Matrix: Byondis
- Figure 14.3 Brand Positioning Matrix: Catalent Biologics
- Figure 14.4 Brand Positioning Matrix: Creative Biologics
- Figure 14.5 Brand Positioning Matrix: Duality Biologics
- Figure 14.6 Brand Positioning Matrix: GeneQuantum Healthcare
- Figure 14.7 Brand Positioning Matrix: Mersana Therapeutics
- Figure 14.8 Brand Positioning Matrix: OBI Pharma
- Figure 14.9 Brand Positioning Matrix: Synaffix
- Figure 14.10 Brand Positioning Matrix: Tubulis
- Figure 14.11 Brand Positioning Matrix: Zymeworks
- Figure 15.1 Antibody-Drug Conjugates: Distribution by Stage of Development
- Figure 15.2 Antibody-Drug Conjugates: Distribution by Target Indication
- Figure 15.3 Antibody-Drug Conjugates: Distribution by Therapeutic Area
- Figure 15.4 Antibody-Drug Conjugates: Distribution by Line of Treatment
- Figure 15.5 Antibody-Drug Conjugates: Distribution by Dosing Frequency
- Figure 15.6 Antibody-Drug Conjugates: Distribution by Type of Therapy
- Figure 15.7 Antibody-Drug Conjugates: Distribution by Target Antigen
- Figure 15.8 Antibody-Drug Conjugates: Distribution by Antibody Isotypes
- Figure 15.9 Antibody-Drug Conjugates: Distribution by Type of Linker (Cleavable/Non-Cleavable)
- Figure 15.10 Antibody-Drug Conjugates: Distribution by Payload / Cytotoxin / Warhead
- Figure 15.11 Antibody-Drug Conjugates: Distribution by Type of Payload
- Figure 15.12 Antibody-Drug Conjugate Developers: Distribution by Year of Establishment
- Figure 15.13 Antibody-Drug Conjugate Developers: Distribution by Company Size
- Figure 15.14 Antibody-Drug Conjugate Developers: Distribution by Location of Headquarters (Region)
- Figure 15.15 Antibody-Drug Conjugate Developers: Distribution by Location of Headquarters (Country)
- Figure 15.16 Most Active Players: Distribution by Number of Antibody-Drug Conjugates
- Figure 13.1 Licensing Agreements: Distribution of Financial Components
- Figure 17.1 Global ADC Technology Market, Historical Trends (Since 2025) and Forecasted Estimates (Till 2040): Base Scenario (USD Billion)
- Figure 17.2 Global ADC Technology Market, Historical Trends (Since 2025) and Forecasted Estimates (Till 2040): Conservative Scenario (USD Billion)
- Figure 17.3 Global ADC Technology Market, Historical Trends (Since 2025) and Forecasted Estimates (Till 2040): Optimistic Scenario (USD Billion)
- Figure 18.1 ADC Technology Market: Distribution by Generation of Technology
- Figure 18.2 ADC Technology Market for Next-Generation Technologies: Historical Trends (Since 2025) and Forecasted Estimates (Till 2040) (USD Billion)
- Figure 18.3 ADC Technology Market for Third-Generation Technologies: Historical Trends (Since 2025) and Forecasted Estimates (Till 2040) (USD Billion)
- Figure 18.4 ADC Technology Market for Second-Generation Technologies: Historical Trends (Since 2025) and Forecasted Estimates (Till 2040) (USD Billion)
- Figure 18.5 ADC Technology Market for First-Generation Technologies: Historical Trends (Since 2025) and Forecasted Estimates (Till 2040) (USD Billion)
- Figure 19.1 ADC Technology Market: Distribution by Type of Conjugation
- Figure 19.2 ADC Technology Market for Chemical Conjugation: Historical Trends (Since 2025) and Forecasted Estimates (Till 2040) (USD Billion)
- Figure 19.3 ADC Technology Market for Chemoenzymatic Conjugation: Historical Trends (Since 2025) and Forecasted Estimates (Till 2040) (USD Billion)
- Figure 19.4 ADC Technology Market for Enzymatic Conjugation: Historical Trends (Since 2025) and Forecasted Estimates (Till 2040) (USD Billion)
- Figure 20.1 ADC Technology Market: Distribution by Type of Linker
- Figure 20.2 ADC Technology Market for Cleavable Linkers: Historical Trends (Since 2025) and Forecasted Estimates (Till 2040) (USD Billion)
- Figure 20.3 ADC Technology Market for Non-Cleavable Linkers: Historical Trends (Since 2025) and Forecasted Estimates (Till 2040) (USD Billion)
- Figure 21.1 ADC Technology Market: Distribution by Geographical Regions
- Figure 21.2 ADC Technology Market in North America: Historical Trends (Since 2025) and Forecasted Estimates (Till 2040) (USD Billion)
- Figure 21.3 ADC Technology Market in Europe: Historical Trends (Since 2025) and Forecasted Estimates (Till 2040) (USD Billion)
- Figure 21.4 ADC Technology Market in Europe: Historical Trends (Since 2025) and Forecasted Estimates (Till 2040) (USD Billion)
- Figure 21.5 ADC Technology Market in Asia-Pacific: Historical Trends (Since 2025) and Forecasted Estimates (Till 2040) (USD Billion)
- Figure 21.6 ADC Technology Market in Latin America: Historical Trends (Since 2025) and Forecasted Estimates (Till 2040) (USD Billion)
- Figure 21.7 ADC Technology Market in Middle East and North Africa: Historical Trends (Since 2025) and Forecasted Estimates (Till 2040) (USD Billion)
- Figure 22.1 Conclusion: Market Landscape
- Figure 22.2 Conclusion: Market Trends
- Figure 22.3 Conclusion: Market Forecast and Opportunity Analysis

