
PUBLISHER: Roots Analysis | PRODUCT CODE: 2055606

PUBLISHER: Roots Analysis | PRODUCT CODE: 2055606
Cancer Biomarkers Market (3rd Edition) by Type of Biomarker, Type of Cancer and Geographical Regions - Trends and Forecasts Till 2035
Cancer Biomarkers Market: Overview
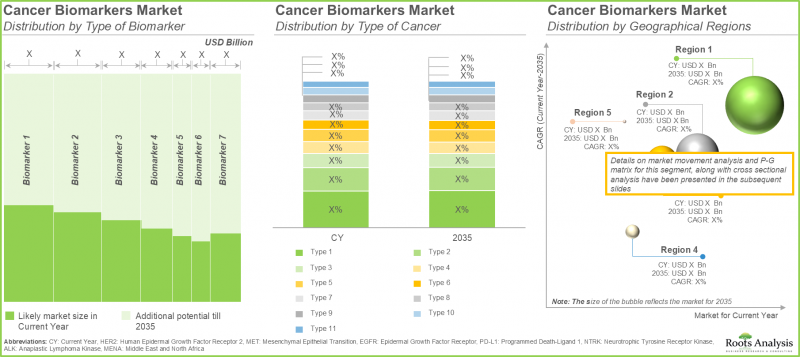
As per Roots Analysis, the global cancer biomarkers market is estimated to grow from USD 25.9 billion in the current year to USD 37.8 billion by 2035, at a CAGR of 4.3% during the forecast period, till 2035.
Cancer Biomarkers Market: Growth and Trends
Over the past two decades, researchers and biopharmaceutical companies have introduced several advanced and highly effective cancer treatment modalities, including targeted therapies, immunotherapies, and therapeutic cancer vaccines. Despite these advancements, oncology research continues to encounter significant challenges, including systemic treatment-related toxicities, high clinical trial attrition rates, and various pharmacological and therapy-specific limitations. These persistent challenges underscore the growing need for more precise and reliable diagnostic frameworks capable of improving patient outcomes while minimizing the economic impact associated with therapeutic failure.
To address this critical unmet need, the healthcare industry has increasingly adopted cancer biomarkers as a cornerstone of modern oncology diagnostics. The demand for such biomarkers is primarily driven by the molecular heterogeneity of cancer, wherein patients diagnosed with the same cancer type and disease stage often exhibit distinct molecular and genetic profiles, resulting in variable responses to recombinant drugs and biologic therapies. In response, pharmaceutical developers and healthcare providers have progressively shifted toward precision oncology approaches. Through the identification of disease-specific molecular signatures, clinicians are now able to customize treatment strategies for individual patients, moving beyond the conventional "one-size-fits-all" therapeutic model.
Although single-analyte biomarkers, such as PD-L1, BRAF, and EGFR, continue to play a foundational role in oncology diagnostics, their predictive capabilities are often limited in the context of complex genomic landscapes and long-term treatment efficacy. As a result, advancements in high-throughput technologies, particularly next-generation sequencing (NGS), have facilitated the development and validation of more comprehensive biomarkers, including tumor mutational burden (TMB) and microsatellite instability (MSI). These advanced biomarkers offer deeper understanding of genomic instability and tumor biology, enabling more precise patient stratification and treatment selection.
The expanding pipeline of clinically validated biomarkers remains a key driver of market growth. Supported by substantial investments from leading pharmaceutical and biotechnology companies in multi-omics and precision medicine initiatives, the cancer biomarkers market is positioned for significant expansion, with data-driven diagnostic integration expected to redefine the future standard of oncology care.
Growth Drivers: Strategic Enablers of Market Expansion
The growing global burden of cancer, driven by aging populations, changing lifestyles, and increasing exposure to environmental risk factors, continues to accelerate the demand for advanced oncology diagnostics and targeted treatment approaches. In response to this rising disease prevalence, the healthcare industry is witnessing a significant shift toward precision oncology and personalized medicine, wherein treatment decisions are increasingly guided by individual tumor biology and molecular profiling. This transition has been strongly supported by rapid technological advancements in next-generation sequencing (NGS), liquid biopsy platforms, multi-omics technologies, bioinformatics, and artificial intelligence-enabled diagnostics, all of which have streamlined biomarker discovery, validation, and clinical implementation.
These innovations enable clinicians to identify patient-specific molecular signatures, improving therapeutic selection, reducing treatment-related toxicities, and enhancing survival outcomes across multiple cancer indications. Further strengthening market expansion, leading pharmaceutical and biotechnology companies, including Roche and Novartis, are actively investing in biomarker-driven clinical trials and companion diagnostic development to support targeted immuno-oncology therapies. In parallel, increasing regulatory approvals for companion diagnostics and expanded indications for immunotherapies are reinforcing the market's upward trajectory, positioning cancer biomarkers as a critical component of next-generation oncology care.
Market Challenges: Critical Barriers Impeding Progress
Despite the strong growth potential of the cancer biomarkers market, several operational, technical, and regulatory challenges continue to hinder widespread adoption and commercialization. One of the primary barriers is the high cost and extended timeline associated with biomarker research and development, as companies are required to invest substantial capital in discovery, validation, and regulatory approval processes before achieving clinical adoption. These financial and operational demands often restrict market participation, particularly among small and mid-sized biotechnology firms, while simultaneously delaying the introduction of innovative diagnostic solutions. In addition, technical limitations associated with sample collection, handling, and storage remain a significant concern. Improper processing can result in biomarker degradation, contamination, and inconsistent test results, ultimately compromising diagnostic accuracy and reducing clinical confidence in biomarker-based assays.
The market also faces challenges associated with limited large-scale clinical validation and the absence of standardized data frameworks, as many emerging biomarkers are yet to demonstrate consistent clinical utility across diverse patient populations. Variability in assay methodologies, reporting standards, and data formats across laboratories further complicates data integration, comparative analyses, and routine implementation in oncology practice. Moreover, the evolving and region-specific regulatory landscape for biomarker-based diagnostics and companion tests, overseen by agencies such as the U.S. Food and Drug Administration and the European Medicines Agency, continues to create uncertainty for market participants. It increases compliance requirements, prolongs approval timelines, and raises overall commercialization costs.
Cancer Biomarkers Market: Key Insights
The report delves into the current state of the cancer biomarkers market and identifies potential growth opportunities within industry. Some key findings from the report include:
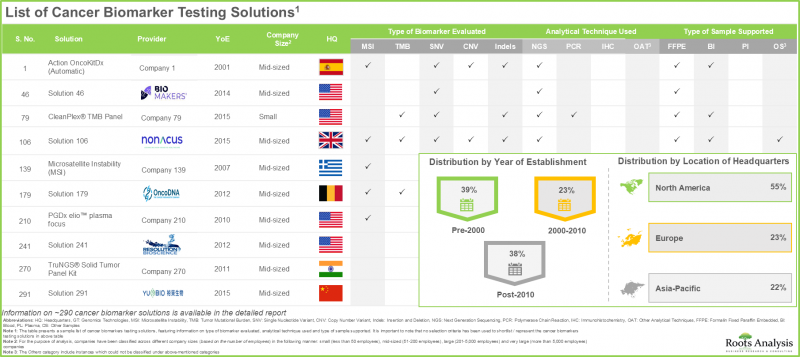
- Advancements in biotechnology have led to the identification of several cancer biomarker testing solutions, which are presently being used for a variety of purposes, including diagnosis, clinical research and to facilitate therapy-related decision-making.
- Currently, more than 290 biomarker solutions are available in the market; around 85% of these solutions use next generation sequencing for the assessment of cancer biomarkers.
- Majority (68%) of the cancer biomarker testing solutions assist in the evaluation of indels; 85% of the testing solutions utilize next generation sequencing (NGS) for the assessment of cancer biomarkers.
- Several industry and non-industry players are conducting biomarker-stratified clinical trials to develop new targeted therapies; most of the patients were enrolled across multiple sites in China.
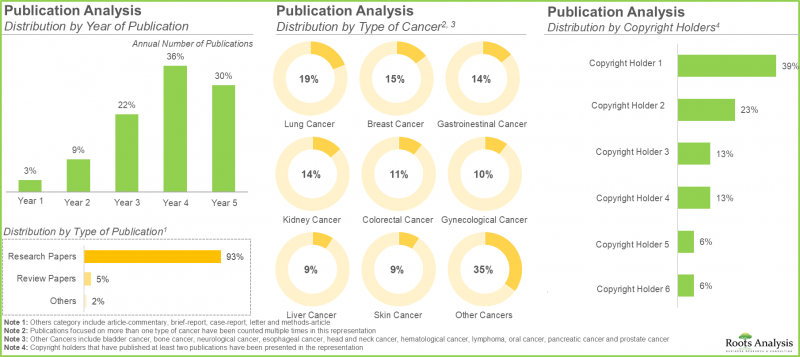
- The field of cancer biomarkers has seen a significant rise in research, with over 470 articles published by various researchers, underscoring the growing focus of several industry players and academic players in this domain.
- The cancer biomarkers market is expected to witness an annualized growth rate of 4.3% during the forecast period; notably, biomarker testing solutions for breast cancer are expected to capture the majority current market share.
- Driven by the growing adoption of personalized medicine in the US, the cancer biomarkers market is poised to grow at a higher CAGR during the forecast period.
- Given the rising prevalence of cancer, and the intensifying demand for precise, biomarker-driven diagnostics across clinical and research settings, the cancer biomarkers market is positioned for steady growth.
Cancer Biomarkers Market
The market sizing and opportunity analysis has been segmented across the following parameters:
By Type of Biomarker
- HER2
- MET
- EGFR
- PD-L1
- NTRK
- ALK
- Other Biomarkers
By Type of Cancer
- Breast Cancer
- Colorectum Cancer
- Lung Cancer
- Prostate Cancer
- Thyroid Cancer
- Bladder Cancer
- Melanoma
- Non-Hodgkin Lymphoma
- Endometrial Cancer
- Kidney Cancer
- Leukemia
By Geographical Regions
- North America
- Europe
- Asia-Pacific
- Latin America
- Middle East and North Africa
Cancer Biomarkers Market: Key Segments
Which Type of Biomarker Testing Accounts for the Largest Share in the Cancer Biomarkers Market?
In the current year, HER2 biomarker testing solutions are expected to account for the largest share (21.1%) of the cancer biomarkers market. This dominance is primarily attributed to the extensive clinical validation of HER2 testing in the diagnosis, prognosis, and therapeutic management of breast and gastric cancers. The segment's strong market position is further reinforced by its direct association with several high-value targeted therapies, including Trastuzumab and Pertuzumab, which continue to drive sustained global demand for HER2-based companion diagnostics.
In contrast, the EGFR biomarker testing segment is anticipated to witness comparatively faster growth during the forecast period. This growth is primarily driven by the increasing global prevalence of lung cancer, along with the rising adoption of precision oncology and targeted treatment approaches. In particular, the growing clinical utilization of EGFR inhibitors, such as Osimertinib, has significantly increased the demand for EGFR mutation testing to support patient stratification and treatment selection in non-small cell lung cancer (NSCLC).
Regional Analysis: Which Regions are Showing the Fastest Growth in the Cancer Biomarkers Testing Domain?
North America: Leading the Global Market
North America is expected to dominate the cancer biomarkers market, capturing 52.1% of the overall market revenue in the current year. The region's leadership position can be attributed to the rising burden of cancer, well-established healthcare infrastructure, and the increasing adoption of personalized medicine and precision oncology frameworks. In addition, strong investments in biomarker research, widespread availability of advanced diagnostic technologies, and favorable regulatory and reimbursement environments continue to support market growth across the region.
Which Type of Cancer Holds the Highest Share in the Market?
According to current market estimates, biomarker tests for breast cancer are projected to account for the largest share (25.1%) of the overall cancer biomarkers market revenue. This can be attributed to the high global prevalence of breast cancer as one of the leading causes of cancer-related mortality among women. As a result, there is significant demand for biomarker-driven diagnostics that support early detection, prognosis assessment, risk stratification, and personalized therapeutic interventions.
Looking ahead, the melanoma biomarker testing segment is anticipated to grow at a relatively faster pace, with a projected CAGR of 4.5% during the forecast period. This growth is primarily driven by the increasing global incidence of melanoma, continued advancements in targeted therapies, and the growing adoption of precision diagnostic approaches. In particular, the clinical uptake of BRAF and MEK inhibitors, alongside rising utilization of BRAF mutation testing and liquid biopsy-based biomarker assays, is expected to significantly contribute to segment expansion.
Example Players in Cancer Biomarkers Market
- ARUP Laboratories
- Asper Biogene
- BioReference
- Caris Life Sciences
- CeGaT
- Foundation Medicine
- Genekor Medical
- Guardant Health
- IQVIA Laborateries
- Labcorp
- MedGenome
- NeoGenomics Laboratories
- Nonacus
- OncoDNA
- Quest Diagnostics
- Oxford Gene Technology
- Personal Genome Diagnostics
- PhenoPath
- Positive Biosciences
- Tempus
- Thermo Fisher Scientific
- YuceBio
Primary Research Overview
The opinions and insights presented in this study were influenced by discussions conducted with multiple stakeholders. The research report features detailed transcripts of interviews held with the following industry stakeholders:
- Chief Technical Officer and Former Director of Preclinical Development & Strategic Partnerships, Small Company, US
- Business Manager, Mid-sized Company, Germany
- Former Chief Scientific Officer, Large Company, US
Cancer Biomarkers Market: Research Coverage
- Market Sizing and Opportunity Analysis: The report features an in-depth analysis of the cancer biomarkers market, focusing on key market segments, including [A] type of biomarker, [B] type of cancer and [C] geographical regions.
- Market Landscape: A comprehensive evaluation of testing solutions for novel cancer biomarkers, considering various parameters, such as [A] type of biomarker evaluated, [B] type of analytical technique used, [C] turnaround time, [D] type of sample supported, [E] type of nucleic acid tested, [F] type of cancer, [G] application area and [H] End-user. Additionally, it includes a detailed list of developers engaged in offering novel cancer biomarker testing solutions, along with analysis based on various parameters, such as [I] year of establishment, [J] company size (in terms of employee count) and [K] location of headquarters.
- Product Competitiveness Analysis: A comprehensive competitive analysis of novel cancer biomarker testing solutions, examining factors, such as product versatility and product competitiveness.
- Company Profiles: In-depth profiles of key industry players offering novel cancer biomarker testing solutions, focusing on [A] company overviews, [B] financial information, [C] cancer biomarker testing solutions portfolio, [D] recent developments and [E] an informed future outlook.
- Case Study: A general discussion on the innovative study designs involved in conducting biomarker-based clinical trial to evaluate drugs for oncological disorders. It includes details on the structure of each study design, highlighting their respective advantages and challenges.
- Clinical Trial Analysis: Examination of completed, ongoing, and planned clinical studies of various novel cancer biomarkers based on parameters like [A] trial registration year, [B] trial status, [C] trial phase, [D] enrolled patient population, [E] type of sponsor / collaborator, [F] most active players (in terms of number of registered trials), [G] study design, [H] target therapeutic area and [I] key geographical regions.
- Publication Analysis: A detailed publication analysis of over 630 articles that have been published highlighting the key focus areas of ongoing research related to novel cancer biomarkers. It highlights the prevalent trends based on the [A] year of publication, [B] type of publication, [C] type of cancer, [D] copyright holders, [E] emerging focus areas, [F] most active publishers (in terms of number of publications) and [G] key journals (in terms of journal impact factor and number of articles published).
- Big Pharma Analysis: A comprehensive examination of various initiatives focused on cancer biomarkers undertaken by major pharmaceutical companies. This analysis includes heat map visualizations that illustrate the distribution of leading pharmaceutical firms, as well as spider web diagrams that compare their initiatives across multiple relevant parameters.
- Case Study 1 - Analysis Of Value Chain in the Companion Diagnostics Industry: A comprehensive value chain analysis that explores the various stages involved in the production of companion diagnostics. This includes a discussion on research and development (R&D), clinical assessment of the product, manufacturing and assembly, payer negotiation and marketing activities and the cost distribution across each of the aforementioned stages.
- Case Study 2 - Future Growth Opportunities: A detailed discussion on the upcoming opportunities for cancer biomarker testing solution providers in this field that are likely to impact on the evolution of the market in the short to mid-term and mid to long-term.
- Market Impact Analysis: The report analyzes various factors such as drivers, restraints, opportunities, and challenges affecting the market growth.
Key Questions Answered in this Report
- Which are the leading companies in the cancer biomarkers market?
- Which region dominates the cancer biomarkers market?
- What are the key trends observed in the cancer biomarkers market?
- What factors are likely to influence the evolution of this market?
- What are the primary challenges faced by cancer biomarkers testing solution providers?
- What is the current and future market size?
- What is the CAGR of this market?
- How is the current and future market opportunity likely to be distributed across key market segments?
Reasons to Buy this Report
- The report provides a comprehensive market analysis, offering detailed revenue projections of the overall market and its specific sub-segments. This information is valuable to both established market leaders and emerging entrants.
- The report offers stakeholders a comprehensive overview of the market, including key drivers, barriers, opportunities, and challenges. This information empowers stakeholders to stay abreast of market trends and make data-driven decisions to capitalize on growth prospects.
- The report can aid businesses in identifying future opportunities in any sector. It also helps in understanding if those opportunities are worth pursuing.
- The report helps in identifying customer demand by understanding the needs, preferences, and behavior of the target audience in order to tailor products or services effectively.
- The report equips new entrants with requisite information regarding a particular market to help them build successful business strategies.
- The report allows for more effective communication with the audience and in building strong business relations.
Additional Benefits
- Complementary PPT Insights Pack
- Complementary Excel Data Packs for all Analytical Modules in the Report
- 15% Free Content Customization
- Detailed Report Walkthrough Session with Research Team
- Free Updated report if the report is 6-12 months old or older
TABLE OF CONTENTS
1. PREFACE
- 1.1. Introduction
- 1.2. Report Coverage
- 1.3. Market Segmentation
- 1.4. Key Market Insights
- 1.5. Market Share Insights
- 1.6. Key Questions Answered
2. RESEARCH METHODOLOGY
- 2.1. Chapter Overview
- 2.2. Research Assumptions
- 2.2.1. Market Landscape and Market Trends
- 2.2.2. Market Forecast and Opportunity Analysis
- 2.2.3. Comparative Analysis
- 2.3. Database Building
- 2.3.1. Data Collection
- 2.3.2. Data Validation
- 2.3.3. Data Analysis
- 2.4. Project Methodology
- 2.4.1. Secondary Research
- 2.4.1.1. Annual Reports
- 2.4.1.2. Academic Research Papers
- 2.4.1.3. Company Websites
- 2.4.1.4. Investor Presentations
- 2.4.1.5. Regulatory Filings
- 2.4.1.6. White Papers
- 2.4.1.7. Industry Publications
- 2.4.1.8. Conferences and Seminars
- 2.4.1.9. Government Portals
- 2.4.1.10. Media and Press Releases
- 2.4.1.11. Newsletters
- 2.4.1.12. Industry Databases
- 2.4.1.13. Roots Proprietary Databases
- 2.4.1.14. Paid Databases and Sources
- 2.4.1.15. Social Media Portals
- 2.4.1.16. Other Secondary Sources
- 2.4.2. Primary Research
- 2.4.2.1. Types of Primary Research
- 2.4.2.1.1. Qualitative Research
- 2.4.2.1.2. Quantitative Research
- 2.4.2.1.3. Hybrid Approach
- 2.4.2.2. Advantages of Primary
- 2.4.2.3. Techniques for Primary Research
- 2.4.2.3. Techniques for Primary Research
- 2.4.2.3.1. Interviews
- 2.4.2.3.2. Surveys
- 2.4.2.3.3. Focus Groups
- 2.4.2.3.4. Observational Research
- 2.4.2.3.5. Social Media Interactions
- 2.4.2.4. Key Opinion Leaders Considered in Primary Research
- 2.4.2.4.1. Company Executives (CXOs)
- 2.4.2.4.2. Board of Directors
- 2.4.2.4.3. Company Presidents and Vice Presidents
- 2.4.2.4.4. Research and Development Heads
- 2.4.2.4.5. Technical Experts
- 2.4.2.4.6. Subject Matter Experts
- 2.4.2.4.7. Scientists
- 2.4.2.4.8. Doctors and Other Healthcare Providers
- 2.4.2.5. Ethics and Integrity
- 2.4.2.5.1. Research Ethics
- 2.4.2.5.2. Data Integrity
- 2.4.2.1. Types of Primary Research
- 2.4.3. Analytical Tools and Databases
- 2.4.1. Secondary Research
- 2.5. Robust Quality Control
3. ECONOMIC AND OTHER PROJECT-SPECIFIC CONSIDERATIONS
- 3.1. Chapter Overview
- 3.2. Forecast Methodology
- 3.2.1. Top-down Approach
- 3.2.2. Bottom-up Approach
- 3.2.3. Hybrid Approach
- 3.3. Market Assessment Framework
- 3.3.1. Total Addressable Market (TAM)
- 3.3.2. Serviceable Addressable Market (SAM)
- 3.3.3. Serviceable Obtainable Market (SOM)
- 3.3.4. Currently Acquired Market (CAM)
- 3.4. Forecasting Tools and Techniques
- 3.4.1. Qualitative Forecasting
- 3.4.2. Correlation
- 3.4.3. Regression
- 3.4.4. Extrapolation
- 3.4.5. Convergence
- 3.4.6. Sensitivity Analysis
- 3.4.7. Scenario Planning
- 3.4.8. Data Visualization
- 3.4.9. Time Series Analysis
- 3.4.10. Forecast Error Analysis
- 3.5. Key Considerations
- 3.5.1. Demographics
- 3.5.2. Government Regulations
- 3.5.3. Reimbursement Scenarios
- 3.5.4. Market Access
- 3.5.5. Supply Chain
- 3.5.6. Industry Consolidation
- 3.5.7. Pandemic / Unforeseen Disruptions Impact
- 3.6. Limitations
4. MACRO-ECONOMIC INDICATORS
- 4.1. Chapter Overview
- 4.2. Market Dynamics
- 4.2.1. Time Period
- 4.2.1.1. Historical Trends
- 4.2.1.2. Current and Forecasted Estimates
- 4.2.2. Currency Coverage
- 4.2.2.1. Major Currencies Affecting the Market
- 4.2.2.2. Factors Affecting Currency Fluctuations
- 4.2.2.3. Impact of Currency Fluctuations on the Industry
- 4.2.3. Foreign Currency Exchange Rate
- 4.2.3.1. Impact of Foreign Exchange Rate Volatility on the Market
- 4.2.3.2. Strategies for Mitigating Foreign Exchange Risk
- 4.2.4. Recession
- 4.2.4.1. Assessment of Current Economic Conditions and Potential Impact on the Market
- 4.2.4.2. Historical Analysis of Past Recessions and Lessons Learnt
- 4.2.5. Inflation
- 4.2.5.1. Measurement and Analysis of Inflationary Pressures in the Economy
- 4.2.5.2. Potential Impact of Inflation on the Market Evolution
- 4.2.6. Interest Rates
- 4.2.6.1. Interest Rates and Their Impact on the Market
- 4.2.6.2. Strategies for Managing Interest Rate Risk
- 4.2.7. Commodity Flow Analysis
- 4.2.7.1. Type of Commodity
- 4.2.7.2. Origins and Destinations
- 4.2.7.3. Value and Weights
- 4.2.7.4. Modes of Transportation
- 4.2.8. Global Trade Dynamics
- 4.2.8.1. Import Scenario
- 4.2.8.2. Export Scenario
- 4.2.8.3. Trade Policies
- 4.2.8.4. Strategies for Mitigating the Risks Associated with Trade Barriers
- 4.2.8.5. Impact of Trade Barriers on the Market
- 4.2.9. War Impact Analysis
- 4.2.9.1. Russian-Ukraine War
- 4.2.9.2. Israel-Hamas War
- 4.2.10. COVID Impact / Related Factors
- 4.2.10.1. Global Economic Impact
- 4.2.10.2. Industry-specific Impact
- 4.2.10.3. Government Response and Stimulus Measures
- 4.2.10.4. Future Outlook and Adaptation Strategies
- 4.2.11. Other Indicators
- 4.2.11.1. Fiscal Policy
- 4.2.11.2. Consumer Spending
- 4.2.11.3. Gross Domestic Product (GDP)
- 4.2.11.4. Employment
- 4.2.11.5. Taxes
- 4.2.11.6. Stock Market Performance
- 4.2.11.7. Cross-Border Dynamics
- 4.2.1. Time Period
- 4.3. Conclusion
5. EXECUTIVE SUMMARY
- 5.1. Cancer Biomarker Testing Solutions: Market Landscape
- 5.2. Cancer Biomarker Testing Solutions: Market Trends
- 5.3. Cancer Biomarker Testing Solutions: Market Forecast and Opportunity Analysis
6. INTRODUCTION
- 6.1. Chapter Overview
- 6.2. An Overview of Cancer Biomarkers
- 6.2.1. Need for Cancer Biomarkers
- 6.2.2. Identification of a Candidate Biomarker
- 6.3. Type of Cancer Biomarkers
- 6.4. Novel Cancer Biomarkers
- 6.4.1. Tumor Mutation Burden (TMB)
- 6.4.1.1. Variation of TMB across Multiple Indications
- 6.4.1.2. Methods for Measurement of TMB
- 6.4.1.3. Factors Affecting Measurement of TMB
- 6.4.1.4. Initiatives for Assessment of TMB as a Potential Biomarker
- 6.4.2. Microsatellite Instability / Mismatch Repair Deficiency (MSI / MMR)
- 6.4.2.1. Variation of MSI across Multiple Indications
- 6.4.2.2. Methods for Measurement of MSI
- 6.4.3. Single Nucleotide Variants (SNVs)
- 6.4.3.1. Variation of SNV across Multiple Indications
- 6.4.3.2. Methods for Measurement of SNV
- 6.4.4. Copy Number Variants (CNVs)
- 6.4.4.1. Variation of CNV across Multiple Cancer Indications
- 6.4.4.2. Methods for Measurement of CNV
- 6.4.5. Indels and Other Novel Biomarkers
- 6.4.1. Tumor Mutation Burden (TMB)
- 6.5. Future Perspective
7. MARKET LANDSCAPE
- 7.1. Chapter Overview
- 7.2. Cancer Biomarker Testing Solutions: Overall Market Landscape
- 7.2.1. Analysis by Type of Biomarker Evaluated
- 7.2.2. Analysis by Type of Analytical Technique Used
- 7.2.3. Analysis by Turnaround Time
- 7.2.4. Analysis by Type of Sample Supported
- 7.2.5. Analysis by Type of Nucleic Acid Tested
- 7.2.6. Analysis by Type of Cancer
- 7.2.7. Analysis by Application Area
- 7.2.8. Analysis by End-user
- 7.3. Cancer Biomarkers Testing Solutions: Provider Landscape
- 7.3.1. Analysis by Year of Establishment
- 7.3.2. Analysis by Company Size
- 7.3.3. Analysis by Location of Headquarters
- 7.3.4. Most Active Player: Analysis by Number of Testing Solutions Offered
8. PRODUCT COMPETITIVENESS ANALYSIS
- 8.1. Chapter Overview
- 8.2. Assumptions / Key Parameters
- 8.3. Methodology
- 8.4. Overview of Peer Groups
- 8.5. Cancer Biomarkers Testing Solutions: Product Competitiveness Analysis
- 8.5.1. Cancer Biomarker Testing Solutions Offered by Providers Headquartered in North America
- 8.5.2. Cancer Biomarker Testing Solutions Offered by Providers Headquartered in Europe
- 8.5.3. Cancer Biomarker Testing Solutions Offered by Providers Headquartered in Asia-Pacific
9. COMPANY PROFILES: CANCER BIOMARKERS TESTING SOLUTION PROVIDERS
- 9.1. Chapter Overview
- 9.2. Agilent
- 9.2.1. Company Overview
- 9.2.2. Cancer Biomarker Testing Solutions Portfolio
- 9.3. ARUP Laboratories
- 9.3.1. Company Overview
- 9.3.2. Cancer Biomarker Testing Solutions Portfolio
- 9.4. Asper Biogene
- 9.4.1. Company Overview
- 9.4.2. Cancer Biomarker Testing Solutions Portfolio
- 9.5. BioReference
- 9.5.1. Company Overview
- 9.5.2. Cancer Biomarker Testing Solutions Portfolio
- 9.6. Caris Life Sciences
- 9.6.1. Company Overview
- 9.6.2. Cancer Biomarker Testing Solutions Portfolio
- 9.7. CeGaT
- 9.7.1. Company Overview
- 9.7.2. Cancer Biomarker Testing Solutions Portfolio
- 9.8. Foundation Medicine
- 9.8.1. Company Overview
- 9.8.2. Cancer Biomarker Testing Solutions Portfolio
- 9.9. Genekor Medical
- 9.9.1. Company Overview
- 9.9.2. Cancer Biomarker Testing Solutions Portfolio
- 9.10. Guardant Health
- 9.10.1. Company Overview
- 9.10.2. Cancer Biomarker Testing Solutions Portfolio
- 9.11. IQVIA Laboratories
- 9.11.1. Company Overview
- 9.11.2. Cancer Biomarker Testing Solutions Portfolio
- 9.12. Labcorp
- 9.12.1. Company Overview
- 9.12.2. Cancer Biomarker Testing Solutions Portfolio
- 9.13. MedGenome
- 9.13.1. Company Overview
- 9.13.2. Cancer Biomarker Testing Solutions Portfolio
- 9.14. NeoGenomics Laboratories
- 9.14.1. Company Overview
- 9.14.2. Cancer Biomarker Testing Solutions Portfolio
- 9.15. Nonacus
- 9.15.1. Company Overview
- 9.15.2. Cancer Biomarker Testing Solutions Portfolio
- 9.16. OncoDNA
- 9.16.1. Company Overview
- 9.16.2. Cancer Biomarker Testing Solutions Portfolio
- 9.17. Quest Diagnostics
- 9.17.1. Company Overview
- 9.17.2. Cancer Biomarker Testing Solutions Portfolio
- 9.19. Oxford Gene Technology
- 9.19.1. Company Overview
- 9.19.2. Cancer Biomarker Testing Solutions Portfolio
- 9.19. Personal Genome Diagnostics
- 9.19.1. Company Overview
- 9.19.2. Cancer Biomarker Testing Solutions Portfolio
- 9.20. PhenoPath
- 9.20.1. Company Overview
- 9.20.2. Cancer Biomarker Testing Solutions Portfolio
- 9.21. Positive Biosciences
- 9.21.1. Company Overview
- 9.21.2. Cancer Biomarker Testing Solutions Portfolio
- 9.22. Tempus AI
- 9.22.1. Company Overview
- 9.22.2. Cancer Biomarker Testing Solutions Portfolio
- 9.23. Thermo Fisher Scientific
- 9.23.1. Company Overview
- 9.23.2. Cancer Biomarker Testing Solutions Portfolio
- 9.24. YuceBio
- 9.24.1. Company Overview
- 9.24.2. Cancer Biomarker Testing Solutions Portfolio
10. INNOVATIVE STUDY DESIGNS FOR BIOMARKER-BASED CLINICAL TRIALS
- 10.1. Chapter Overview
- 10.2. Study Designs for Biomarker-based Clinical Trials
- 10.2.1. Enrichment Design
- 10.2.2. All-comers Design
- 10.2.3. Mixture / Hybrid Design
- 10.2.4. Adaptive Design
- 10.3. Regulatory Guidelines for Biomarker-based Clinical Trial Designs
- 10.4. Conclusion
11. CLINICAL TRIAL ANALYSIS
- 11.1. Chapter Overview
- 11.2. Scope and Methodology
- 11.3. Cancer Biomarkers: Clinical Trial Analysis
- 11.3.1. Analysis by Trial Registration Year
- 11.3.2. Analysis of Patients Enrolled by Trial Registration Year
- 11.3.3. Analysis by Trial Status
- 11.3.4. Analysis by Trial Registration Year and Trial Status
- 11.3.5. Analysis by Trial Phase
- 11.3.6. Analysis of Enrolled Patient Population by Trial Phase
- 11.3.7. Analysis by Patient Gender
- 11.3.8. Analysis by Study Design
- 11.3.8.1. Analysis by Type of Allocation
- 11.3.8.2. Analysis by Type of Intervention Model
- 11.3.8.3. Analysis by Type of Masking
- 11.3.8.4. Analysis by Type of Primary Purpose
- 11.3.9. Analysis by Type of Sponsor / Collaborator
- 11.3.10. Most Active Industry Player: Analysis by Number of Registered Trials
- 11.3.11. Most Active Non-Industry Player: Analysis by Number of Registered Trials
- 11.3.12. Analysis of Clinical Trials by Geography
- 11.3.13. Analysis of Clinical Trials by Trial Status and Geography
- 11.3.14. Analysis of Patients Enrolled by Trial Status and Geography
12. PUBLICATION ANALYSIS
- 12.1. Chapter Overview
- 12.2. Scope and Methodology
- 12.3. Cancer Biomarkers: Publication Analysis
- 12.3.1. Analysis by Year of Publication
- 12.3.2. Analysis by Type of Publication
- 12.3.3. Analysis by Type of Cancer
- 12.3.4. Analysis by Copyright Holders
- 12.3.5. Word Cloud: Emerging Focus Areas
- 12.3.6. Most Active Publishers: Analysis by Number of Publications
- 12.3.7. Key Journals: Analysis by Impact Factor
- 12.3.8. Key Journals: Analysis by Number of Publications
13. BIG PHARMA PLAYERS: BENCHMARK ANALYSIS
- 13.1. Chapter Overview
- 13.2. Scope and Methodology
- 13.3. Big Pharma Players: Benchmarking Analysis
- 13.3.1. Spider Web Analysis: Abbott
- 13.3.2. Spider Web Analysis: AbbVie
- 13.3.3. Spider Web Analysis: Amgen
- 13.3.4. Spider Web Analysis: AstraZeneca
- 13.3.5. Spider Web Analysis: Bayer
- 13.3.6. Spider Web Analysis: Boehringer Ingelheim
- 13.3.7. Spider Web Analysis: Bristol-Myers Squib
- 13.3.8. Spider Web Analysis: Eli Lilly
- 13.3.9. Spider Web Analysis: Gilead
- 13.3.10. Spider Web Analysis: GlaxoSmithKline
- 13.3.11. Spider Web Analysis: Merck
- 13.3.12. Spider Web Analysis: Novartis
- 13.3.13. Spider Web Analysis: Pfizer
- 13.3.14. Spider Web Analysis: Roche
- 13.3.15. Spider Web Analysis: Sanofi
- 13.4. Concluding Remarks
14. CASE STUDY: ANALYSIS OF VALUE CHAIN IN THE COMPANION DIAGNOSTICS INDUSTRY
- 14.1. Chapter Overview
- 14.2. Companion Diagnostics: Value Chain
- 14.3. Cost Distribution Across the Value Chain
- 14.3.1. Costs Associated with Research and Product Development
- 14.3.2. Costs Associated with Manufacturing and Assembly
- 14.3.3. Costs Associated with Clinical Trials, FDA Approval and Other Administrative Tasks
- 14.3.4. Costs Associated with Payer Negotiation and KOL Engagement
- 14.3.5. Costs Associated with Marketing and Sales
15. CASE STUDY: FUTURE GROWTH OPPORTUNITIES IN CANCER BIOMARKERS INDUSTRY
- 15.1. Chapter Overview
- 15.1.1. Growing Focus on Personalized Medicines
- 15.1.2. Rising need for Biomarker Testing for Various Oncological Disorders
- 15.1.3. Increase in Number of Biomarker-based Clinical Trials
- 15.1.4. Increased Adoption of Emerging Analytical Techniques for Biomarker Assessment
- 15.1.5. Development of Companion Diagnostic Products
- 15.2. Conclusion
16. GLOBAL CANCER BIOMARKERS MARKET
- 16.1. Chapter Overview
- 16.2. Assumptions and Methodology
- 16.3. Global Cancer Biomarkers Market, Historical Trends (since 2021) and Forecasted Estimates (till 2035)
- 16.3.1. Scenario Analysis
- 16.3.1.1. Conservative Scenario
- 16.3.1.2. Optimistic Scenario
- 16.3.1. Scenario Analysis
- 16.4. Key Market Segmentations
17. CANCER BIOMARKERS MARKET, BY TYPE OF BIOMARKER
- 17.1. Chapter Overview
- 17.2. Key Assumptions and Methodology
- 17.3. Cancer Biomarkers Market: Distribution by Type of Biomarker
- 17.3.1. Cancer Biomarkers Market for HER2 Biomarkers: Historical Trends (since 2021) and Forecasted Estimates (till 2035)
- 17.3.2. Cancer Biomarkers Market for MET Biomarkers: Historical Trends (since 2021) and Forecasted Estimates (till 2035)
- 17.3.3. Cancer Biomarkers Market for EGFR Biomarkers: Historical Trends (since 2021) and Forecasted Estimates (till 2035)
- 17.3.4. Cancer Biomarkers Market for PD-L1 Biomarkers: Historical Trends (since 2021) and Forecasted Estimates (till 2035)
- 17.3.5. Cancer Biomarkers Market for NTRK Biomarkers: Historical Trends (since 2021) and Forecasted Estimates (till 2035)
- 17.3.6. Cancer Biomarkers Market for ALK Biomarkers: Historical Trends (since 2021) and Forecasted Estimates (till 2035)
- 17.3.7. Cancer Biomarkers Market for Other Biomarkers: Historical Trends (since 2021) and Forecasted Estimates (till 2035)
- 17.4. Cancer Biomarkers Market: Distribution of Novel Biomarkers
- 17.4.1. Cancer Biomarkers Market for SNV Biomarkers: Historical Trends (since 2021) and Forecasted Estimates (till 2035)
- 17.4.2. Cancer Biomarkers Market for MSI Biomarkers: Historical Trends (since 2021) and Forecasted Estimates (till 2035)
- 17.4.3. Cancer Biomarkers Market for CNV Biomarkers: Historical Trends (since 2021) and Forecasted Estimates (till 2035)
- 17.4.4. Cancer Biomarkers Market for TMB Biomarkers: Historical Trends (since 2021) and Forecasted Estimates (till 2035)
- 17.4.5. Cancer Biomarkers Market for TIL Biomarkers: Historical Trends (since 2021) and Forecasted Estimates (till 2035)
- 17.4.6. Cancer Biomarkers Market for Indel Biomarkers: Historical Trends (since 2021) and Forecasted Estimates (till 2035)
- 17.5. Data Triangulation and Validation
18. CANCER BIOMARKERS MARKET, BY TYPE OF CANCER
- 18.1. Chapter Overview
- 18.2. Key Assumptions and Methodology
- 18.3. Cancer Biomarkers Market: Distribution by Type of Cancer
- 18.3.1. Cancer Biomarkers Market for Breast Cancer: Historical Trends (since 2021) and Forecasted Estimates (till 2035)
- 18.3.2. Cancer Biomarkers Market for Colorectum Cancer: Historical Trends (since 2021) and Forecasted Estimates (till 2035)
- 18.3.3. Cancer Biomarkers Market for Lung Cancer: Historical Trends (since 2021) and Forecasted Estimates (till 2035)
- 18.3.4. Cancer Biomarkers Market for Prostate Cancer: Historical Trends (since 2021) and Forecasted Estimates (till 2035)
- 18.3.5. Cancer Biomarkers Market for Thyroid Cancer: Historical Trends (since 2021) and Forecasted Estimates (till 2035)
- 18.3.6. Cancer Biomarkers Market for Bladder Cancer: Historical Trends (since 2021) and Forecasted Estimates (till 2035)
- 18.3.7. Cancer Biomarkers Market for Melanoma: Historical Trends (since 2021) and Forecasted Estimates (till 2035)
- 18.3.8. Cancer Biomarkers Market for Non-Hodgkin Lymphoma: Historical Trends (since 2021) and Forecasted Estimates (till 2035)
- 18.3.9. Cancer Biomarkers Market for Endometrial Cancer: Historical Trends (since 2021) and Forecasted Estimates (till 2035)
- 18.3.10. Cancer Biomarkers Market for Kidney Cancer: Historical Trends (since 2021) and Forecasted Estimates (till 2035)
- 18.3.11. Cancer Biomarkers Market for Leukemia: Historical Trends (since 2021) and Forecasted Estimates (till 2035)
- 18.4. Data Triangulation and Validation
19. CANCER BIOMARKERS MARKET, BY GEOGRAPHICAL REGIONS
- 19.1. Chapter Overview
- 19.2. Key Assumptions and Methodology
- 19.3. Cancer Biomarkers Market: Distribution by Geographical Regions
- 19.3.1. Cancer Biomarkers Market in North America: Historical Trends (since 2021) and Forecasted Estimates (till 2035)
- 19.3.1.1. North America Cancer Biomarkers Market in the US: Historical Trends (since 2021) and Forecasted Estimates (till 2035)
- 19.3.1.2. North America Cancer Biomarkers Market in Canada: Historical Trends (since 2021) and Forecasted Estimates (till 2035)
- 19.3.2. Cancer Biomarkers Market in Europe: Historical Trends (since 2021) and Forecasted Estimates (till 2035)
- 19.3.2.1. Europe Cancer Biomarkers Market in Germany: Historical Trends (since 2021) and Forecasted Estimates (till 2035)
- 19.3.2.2. Europe Cancer Biomarkers Market in France: Historical Trends (since 2021) and Forecasted Estimates (till 2035)
- 19.3.2.3. Europe Cancer Biomarkers Market in the UK: Historical Trends (since 2021) and Forecasted Estimates (till 2035)
- 19.3.2.4. Europe Cancer Biomarkers Market in Italy: Historical Trends (since 2021) and Forecasted Estimates (till 2035)
- 19.3.2.5. Europe Cancer Biomarkers Market in Spain: Historical Trends (since 2021) and Forecasted Estimates (till 2035)
- 19.3.3. Cancer Biomarkers Market in Asia-Pacific: Historical Trends (since 2021) and Forecasted Estimates (till 2035)
- 19.3.3.1. Asia-Pacific Cancer Biomarkers Market in China: Historical Trends (since 2021) and Forecasted Estimates (till 2035)
- 19.3.3.2. Asia-Pacific Cancer Biomarkers Market in Japan: Historical Trends (since 2021) and Forecasted Estimates (till 2035)
- 19.3.3.3. Asia-Pacific Cancer Biomarkers Market in India: Historical Trends (since 2021) and Forecasted Estimates (till 2035)
- 19.3.3.4. Asia-Pacific Cancer Biomarkers Market in South Korea: Historical Trends (since 2021) and Forecasted Estimates (till 2035)
- 19.3.3.5. Asia-Pacific Cancer Biomarkers Market in Australia: Historical Trends (since 2021) and Forecasted Estimates (till 2035)
- 19.3.3.6. Asia-Pacific Cancer Biomarkers Market in New Zealand: Historical Trends (since 2021) and Forecasted Estimates (till 2035)
- 19.3.4. Cancer Biomarkers Market in Latin America: Historical Trends (since 2021) and Forecasted Estimates (till 2035)
- 19.3.4.1. Latin America Cancer Biomarkers Market in Brazil: Historical Trends (since 2021) and Forecasted Estimates (till 2035)
- 19.3.4.2. Latin America Cancer Biomarkers Market in Argentina: Historical Trends (since 2021) and Forecasted Estimates (till 2035)
- 19.3.4.3. Latin America Cancer Biomarkers Market in Chile: Historical Trends (since 2021) and Forecasted Estimates (till 2035)
- 19.3.5. Cancer Biomarkers Market in Middle East and North Africa: Historical Trends (since 2021) and Forecasted Estimates (till 2035)
- 19.3.5.1. Middle East and North Africa Cancer Biomarkers Market in Egypt: Historical Trends (since 2021) and Forecasted Estimates (till 2035)
- 19.3.1. Cancer Biomarkers Market in North America: Historical Trends (since 2021) and Forecasted Estimates (till 2035)
- 19.4. Market Dynamics Assessment
- 19.4.1. Penetration Growth (P-G) Matrix
- 19.4.2. Market Movement Analysis
- 19.5. Data Triangulation and Validation
- *Detailed information on cross sectional analysis is available in the Excel Data Packs shared along with the report**
20. CONCLUDING REMARKS
21. EXECUTIVE INSIGHTS
- 21.1. Chapter Overview
- 21.2. Company A
- 21.2.1. Company Snapshot
- 21.2.2. Interview Transcript: Chief Technical Officer and Former Director of Preclinical Development & Strategic Partnerships
- 21.3. Company B
- 21.3.1. Company Snapshot
- 21.3.2. Interview Transcript: Former Chief Scientific Officer
- 21.4. Company C
- 21.4.1. Company Snapshot
- 21.4.2. Interview Transcript: Business Manager
22. APPENDIX 1: TABULATED DATA
23. APPENDIX 2: LIST OF COMPANIES AND ORGANIZATIONS
List of Tables
- Table 7.1 Cancer Biomarkers Testing Solutions: Information on Type of Biomarker evaluated
- Table 7.2 Cancer Biomarkers Testing Solutions: Information on Analytical Technique used
- Table 7.3 Cancer Biomarkers Testing Solutions: Information on Turnaround Time, Type of Sample Supported and Type of Nucleic Acid Tested
- Table 7.4 Cancer Biomarkers Testing Solutions: Information on Type of Cancer
- Table 7.5 Cancer Biomarkers Testing Solutions: Information on Application Area and End-user
- Table 6.6 List of Cancer Biomarker Testing Solution Providers
- Table 9.1 Cancer Biomarkers Testing Solution Providers: List of Companies Profiled
- Table 9.2 Agilent: Company Overview
- Table 9.3 Agilent: Cancer Biomarkers Testing Solutions Portfolio
- Table 9.4 ARUP Laboratories: Company Overview
- Table 9.5 ARUP Laboratories: Cancer Biomarker Testing Solutions Portfolio
- Table 9.6 Asper Biogene: Company Overview
- Table 9.7 Asper Biogene: Cancer Biomarkers Testing Solutions Portfolio
- Table 9.8 BioReference: Company Overview
- Table 9.9 BioReference: Cancer Biomarker Testing Solutions Portfolio
- Table 9.10 Caris Life Sciences: Company Overview
- Table 9.11 Caris Life Sciences: Cancer Biomarkers Testing Solutions Portfolio
- Table 9.12 CeGaT: Company Overview
- Table 9.13 CeGaT: Cancer Biomarkers Testing Solutions Portfolio
- Table 9.14 Foundation Medicine: Company Overview
- Table 9.15 Foundation Medicine: Cancer Biomarker Testing Solutions Portfolio
- Table 9.16 Genekor Medical: Company Overview
- Table 9.17 Genekor Medical: Cancer Biomarkers Testing Solutions Portfolio
- Table 9.18 Guardant Health: Company Overview
- Table 9.19 Guardant Health: Cancer Biomarkers Testing Solutions Portfolio
- Table 9.20 IQVIA Laboratories: Company Overview
- Table 9.21 IQVIA Laboratories: Cancer Biomarkers Testing Solutions Portfolio
- Table 9.22 Labcorp: Company Overview
- Table 9.23 Labcorp: Cancer Biomarkers Testing Solutions Portfolio
- Table 9.24 MedGenome: Company Overview
- Table 9.25 MedGenome: Cancer Biomarkers Testing Solutions Portfolio
- Table 9.26 NeoGenomics Laboratories: Company Overview
- Table 9.27 NeoGenomics Laboratories: Cancer Biomarkers Testing Solutions Portfolio
- Table 9.28 Nonacus: Company Overview
- Table 9.29 Nonacus: Cancer Biomarkers Testing Solutions Portfolio
- Table 9.30 OncoDNA: Company Overview
- Table 9.31 OncoDNA: Cancer Biomarker Testing Solutions Portfolio
- Table 9.32 Quest Diagnostics: Company Overview
- Table 9.33 Quest Diagnostics: Cancer Biomarker Testing Solutions Portfolio
- Table 9.34 Oxford Gene Technology: Company Overview
- Table 9.35 Oxford Gene Technology: Cancer Biomarkers Testing Solutions Portfolio
- Table 9.36 Personal Genome Diagnostics: Company Overview
- Table 9.37 Personal Genome Diagnostics: Cancer Biomarkers Testing Solutions Portfolio
- Table 9.38 PhenoPath: Company Overview
- Table 9.39 PhenoPath: Cancer Biomarkers Testing Solutions Portfolio
- Table 9.40 Positive Biosciences: Company Overview
- Table 9.41 Positive Biosciences: Cancer Biomarkers Testing Solutions Portfolio
- Table 9.42 Tempus AI: Company Overview
- Table 9.43 Tempus AI: Cancer Biomarkers Testing Solutions Portfolio
- Table 9.44 Thermo Fisher Scientific: Company Overview
- Table 9.45 Thermo Fisher Scientific: Cancer Biomarker Testing Solutions Portfolio
- Table 9.46 YuceBio: Company Overview
- Table 9.47 YuceBio: Cancer Biomarker Testing Solutions Portfolio
- Table 21.1 Cell IDx: Company Snapshot
- Table 21.2 NeoGenomics Laboratories: Company Snapshot
- Table 21.3 CeGat: Company Snapshot
- Table 22.1 Cancer Biomarker Testing Solutions: Distribution by Type of Biomarker Evaluated
- Table 22.2 Cancer Biomarker Testing Solutions: Distribution by Analytical Technique Used
- Table 22.3 Cancer Biomarker Testing Solutions: Distribution by Turnaround Time
- Table 22.4 Cancer Biomarker Testing Solutions: Distribution by Type of Sample Supported
- Table 22.5 Cancer Biomarker Testing Solutions: Distribution by Type of Nucleic Acid Tested
- Table 22.6 Cancer Biomarker Testing Solutions: Distribution by Type of Cancer
- Table 22.7 Cancer Biomarker Testing Solutions: Distribution by Application Area
- Table 22.8 Cancer Biomarker Testing Solutions: Distribution by End-user
- Table 22.9 Cancer Biomarker Testing Solution Providers: Distribution by Year of Establishment
- Table 22.10 Cancer Biomarker Testing Solution Providers: Distribution by Company Size
- Table 22.11 Cancer Biomarker Testing Solution Providers: Distribution by Location of Headquarters (Region)
- Table 22.11 Cancer Biomarker Testing Solution Providers: Distribution by Most Active Players
- Table 22.13 Clinical Trial Analysis: Distribution by Trial Registration Year, 2022-2025
- Table 22.14 Clinical Trial Analysis: Distribution of Patients Enrolled by Trial Registration Year, 2022-2025
- Table 22.15 Clinical Trial Analysis: Distribution by Trial Status
- Table 22.16 Clinical Trial Analysis: Distribution by Trial Registration Year and Trial Status
- Table 22.17 Clinical Trial Analysis: Distribution by Trial Phase
- Table 22.18 Clinical Trial Analysis: Distribution of Enrolled Patient Population by Trial Phase
- Table 22.19 Clinical Trial Analysis: Distribution by Patient Gender
- Table 22.20 Clinical Trial Analysis: Distribution by Study Design
- Table 22.21 Clinical Trial Analysis: Distribution by Type of Sponsor / Collaborator
- Table 22.22 Most Active Industry Players: Distribution by Number of Registered Trials
- Table 22.23 Most Active Non-Industry Players: Distribution by Number of Registered Trials
- Table 22.24 Clinical Trial Analysis: Distribution of Clinical Trials by Geography
- Table 22.25 Clinical Trial Analysis: Distribution of Clinical Trials by Trial Status and Geography
- Table 22.26 Clinical Trial Analysis: Distribution of Patients Enrolled by Trial Status and Geography
- Table 22.27 Publication Analysis: Cumulative Year-wise Trend of Publications, 2019-2023
- Table 22.28 Publication Analysis: Distribution by Type of Publication
- Table 22.29 Publication Analysis: Distribution by Type of Cancer
- Table 22.30 Copyright Holders: Distribution by Number of Publications
- Table 22.31 Most Active Publishers: Distribution by Number of Publications
- Table 22.32 Key Journals: Distribution by Impact Factor
- Table 22.33 Key Journals: Distribution by Number of Publications
- Table 22.34 Benchmarking Analysis: Big Pharma players
- Table 22.35 Global Cancer Biomarkers Market: Since 2021, Till 2035 (USD Billion) Conservative, Base and Optimistic
- Table 22.36 Cancer Biomarkers Market: Distribution by Type of Biomarker
- Table 22.37 Cancer Biomarkers Market for HER2 Biomarkers: Historical Trends (since 2021) and Forecasted Estimates (till 2035)
- Table 22.38 Cancer Biomarkers Market for MET Biomarkers: Historical Trends (since 2021) and Forecasted Estimates (till 2035)
- Table 22.39 Cancer Biomarkers Market for EGFR Biomarkers: Historical Trends (since 2021) and Forecasted Estimates (till 2035)
- Table 22.40 Cancer Biomarkers Market for PD-L1 Biomarkers: Historical Trends (since 2021) and Forecasted Estimates (till 2035)
- Table 22.41 Cancer Biomarkers Market for NTRK Biomarkers: Historical Trends (since 2021) and Forecasted Estimates (till 2035)
- Table 22.42 Cancer Biomarkers Market for ALK Biomarkers: Historical Trends (since 2021) and Forecasted Estimates (till 2035)
- Table 22.43 Cancer Biomarkers Market for Other Biomarkers: Historical Trends (since 2021) and Forecasted Estimates (till 2035)
- Table 22.44 Cancer Biomarkers Market: Distribution of Novel Biomarker
- Table 22.45 Cancer Biomarkers Market for SNV Biomarkers: Historical Trends (since 2021) and Forecasted Estimates (till 2035)
- Table 22.46 Cancer Biomarkers Market for CNV Biomarkers: Historical Trends (since 2021) and Forecasted Estimates (till 2035)
- Table 22.47 Cancer Biomarkers Market for Indel Biomarkers: Historical Trends (since 2021) and Forecasted Estimates (till 2035)
- Table 22.48 Cancer Biomarkers Market for TIL Biomarkers: Historical Trends (since 2021) and Forecasted Estimates (till 2035)
- Table 22.49 Cancer Biomarkers Market for MSI Biomarkers: Historical Trends (since 2021) and Forecasted Estimates (till 2035)
- Table 22.50 Cancer Biomarkers Market for TMB Biomarkers: Historical Trends (since 2021) and Forecasted Estimates (till 2035)
- Table 22.51 Cancer Biomarkers Market: Distribution by Type of Cancer
- Table 22.52 Cancer Biomarkers Market for Breast Cancer: Historical Trends (since 2021) and Forecasted Estimates (till 2035)
- Table 22.53 Cancer Biomarkers Market for Colorectum Cancer: Historical Trends (since 2021) and Forecasted Estimates (till 2035)
- Table 22.54 Cancer Biomarkers Market for Lung Cancer: Historical Trends (since 2021) and Forecasted Estimates (till 2035)
- Table 22.55 Cancer Biomarkers Market for Prostate Cancer: Historical Trends (since 2021) and Forecasted Estimates (till 2035)
- Table 22.56 Cancer Biomarkers Market for Thyroid Cancer: Historical Trends (since 2021) and Forecasted Estimates (till 2035)
- Table 22.57 Cancer Biomarkers Market for Bladder Cancer: Historical Trends (since 2021) and Forecasted Estimates (till 2035)
- Table 22.58 Cancer Biomarkers Market for Melanoma: Historical Trends (since 2021) and Forecasted Estimates (till 2035)
- Table 22.59 Cancer Biomarkers Market for Non-Hodgkin Lymphoma: Historical Trends (since 2021) and Forecasted Estimates (till 2035)
- Table 22.60 Cancer Biomarkers Market for Endometrial Cancer: Historical Trends (since 2021) and Forecasted Estimates (till 2035)
- Table 22.61 Cancer Biomarkers Market for Kidney Cancer: Historical Trends (since 2021) and Forecasted Estimates (till 2035)
- Table 22.62 Cancer Biomarkers Market for Leukemia: Historical Trends (since 2021) and Forecasted Estimates (till 2035)
- Table 22.63 Cancer Biomarkers Market: Distribution by Key Geographical Regions
- Table 22.64 Cancer Biomarkers Market in North America: Historical Trends (since 2021) and Forecasted Estimates (till 2035)
- Table 22.65 North America Cancer Biomarkers Market in the US: Historical Trends (since 2021) and Forecasted Estimates (till 2035)
- Table 22.66 North America Cancer Biomarkers Market in Canada: Historical Trends (since 2021) and Forecasted Estimates (till 2035)
- Table 22.67 Cancer Biomarkers Market in Europe: Historical Trends (since 2021) and Forecasted Estimates (till 2035)
- Table 22.68 Europe Cancer Biomarkers Market in Germany: Historical Trends (since 2021) and Forecasted Estimates (till 2035)
- Table 22.69 Europe Cancer Biomarkers Market in France: Historical Trends (since 2021) and Forecasted Estimates (till 2035)
- Table 22.70 Europe Cancer Biomarkers Market in the UK: Historical Trends (since 2021) and Forecasted Estimates (till 2035)
- Table 22.71 Europe Cancer Biomarkers Market in Italy: Historical Trends (since 2021) and Forecasted Estimates (till 2035)
- Table 22.72 Europe Cancer Biomarkers Market in Spain: Historical Trends (since 2021) and Forecasted Estimates (till 2035)
- Table 22.73 Cancer Biomarkers Market in Asia-Pacific: Historical Trends (since 2021) and Forecasted Estimates (till 2035)
- Table 22.74 Asia-Pacific Cancer Biomarkers Market in China: Historical Trends (since 2021) and Forecasted Estimates (till 2035)
- Table 22.75 Asia-Pacific Cancer Biomarkers Market in Japan: Historical Trends (since 2021) and Forecasted Estimates (till 2035)
- Table 22.76 Asia-Pacific Cancer Biomarkers Market in India: Historical Trends (since 2021) and Forecasted Estimates (till 2035)
- Table 22.77 Asia-Pacific Cancer Biomarkers Market in South Korea: Historical Trends (since 2021) and Forecasted Estimates (till 2035)
- Table 22.78 Asia-Pacific Cancer Biomarkers Market in Australia: Historical Trends (since 2021) and Forecasted Estimates (till 2035)
- Table 22.79 Asia-Pacific Cancer Biomarkers Market in New Zealand: Historical Trends (since 2021) and Forecasted Estimates (till 2035)
- Table 22.80 Cancer Biomarkers Market in Latin America: Historical Trends (since 2021) and Forecasted Estimates (till 2035)
- Table 22.81 Latin America Cancer Biomarkers Market in Brazil: Historical Trends (since 2021) and Forecasted Estimates (till 2035)
- Table 22.82 Latin America Cancer Biomarkers Market in Argentina: Historical Trends (since 2021) and Forecasted Estimates (till 2035)
- Table 22.83 Latin America Cancer Biomarkers Market in Chile: Historical Trends (since 2021) and Forecasted Estimates (till 2035)
- Table 22.84 Cancer Biomarkers Market in Middle East and North Africa: Historical Trends (since 2021) and Forecasted Estimates (till 2035)
- Table 22.85 Middle East and North Africa Cancer Biomarkers Market in Egypt: Historical Trends (since 2021) and Forecasted Estimates (till 2035)
List of Figures
- Figure 2.1 Research Methodology: Project Methodology
- Figure 2.2 Research Methodology: Data Sources for Secondary Research
- Figure 2.3 Research Methodology: Robust Quality Control
- Figure 3.1 Market Dynamics: Forecast Methodology
- Figure 3.2 Market Dynamics: Market Assessment Framework
- Figure 4.1 Lessons Learnt from Past Recessions
- Figure 5.1 Executive Summary: Overall Market Landscape
- Figure 5.2 Executive Summary: Market Trends
- Figure 5.3 Executive Summary: Market Forecast and Opportunity Analysis
- Figure 7.1 Cancer Biomarker Testing Solutions: Distribution by Type of Biomarker Evaluated
- Figure 7.2 Cancer Biomarker Testing Solutions: Distribution by Analytical Technique Used
- Figure 7.3 Cancer Biomarker Testing Solutions: Distribution by Turnaround Time
- Figure 7.4 Cancer Biomarker Testing Solutions: Distribution by Type of Sample Supported
- Figure 7.5 Cancer Biomarker Testing Solutions: Distribution by Type of Nucleic Acid Tested
- Figure 7.6 Cancer Biomarker Testing Solutions: Distribution by Type of Cancer
- Figure 7.7 Cancer Biomarker Testing Solutions: Distribution by Application Area
- Figure 7.8 Cancer Biomarker Testing Solutions: Distribution by End-user
- Figure 7.9 Cancer Biomarker Testing Solution Providers: Distribution by Year of Establishment
- Figure 7.10 Cancer Biomarker Testing Solution Providers: Distribution by Company Size
- Figure 7.11 Cancer Biomarker Testing Solution Providers: Distribution by Location of Headquarters (Region)
- Figure 7.11 Most Active Players: Distribution by Number of Testing Solutions Offered
- Figure 8.1 Product Competitiveness Analysis: Overview of Peer Group I
- Figure 8.2 Product Competitiveness Analysis: Overview of Peer Group II
- Figure 8.3 Product Competitiveness Analysis: Overview of Peer Group III
- Figure 8.4 Product Competitiveness Analysis: Cancer Biomarkers Testing Solution Offered by Providers Headquartered in North America (Peer Group I)
- Figure 8.5 Product Competitiveness Analysis: Cancer Biomarkers Testing Solution Offered by Providers Headquartered in Europe (Peer Group II)
- Figure 8.6 Product Competitiveness Analysis: Cancer Biomarkers Testing Solution Offered by Providers Headquartered in Asia-Pacific (Peer Group III)
- Figure 10.1 Enrichment Clinical Trial Design: Steps Involved
- Figure 10.2 All-Comers Clinical Trial Design: Steps Involved
- Figure 10.3 Hybrid Clinical Trial Design: Steps Involved
- Figure 10.4 Adaptive Clinical Trial Design: Steps Involved
- Figure 11.1 Clinical Trial Analysis: Distribution by Trial Registration Year, 2022-2025
- Figure 11.2 Clinical Trial Analysis: Distribution of Patients Enrolled by Trial Registration Year, 2022-2025
- Figure 11.3 Clinical Trial Analysis: Distribution by Trial Status
- Figure 11.4 Clinical Trial Analysis: Distribution by Trial Registration Year and Trial Status
- Figure 11.5 Clinical Trial Analysis: Distribution by Trial Phase
- Figure 11.6 Clinical Trial Analysis: Distribution of Enrolled Patient Population by Trial Phase
- Figure 11.7 Clinical Trial Analysis: Distribution by Patient Gender
- Figure 11.8 Clinical Trial Analysis: Distribution by Type of Allocation
- Figure 11.9 Clinical Trial Analysis: Distribution by Type of Intervention Model
- Figure 11.10 Clinical Trial Analysis: Distribution by Type of Masking
- Figure 11.11 Clinical Trial Analysis: Distribution by Type of Primary Purpose
- Figure 11.12 Clinical Trial Analysis: Distribution by Type of Sponsor / Collaborator
- Figure 11.13 Most Active Industry Players: Distribution by Number of Registered Trials
- Figure 11.14 Most Active Non-Industry Players: Distribution by Number of Registered Trials
- Figure 11.15 Clinical Trial Analysis: Distribution of Clinical Trials by Geography
- Figure 11.16 Clinical Trial Analysis: Distribution of Clinical Trials by Trial Status and Geography
- Figure 11.17 Clinical Trial Analysis: Distribution of Patients Enrolled by Trial Status and Geography
- Figure 12.1 Publication Analysis: Cumulative Year-wise Trend of Publications, 2019-2023
- Figure 12.2 Publication Analysis: Distribution by Type of Publication
- Figure 12.3 Publication Analysis: Distribution by Type of Cancer
- Figure 12.4 Most Popular Copyright Holders: Distribution by Number of Publications
- Figure 12.5 Word Cloud Analysis: Emerging Focus Areas
- Figure 12.6 Most Active Publishers: Distribution by Number of Publications
- Figure 12.7 Key Journals: Distribution by Impact Factor
- Figure 12.8 Key Journals: Distribution by Number of Publications
- Figure 13.1 Spider Web Analysis: Abbott
- Figure 13.2 Spider Web Analysis: AbbVie
- Figure 13.3 Spider Web Analysis: Amgen
- Figure 13.4 Spider Web Analysis: AstraZeneca
- Figure 13.5 Spider Web Analysis: Bayer
- Figure 13.6 Spider Web Analysis: Boehringer Ingelheim
- Figure 13.7 Spider Web Analysis: Bristol-Myers Squib
- Figure 13.8 Spider Web Analysis: Eli Lilly
- Figure 13.9 Spider Web Analysis: Gilead
- Figure 13.10 Spider Web Analysis: GlaxoSmithKline
- Figure 13.11 Spider Web Analysis: Merck
- Figure 13.12 Spider Web Analysis: Novartis
- Figure 13.13 Spider Web Analysis: Pfizer
- Figure 13.14 Spider Web Analysis: Roche
- Figure 13.15 Spider Web Analysis: Sanofi
- Figure 13.16 Benchmarking Analysis: Big Pharma players
- Figure 14.1 Companion Diagnostics: Value Chain
- Figure 14.2 Companion Diagnostics: Cost Distribution Across Value Chain
- Figure 14.3 Costs Associated with Research and Product Development
- Figure 14.4 Costs Associated with Manufacturing and Assembly
- Figure 14.5 Costs Associated with Clinical Trials, FDA Approval and Other Administrative Tasks
- Figure 14.6 Costs Associated with Payer Negotiation and KOL Engagement
- Figure 14.7 Costs Associated with Marketing and Sales
- Figure 15.1 Cancer Biomarkers Market: Future Growth Opportunities
- Figure 16.1 Global Cancer Biomarkers Market: Historical Trends (since 2021) and Forecasted Estimates (till 2035)
- Figure 16.2 Global Cancer Biomarkers Market: Forecasted Estimates (till 2035): Conservative Scenario (USD Billion)
- Figure 16.3 Global Cancer Biomarkers Market: Forecasted Estimates (till 2035): Optimistic Scenario (USD Billion)
- Figure 17.1 Cancer Biomarkers Market: Distribution by Type of Biomarker
- Figure 17.2 Cancer Biomarkers Market for HER2 Biomarkers: Historical Trends (since 2021) and Forecasted Estimates (till 2035)
- Figure 17.3 Cancer Biomarkers Market for MET Biomarkers: Historical Trends (since 2021) and Forecasted Estimates (till 2035)
- Figure 17.4 Cancer Biomarkers Market for EGFR Biomarkers: Historical Trends (since 2021) and Forecasted Estimates (till 2035)
- Figure 17.5 Cancer Biomarkers Market for PD-L1 Biomarkers: Historical Trends (since 2021) and Forecasted Estimates (till 2035)
- Figure 17.6 Cancer Biomarkers Market for NTRK Biomarkers: Historical Trends (since 2021) and Forecasted Estimates (till 2035)
- Figure 17.7 Cancer Biomarkers Market for ALK Biomarkers: Historical Trends (since 2021) and Forecasted Estimates (till 2035)
- Figure 17.8 Cancer Biomarkers Market for Other Biomarkers: Historical Trends (since 2021) and Forecasted Estimates (till 2035)
- Figure 17.9 Cancer Biomarkers Market: Distribution of Novel Biomarkers
- Figure 17.10 Cancer Biomarkers Market for SNV Biomarkers: Historical Trends (since 2021) and Forecasted Estimates (till 2035)
- Figure 17.11 Cancer Biomarkers Market for CNV Biomarkers: Historical Trends (since 2021) and Forecasted Estimates (till 2035)
- Figure 17.12 Cancer Biomarkers Market for Indel Biomarkers: Historical Trends (since 2021) and Forecasted Estimates (till 2035)
- Figure 17.13 Cancer Biomarkers Market for TIL Biomarkers: Historical Trends (since 2021) and Forecasted Estimates (till 2035)
- Figure 17.14 Cancer Biomarkers Market for MSI Biomarkers: Historical Trends (since 2021) and Forecasted Estimates (till 2035)
- Figure 17.15 Cancer Biomarkers Market for TMB Biomarkers: Historical Trends (since 2021) and Forecasted Estimates (till 2035)
- Figure 18.1 Cancer Biomarkers Market: Distribution by Type of Cancer
- Figure 18.2 Cancer Biomarkers Market for Breast Cancer: Historical Trends (since 2021) and Forecasted Estimates (till 2035)
- Figure 18.3 Cancer Biomarkers Market for Colorectum Cancer: Historical Trends (since 2021) and Forecasted Estimates (till 2035)
- Figure 18.4 Cancer Biomarkers Market for Lung Cancer: Historical Trends (since 2021) and Forecasted Estimates (till 2035)
- Figure 18.5 Cancer Biomarkers Market for Prostate Cancer: Historical Trends (since 2021) and Forecasted Estimates (till 2035)
- Figure 18.6 Cancer Biomarkers Market for Thyroid Cancer: Historical Trends (since 2021) and Forecasted Estimates (till 2035)
- Figure 18.7 Cancer Biomarkers Market for Bladder Cancer: Historical Trends (since 2021) and Forecasted Estimates (till 2035)
- Figure 18.8 Cancer Biomarkers Market for Melanoma: Historical Trends (since 2021) and Forecasted Estimates (till 2035)
- Figure 18.9 Cancer Biomarkers Market for Non-Hodgkin Lymphoma: Historical Trends (since 2021) and Forecasted Estimates (till 2035)
- Figure 18.10 Cancer Biomarkers Market for Endometrial Cancer: Historical Trends (since 2021) and Forecasted Estimates (till 2035)
- Figure 18.11 Cancer Biomarkers Market for Kidney Cancer: Historical Trends (since 2021) and Forecasted Estimates (till 2035)
- Figure 18.12 Cancer Biomarkers Market for Leukemia: Historical Trends (since 2021) and Forecasted Estimates (till 2035)
- Figure 19.1 Cancer Biomarkers Market: Distribution by Key Geographical Regions
- Figure 19.2 Cancer Biomarkers Market in North America: Historical Trends (since 2021) and Forecasted Estimates (till 2035)
- Figure 19.3 Cancer Biomarkers Market in the US: Historical Trends (since 2021) and Forecasted Estimates (till 2035)
- Figure 19.4 Cancer Biomarkers Market in Canada: Historical Trends (since 2021) and Forecasted Estimates (till 2035)
- Figure 19.5 Cancer Biomarkers Market in Europe: Historical Trends (since 2021) and Forecasted Estimates (till 2035)
- Figure 19.6 Cancer Biomarkers Market in Germany: Historical Trends (since 2021) and Forecasted Estimates (till 2035)
- Figure 19.7 Cancer Biomarkers Market in France: Historical Trends (since 2021) and Forecasted Estimates (till 2035)
- Figure 19.8 Cancer Biomarkers Market in the UK: Historical Trends (since 2021) and Forecasted Estimates (till 2035)
- Figure 19.9 Cancer Biomarkers Market in Italy: Historical Trends (since 2021) and Forecasted Estimates (till 2035)
- Figure 19.10 Cancer Biomarkers Market in Spain: Historical Trends (since 2021) and Forecasted Estimates (till 2035)
- Figure 19.11 Cancer Biomarkers Market in Asia-Pacific: Historical Trends (since 2021) and Forecasted Estimates (till 2035)
- Figure 19.12 Cancer Biomarkers Market in China: Historical Trends (since 2021) and Forecasted Estimates (till 2035)
- Figure 19.13 Cancer Biomarkers Market in Japan: Historical Trends (since 2021) and Forecasted Estimates (till 2035)
- Figure 19.14 Cancer Biomarkers Market in India: Historical Trends (since 2021) and Forecasted Estimates (till 2035)
- Figure 19.15 Cancer Biomarkers Market in South Korea: Historical Trends (since 2021) and Forecasted Estimates (till 2035)
- Figure 19.16 Cancer Biomarkers Market in Australia: Historical Trends (since 2021) and Forecasted Estimates (till 2035)
- Figure 19.17 Cancer Biomarkers Market in New Zealand: Historical Trends (since 2021) and Forecasted Estimates (till 2035)
- Figure 19.18 Cancer Biomarkers Market in Latin America: Historical Trends (since 2021) and Forecasted Estimates (till 2035)
- Figure 19.19 Cancer Biomarkers Market in Brazil: Historical Trends (since 2021) and Forecasted Estimates (till 2035)
- Figure 19.20 Cancer Biomarkers Market in Argentina: Historical Trends (since 2021) and Forecasted Estimates (till 2035)
- Figure 19.21 Cancer Biomarkers Market in Chile: Historical Trends (since 2021) and Forecasted Estimates (till 2035)
- Figure 19.22 Cancer Biomarkers Market in Middle East and North Africa: Historical Trends (since 2021) and Forecasted Estimates (till 2035)
- Figure 19.23 Cancer Biomarkers Market in Egypt: Historical Trends (since 2021) and Forecasted Estimates (till 2035)
- Figure 19.24 Market Movement Analysis: Geographical Regions
- Figure 19.25 Penetration-Growth (P-G) Matrix: Geographical Regions
- Figure 20.1 Concluding Remarks: Market Landscape
- Figure 20.2 Concluding Remarks: Clinical Trial Analysis
- Figure 20.3 Concluding Remarks: Publication Analysis
- Figure 20.4 Concluding Remarks: Market Forecast and Opportunity Analysis

