
PUBLISHER: Roots Analysis | PRODUCT CODE: 2072250

PUBLISHER: Roots Analysis | PRODUCT CODE: 2072250
AI in Drug Discovery Market (3rd Edition) by Drug Discovery Step, Type of AI Technology, Therapeutic Area, End User and Geographical Regions - Trends and Forecast, Till 2035
AI in Drug Discovery Market: Overview
As per Roots Analysis, the global AI in drug discovery market is estimated to grow from USD 8.6 billion in the current year to USD 25.0 billion by 2035, at a CAGR of 12.6% during the forecast period, till 2035.
AI in Drug Discovery Market: Growth and Trends
The adoption of artificial intelligence (AI) tools and platforms in drug discovery is experiencing significant acceleration, driven by rising R&D investments and an increasing demand for novel therapeutic solutions. The growing prevalence of chronic diseases, including cancer, neurological disorders, cardiovascular conditions, and infectious diseases, continues to impose substantial clinical and economic burdens. This, in turn, is intensifying the need for faster, more effective, and cost-efficient treatment development.
Additionally, demographic shifts toward aging populations further exacerbate these challenges, prompting pharmaceutical and biotechnology companies to integrate AI-driven technologies into their R&D ecosystems. These platforms enhance operational efficiency across key stages such as target identification, lead generation, and optimization, while addressing inherent limitations of traditional drug discovery, including prolonged development timelines and high attrition rates.
AI-enabled platforms are capable of analyzing extensive multi-omics datasets, supporting advanced applications such as virtual screening, de novo molecule design, and predictive toxicology, thereby accelerating the identification of drug candidates with improved efficacy and safety profiles. Furthermore, cutting-edge methodologies, including generative models and reinforcement learning, help reduce human bias and strengthen drug repurpose efforts to address unmet medical needs. For instance, recent advancements by Insilico Medicine, where its AI-designed drug candidate ISM001-055 has advanced into Phase II clinical trials for idiopathic pulmonary fibrosis, underscore growing industry confidence in the potential of AI to accelerate and streamline drug development timelines.
As a result, AI-driven solutions are increasingly emerging as the preferred approach for early-stage discovery among both biotechnology firms and leading pharmaceutical companies. Platform providers are further enhancing capabilities through the integration of multimodal large language models (LLMs) for data extraction, cloud-enabled workflows, and precision analytics for patient stratification. Ongoing investments and strategic collaborations continue to reinforce strong market momentum, supporting sustained growth of the AI-driven drug discovery market in the foreseeable future.
Growth Drivers: Strategic Enablers of Market Expansion
The adoption of artificial intelligence (AI) in pharmaceutical drug discovery is accelerating, driven by increasing R&D investments and the rapid expansion of biomedical datasets. Strong venture capital inflows into AI platforms particularly those enhancing target identification, molecular interaction prediction, and lead optimization are acting as a key catalyst for market growth. At the same time, the surge in data from genomics, proteomics, and real-world evidence is creating significant opportunities for machine learning-based discovery. AI platforms effectively leverage these datasets to identify novel targets and enable drug repurposing. This data-driven capability is improving R&D efficiency and reducing development timelines. Consequently, biotechnology and pharmaceutical companies are increasingly adopting AI-powered solutions. Together, these factors are expected to support sustained market expansion over the forecast period.
Market Challenges: Critical Barriers Impeding Progress
Despite its numerous advantages, AI in drug discovery faces notable challenges that may hinder its widespread adoption. These include data integration challenges and the absence of standardized regulatory frameworks. Pharmaceutical companies often struggle to consolidate data from disparate sources such as genomics, proteomics, and preclinical studies stored in varied formats, leading to fragmented datasets. This fragmentation limits efficient multi-omics analysis and hinders the generation of actionable insights across discovery pipelines.
This lack of interoperability restricts the full potential of AI platforms in target identification and lead optimization, underscoring the need for standardized data architectures and unified frameworks. Additionally, the absence of clear and consistent regulatory guidelines around data security, privacy, and intellectual property protection poses a critical barrier to broader AI adoption. These concerns prompt organizations to limit access to sensitive datasets, including compound libraries and clinical outcomes, thereby constraining collaborative model development and reducing the overall effectiveness of AI-driven drug discovery.
AI in Drug Discovery Market: Key Insights
The report delves into the current state of the AI in drug discovery market and identifies potential growth opportunities within industry. Some key findings from the report include:
- At present, over 260 companies are engaged in providing AI-based drug discovery platforms.
- Majority players (76%) utilize their AI platforms for the discovery of in-house pipeline candidates, highlighting the rising focus of pharmaceutical firms in integrating AI-powered solutions to expedite discovery processes.
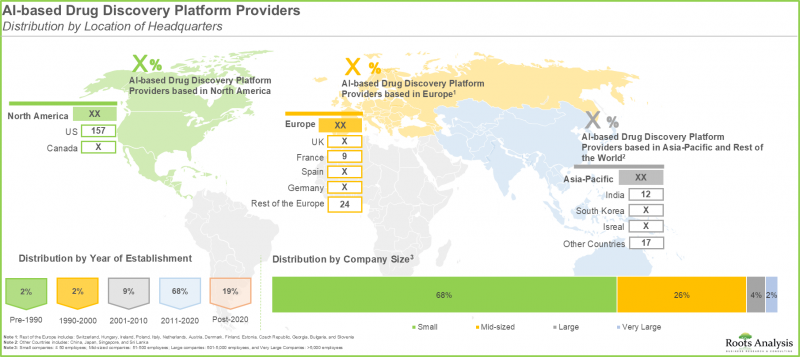
- The current market landscape of AI-based drug discovery platform providers is fragmented, featuring the presence of both new entrants and established players; most (58%) of the players are based in North America.
- The AI in drug discovery domain has witnessed significant funding and investments, which indicates the growing interest of venture capitalists and strategic investors in this domain.
- Majority (>35%) of the funding amount has been raised through venture capital rounds, especially series A rounds; this is followed by grants / awards, which account for ~15% of the total number of instances.
- The patent activity has increased at a CAGR of 67% in the last few years owing to the growing need for efficient platforms and reduced timeline of drug discovery processes.
- The cost saving potential associated with the implementation of AI-based solutions for various therapeutic disorders, especially oncological disorders, is anticipated to significantly increase in the foreseen future.
- The current AI in drug discovery market is estimated to be around USD 8.6 billion; this value is further projected to reach about USD 25.0 billion in 2035, growing at an annualized CAGR of 12.6%.
- Given the increasing prevalence of chronic as well as genetic diseases, the need for advanced AI-based drug discovery platforms has increased considerably, thereby increasing the market opportunity for these platforms.
- The AI-based drug discovery market is driven by revenues generated from pharma and biotech companies' owing to their substantial R&D investments and integrated capabilities in drug development pipelines.
AI in Drug Discovery Market
The market sizing and opportunity analysis has been segmented across the following parameters:
By Drug Discovery Step
- Target Identification / Validation
- Hit Generation / Lead Identification
- Lead Optimization
By Type of AI Technology
- Machine Learning
- Molecular Modelling and Simulation
- Deep Learning
- Omics Integration
- Generative Model
- Structure-based Drug Design
- Others
By Therapeutic Area
- Oncological Disorders
- Cardiovascular Diseases
- Musculoskeletal diseases
- Neurological Disorder
- Respiratory Disorders
- Immunological Disorders
- Gastrointestinal Disorders
- Endocrine Disorders
- Blood Disorders
- Ophthalmological Disorders
- Dermatological Disorders
- Infectious Diseases
- Urinary Disorders
By End User
- Pharma and Biotech Companies
- Contract Research Organizations
- Research and Academic Institutions
By Geographical Regions
- North America
- Europe
- Asia-Pacific
- Latin America
- Middle East and North Africa
AI in Drug Discovery Market: Key Segments
Lead Optimization Emerged as the Dominant Segment in AI-Driven Drug Discovery
The global AI in drug discovery market is segmented across key stages, including target identification and validation, hit generation or lead identification, and lead optimization. Based on current estimates, the lead optimization segment accounts for approximately 50% of the overall market share, making it the largest contributor. This dominance is primarily attributed to the significant proportion of preclinical R&D expenditure allocated to this stage, driven by resource-intensive activities such as chemical synthesis refinement, comprehensive ADMET profiling, and efficacy and potency optimization. AI platforms play a critical role in this phase by enabling predictive modeling and high-throughput screening, thereby enhancing efficiency and streamlining outcome optimization across the drug development process.
Regional Analysis: North America Leads AI in Drug Discovery Market Growth
North America currently dominates the AI in drug discovery market, accounting for over 50% of the global share. This leadership position is driven by multiple factors, including substantial investments in research and development, the presence of advanced healthcare IT infrastructure, and a supportive regulatory environment. In particular, favorable frameworks established by the U.S. Food and Drug Administration (FDA) to facilitate the adoption of AI and machine learning technologies are significantly accelerating innovation and market expansion across the region.
End User Analysis: Pharma and Biotech Companies to maintain market Leadership
Based on end users, the AI in drug discovery market is segmented across pharmaceutical and biotechnology companies, contract research organizations, and academic and research institutions. Based on current market insights, pharmaceutical and biotech companies hold the dominant share, a trend expected to persist over the forecast period. This leadership is primarily attributed to their strong financial capabilities, strategic focus on accelerating drug development pipelines, and advanced infrastructure that supports seamless integration of AI technologies across discovery workflows.
Primary Research Overview
Discussions with multiple stakeholders in this domain influenced the opinions and insights presented in this study. The market report includes detailed transcripts of interviews conducted with the following individuals:
- Chief Commercial Officer and Chief Product Officer, Small Company, UK
- Co-founder, Chairman and Chief Executive Officer, Small Company, US
- Head Researcher, Mid-sized Company, South Korea
- Chief Executive Officer, Small Company, UK
- Chief Commercial Officer, Mid-sized Company, UK
- Chief Executive Officer and Co-Founder, Small Company, Israel
- Chairman, Small Company, US
Example Players in AI in Drug Discovery Market
- BenevolentAI
- Collaborations Pharmaceuticals
- CytoReason
- Deargen
- Deep Genomics
- Genialis
- Healx
- Insilico Medicine
- Iktos
- Optibrium
- XtalPi
AI in Drug Discovery Market: Research Coverage
- Market Sizing and Opportunity Analysis: The report features an in-depth analysis of the AI in drug discovery market, focusing on key market segments, including [A] drug discovery steps, [B] type of AI technology, [C] therapeutic area, [D] end user, and [E] and geographical regions.
- AI in Drug Discovery Market Landscape: A detailed assessment of the overall AI in drug discovery market landscape, along with information on several relevant parameters, such as [A] type of business model, [B] platform utilization, [C] drug discovery stages supported, [D] type of AI technology used, [E] target therapeutic area, [F] type of molecule analyzed, [G] end user, [H] company size, [I] year of establishment and [J] location of headquarters.
- Company Profiles: In-depth profiles of key companies based in North America, Europe and Asia-Pacific based on several parameters such as [A] year of establishment, [B] location of headquarters, [C] product portfolio, [D] recent developments and [E] an informed future outlook.
- Partnerships and Collaborations: An analysis of the recent partnerships and collaborations related to AI in drug discovery, based on several parameters, such as [A] year of agreement, type of partnership, [B] type of partner, [C] geographical analysis, [D] and most active players.
- Funding and Investment Analysis: A detailed analysis of various investments made by players in this domain based on several relevant parameters, such as [A] year of funding, [B] type of funding, [C] amount invested, and [D] most active players (in terms of number of funding instances and amount invested) and [F] key investors (in terms of number of funding instances).
- Patent Analysis: A detailed analysis of the patents that have been filed / granted based on important parameters such as, [A] type of patent, [B] publication year, [C] application year, [D] number of granted patents and patent applications, [E] patent jurisdiction, [F] CPC symbols, [G] patent age, [H] type of applicant, and [I] individual patent assignees (in terms of size of intellectual property portfolio).
- Porter's Five Forces Analysis: An analysis of five competitive forces prevailing in the quantum networking market, including threats of new entrants, bargaining power of buyers, bargaining power of suppliers, threats of substitute products and rivalry among existing competitors.
- Company Valuation Analysis: A relative valuation of companies offering AI platforms / technologies for various drug discovery operations.
- AI based Healthcare Initiatives of Technology Giants: An overview of technology giants, along with AI-based initiatives undertaken by these firms in the healthcare domain.
- Cost Saving Analysis: An insightful analysis, highlighting the cost saving potential associated with the use of AI-based drug discovery platforms.
- Market Impact Analysis: An in-depth analysis of the factors that can impact the growth of the market. It also features identification and analysis of key drivers, potential restraints, emerging opportunities, and existing challenges in this domain.
Key Questions Answered in this Report
- Which are the leading companies in the AI in drug discovery market?
- Which region dominates the AI in drug discovery market?
- What are the key trends observed in AI in drug discovery market?
- What factors are likely to influence the evolution of this market?
- What are the primary challenges faced by AI in drug discovery market?
- What is the current and future market size?
- What is the CAGR of this market?
- How is the current and future market opportunity likely to be distributed across key market segments?
Reasons to Buy this Report
- The report provides a comprehensive market analysis, offering detailed revenue projections of the overall market and its specific sub-segments. This information is valuable to both established market leaders and emerging entrants.
- The report offers stakeholders a comprehensive overview of the market, including key drivers, barriers, opportunities, and challenges. This information empowers stakeholders to stay abreast of market trends and make data-driven decisions to capitalize on growth prospects.
- The report can aid businesses in identifying future opportunities in any sector. It also helps in understanding if those opportunities are worth pursuing.
- The report helps in identifying customer demand by understanding the needs, preferences, and behavior of the target audience in order to tailor products or services effectively.
- The report equips new entrants with requisite information regarding a particular market to help them build successful business strategies.
- The report allows for more effective communication with the audience and in building strong business relations.
Additional Benefits
- Complementary PPT Insights Pack
- Complimentary Excel Data Packs for all Analytical Modules in the Report
- 15% Free Content Customization
- Detailed Report Walkthrough Session with Research Team
- Free Updated report if the report is 6-12 months old or older
TABLE OF CONTENTS
1. PREFACE
- 1.1. Introduction
- 1.2. Market Share Insights
- 1.3. Key Market Insights
- 1.4. Report Coverage
- 1.5. Key Questions Answered
2. RESEARCH METHODOLOGY
- 2.1. Chapter Overview
- 2.2. Research Assumptions
- 2.2.1. Market Landscape and Market Trends
- 2.2.2. Market Forecast and Opportunity Analysis
- 2.2.3. Comparative Analysis
- 2.3. Database Building
- 2.3.1. Data Collection
- 2.3.2. Data Validation
- 2.3.3. Data Analysis
- 2.4. Project Methodology
- 2.4.1. Secondary Research
- 2.4.1.1. Annual Reports
- 2.4.1.2. Academic Research Papers
- 2.4.1.3. Company Websites
- 2.4.1.4. Investor Presentations
- 2.4.1.5. Regulatory Filings
- 2.4.1.6. White Papers
- 2.4.1.7. Industry Publications
- 2.4.1.8. Conferences and Seminars
- 2.4.1.9. Government Portals
- 2.4.1.10. Media and Press Releases
- 2.4.1.11. Newsletters
- 2.4.1.12. Industry Databases
- 2.4.1.13. Roots Proprietary Databases
- 2.4.1.14. Paid Databases and Sources
- 2.4.1.15. Social Media Portals
- 2.4.1.16. Other Secondary Sources
- 2.4.2. Primary Research
- 2.4.2.1. Types of Primary Research
- 2.4.2.1.1. Qualitative Research
- 2.4.2.1.2. Quantitative Research
- 2.4.2.1.3. Hybrid Approach
- 2.4.2.2. Advantages of Primary Research
- 2.4.2.3. Techniques for Primary Research
- 2.4.2.3.1. Interviews
- 2.4.2.3.2. Surveys
- 2.4.2.3.3. Focus Groups
- 2.4.2.3.4. Observational Research
- 2.4.2.3.5. Social Media Interactions
- 2.4.2.4. Key Opinion Leaders Considered in Primary Research
- 2.4.2.4.1. Company Executives (CXOs)
- 2.4.2.4.2. Board of Directors
- 2.4.2.4.3. Company Presidents and Vice Presidents
- 2.4.2.4.4. Research and Development Heads
- 2.4.2.4.5. Technical Experts
- 2.4.2.4.6. Subject Matter Experts
- 2.4.2.4.7. Scientists
- 2.4.2.4.8. Doctors and Other Healthcare Providers
- 2.4.2.5. Ethics and Integrity
- 2.4.2.5.1. Research Ethics
- 2.4.2.5.2. Data Integrity
- 2.4.2.1. Types of Primary Research
- 2.4.3. Analytical Tools and Databases
- 2.4.1. Secondary Research
- 2.5. Robust Quality Control
3. MARKET DYNAMICS
- 3.1. Chapter Overview
- 3.2. Forecast Methodology
- 3.2.1. Top-down Approach
- 3.2.2. Bottom-up Approach
- 3.2.3. Hybrid Approach
- 3.3. Market Assessment Framework
- 3.3.1. Total Addressable Market (TAM)
- 3.3.2. Serviceable Addressable Market (SAM)
- 3.3.3. Serviceable Obtainable Market (SOM)
- 3.3.4. Currently Acquired Market (CAM)
- 3.4. Forecasting Tools and Techniques
- 3.4.1. Qualitative Forecasting
- 3.4.2. Correlation
- 3.4.3. Regression
- 3.4.4. Extrapolation
- 3.4.5. Convergence
- 3.4.6. Sensitivity Analysis
- 3.4.7. Scenario Planning
- 3.4.8. Data Visualization
- 3.4.9. Time Series Analysis
- 3.4.10. Forecast Error Analysis
- 3.5. Key Considerations
- 3.5.1. Demographics
- 3.5.2. Government Regulations
- 3.5.3. Reimbursement Scenarios
- 3.5.4. Market Access
- 3.5.5. Supply Chain
- 3.5.6. Industry Consolidation
- 3.5.7. Pandemic / Unforeseen Disruptions Impact
- 3.6. Limitations
4. MACRO-ECONOMIC INDICATORS
- 4.1. Chapter Overview
- 4.2. Market Dynamics
- 4.2.1. Time Period
- 4.2.1.1. Historical Trends
- 4.2.1.2. Current and Forecasted Estimates
- 4.2.2. Currency Coverage
- 4.2.2.1. Major Currencies Affecting the Market
- 4.2.2.2. Factors Affecting Currency Fluctuations on the Industry
- 4.2.2.3. Impact of Currency Fluctuations on the Industry
- 4.2.3. Foreign Currency Exchange Rate
- 4.2.3.1. Impact of Foreign Exchange Rate Volatility on the Market
- 4.2.3.2. Strategies for Mitigating Foreign Exchange Risk
- 4.2.4. Recession
- 4.2.4.1. Assessment of Current Economic Conditions and Potential Impact on the Market
- 4.2.4.2. Historical Analysis of Past Recessions and Lessons Learnt
- 4.2.5. Inflation
- 4.2.5.1. Measurement and Analysis of Inflationary Pressures in the Economy
- 4.2.5.2. Potential Impact of Inflation on the Market Evolution
- 4.2.6. Interest Rates
- 4.2.6.1. Interest Rates and Their Impact on the Market
- 4.2.6.2. Strategies for Managing Interest Rate Risk
- 4.2.7. Commodity Flow Analysis
- 4.2.7.1. Type of Commodity
- 4.2.7.2. Origins and Destinations
- 4.2.7.3. Values and Weights
- 4.2.7.4. Modes of Transportation
- 4.2.8. Global Trade Dynamics
- 4.2.8.1. Import Scenario
- 4.2.8.2. Export Scenario
- 4.2.8.3. Trade Policies
- 4.2.8.4. Strategies for Mitigating the Risks Associated with Trade Barriers
- 4.2.8.5. Impact of Trade Barriers on the Market
- 4.2.9. War Impact Analysis
- 4.2.9.1. Russian-Ukraine War
- 4.2.9.2. Israel-Hamas War
- 4.2.10. COVID Impact / Related Factors
- 4.2.10.1. Global Economic Impact
- 4.2.10.2. Industry-specific Impact
- 4.2.10.3. Government Response and Stimulus Measures
- 4.2.10.4. Future Outlook and Adaptation Strategies
- 4.2.11. Other Indicators
- 4.2.11.1. Fiscal Policy
- 4.2.11.2. Consumer Spending
- 4.2.11.3. Gross Domestic Product
- 4.2.11.4. Employment
- 4.2.11.5. Taxes
- 4.2.11.6. Stock Market Performance
- 4.2.11.7. Cross Border Dynamics
- 4.2.1. Time Period
- 4.3. Conclusion
5. EXECUTIVE SUMMARY
- 5.1. AI-based Drug Discovery: Market Landscape
- 5.2. AI-based Drug Discovery: Market Trends
- 5.3. AI-based Drug Discovery: Market Forecast and Opportunity Analysis
6. INTRODUCTION
- 6.1. Chapter Overview
- 6.2. Artificial Intelligence
- 6.3. Subsets of AI
- 6.3.1. Machine Learning
- 6.3.1.1. Supervised Learning
- 6.3.1.2. Unsupervised Learning
- 6.3.1.3. Reinforced / Reinforcement Learning
- 6.3.1.4. Deep Learning
- 6.3.1.5. Large Language Models (LLMs)
- 6.3.1.6. Natural Language Processing
- 6.3.1.7. Generative AI
- 6.3.1.8. Computer Vision
- 6.3.1. Machine Learning
- 6.4. Applications of AI in Healthcare
- 6.4.1. Drug Discovery
- 6.4.2. Disease Prediction, Diagnosis and Treatment
- 6.4.3. Manufacturing and Supply Chain Operations
- 6.4.4. Drug Marketing
- 6.4.5. Clinical Trials
- 6.5. AI in Drug Discovery
- 6.5.1. Target Identification
- 6.5.2. Identification of Hit or Lead
- 6.5.3. Lead Optimization
- 6.6. Advantages of Using AI in Drug Discovery Process
- 6.7. Challenges Associated with the Adoption of AI
- 6.8. Future Perspective
7. MARKET LANDSCAPE
- 7.1. Chapter Overview
- 7.2. AI-based Drug Discovery Platform Providers: Overall Market Landscape
- 7.2.1. Analysis by Year of Establishment
- 7.2.2. Analysis by Company Size
- 7.2.3. Analysis by Location of Headquarters
- 7.3. Key AI-based Drug Discovery Platform Providers: Market Landscape
- 7.3.1. Analysis by Type of Business Model
- 7.3.2. Analysis by Platform Utilization
- 7.3.3. Analysis by Drug Discovery Stages Supported
- 7.3.4. Analysis by Type of AI Technology Used
- 7.3.5. Analysis by Target Therapeutic Area
- 7.3.6. Analysis by Type of Molecule Analyzed
- 7.3.7. Analysis by End User
8. COMPANY PROFILES: AI-BASED DRUG DISCOVERY PLATFORM PROVIDERS IN NORTH AMERICA
- 8.1. Chapter Overview
- 8.2. Collaborations Pharmaceuticals
- 8.2.1. Company Overview
- 8.2.2. AI-based Drug Discovery Platform / Technology Portfolio
- 8.2.3. Recent Developments and Future Outlook
- 8.3. Deep Genomics
- 8.3.1. Company Overview
- 8.3.2. AI-based Drug Discovery Platform / Technology Portfolio
- 8.3.3. Recent Developments and Future Outlook
- 8.4. Genialis
- 8.4.1. Company Overview
- 8.4.2. AI-based Drug Discovery Platform / Technology Portfolio
- 8.4.3. Recent Developments and Future Outlook
- 8.5. Insilico Medicine
- 8.5.1. Company Overview
- 8.5.2. AI-based Drug Discovery Platform / Technology Portfolio
- 8.5.3. Recent Developments and Future Outlook
- 8.6. XtalPi
- 8.6.1. Company Overview
- 8.6.2. AI-based Drug Discovery Platform / Technology Portfolio
- 8.6.3. Recent Developments and Future Outlook
9. COMPANY PROFILES: AI-BASED DRUG DISCOVERY PLATFORM PROVIDERS IN EUROPE
- 9.1. Chapter Overview
- 9.2. BenevolentAI
- 9.2.1. Company Overview
- 9.2.2. AI-based Drug Discovery Platform / Technology Portfolio
- 9.2.3. Recent Developments and Future Outlook
- 9.3. Healx
- 9.3.1. Company Overview
- 9.3.2. AI-based Drug Discovery Platform / Technology Portfolio
- 9.3.3. Recent Developments and Future Outlook
- 9.4. Iktos
- 9.4.1. Company Overview
- 9.4.2. AI-based Drug Discovery Platform / Technology Portfolio
- 9.4.3. Recent Developments and Future Outlook
- 9.5. Optibrium
- 9.5.1. Company Overview
- 9.5.2. AI-based Drug Discovery Platform / Technology Portfolio
- 9.5.3. Recent Developments and Future Outlook
10. COMPANY PROFILES: AI-BASED DRUG DISCOVERY PLATFORM PROVIDERS IN ASIA-PACIFIC AND REST OF WORLD
- 10.1. Chapter Overview
- 10.2. CytoReason
- 10.2.1. Company Overview
- 10.2.2. AI-based Drug Discovery Platform / Technology Portfolio
- 10.2.3. Recent Developments and Future Outlook
- 10.3. Deargen
- 10.3.1. Company Overview
- 10.3.2. AI-based Drug Discovery Platform / Technology Portfolio
- 10.3.3. Recent Developments and Future Outlook
11. PARTNERSHIPS AND COLLABORATIONS
- 11.1. Chapter Overview
- 11.2. Partnership Models
- 11.3. AI-based Drug Discovery: Partnerships and Collaborations
- 11.3.1. Quarterly Trend of Partnerships
- 11.3.2. Analysis by Type of Partnership
- 11.3.3. Analysis by Quarter and Type of Partnership
- 11.3.4. Analysis by Type of Partner
- 11.3.5. Most Active Players: Analysis by Number of Partnerships
- 11.3.6. Analysis by Geography
- 11.3.6.1. Intercontinental and Intracontinental Deals
- 11.3.6.2. International and Local Deals
12. FUNDING AND INVESTMENTS ANALYSIS
- 12.1. Chapter Overview
- 12.2. Funding Models
- 12.3. AI-based Drug Discovery: Funding and Investments
- 12.3.1. Quarterly Trend of Funding
- 12.3.2. Quarterly Trend of Amount Invested
- 12.3.3. Analysis of Funding Instances by Type of Funding
- 12.3.4. Analysis of Funding Instances by Quarter and Type of Funding
- 12.3.5. Analysis of Amount Invested by Type of Funding
- 12.3.6. Analysis of Amount Invested by Quarter and Type of Funding
- 12.3.7. Analysis by Geography
- 12.3.8. Most Active Players: Analysis by Number of Funding Instances
- 12.3.9. Most Active Players: Analysis by Amount Raised
- 12.3.10. Leading Investors: Distribution by Number of Funding Instances
13. PATENT ANALYSIS
- 13.1. Chapter Overview
- 13.2. Scope And Methodology
- 13.3. AI-based Drug Discovery: Patent Analysis
- 13.3.1. Analysis by Patent Publication Year
- 13.3.2. Analysis by Type of Patent and Publication Year
- 13.3.3. Analysis by Patent Application Year
- 13.3.4. Analysis by Patent Jurisdiction
- 13.3.5. Analysis by CPC Symbols
- 13.3.6. Analysis by Type of Applicant
- 13.3.7. Leading Industry Players: Analysis by Number of Patents
- 13.3.8. Leading Non-Industry Players: Analysis by Number of Patents
- 13.3.9. Leading Individual Assignees: Analysis by Number of Patents
- 13.4. Patent Benchmarking Analysis
- 13.4.1. Analysis by Patent Characteristics
- 13.5. Patent Valuation
- 13.6. Leading Patents by Number of Citations
14. PORTER'S FIVE FORCES ANALYSIS
- 14.1. Chapter Overview
- 14.2. Methodology and Assumptions
- 14.3. Key Elements of Porter's Five Forces
- 14.4. Threat of New Entrants
- 14.5. Bargaining Power of Buyers
- 14.6. Bargaining Power of Solution Providers
- 14.7. Threats of Substitute Products
- 14.8. Rivalry Among Existing Competitors
- 14.9. Concluding Remarks
15. COMPANY VALUATION ANALYSIS
- 15.1. Chapter Overview
- 15.2. Company Valuation Analysis: Key Parameters
- 15.3. Methodology
- 15.4. Company Valuation Analysis: Roots Analysis Proprietary Scores
16. AI-BASED HEALTHCARE INITIATIVES OF TECHNOLOGY GIANTS
- 16.1. Chapter Overview
- 16.2. Alibaba Cloud
- 16.3. Google
- 16.4. IBM
- 16.5. Intel
- 16.6. Microsoft
- 16.7. Siemens
17. COST SAVING ANALYSIS
- 17.1. Chapter Overview
- 17.2. Key Assumptions and Methodology
- 17.3. Overall Cost Saving Potential Associated with Use of AI-based Drug Discovery Platforms, Till 2035
- 17.3.1. Cost Saving Potential: Distribution by Drug Discovery Steps
- 17.3.1.1. Cost Saving Potential in Target Identification / Validation, Till 2035
- 17.3.1.2. Cost Saving Potential in Hit Generation / Lead Identification and Optimization, Till 2035
- 17.3.2. Cost Saving Potential: Distribution by Type of AI Technology
- 17.3.2.1. Cost Saving Potential with Machine Learning, Till 2035
- 17.3.2.2. Cost Saving Potential with Molecular Modelling and Simulation, Till 2035
- 17.3.2.3. Cost Saving Potential with Deep Learning, Till 2035
- 17.3.2.4. Cost Saving Potential with Omics Integration, Till 2035
- 17.3.2.5. Cost Saving Potential with Generative Model, Till 2035
- 17.3.2.6. Cost Saving Potential with Structure-based Drug Design, Till 2035
- 17.3.2.7. Cost Saving Potential with Other Technologies, Till 2035
- 17.3.3. Cost Saving Potential: Distribution by Therapeutic Area, Till 2035
- 17.3.3.1. Cost Saving Potential in Drug Discovery for Oncological Disorders, Till 2035
- 17.3.3.2. Cost Saving Potential in Drug Discovery for Cardiovascular Disorders, Till 2035
- 17.3.3.3. Cost Saving Potential in Drug Discovery for Musculoskeletal Disorders, Till 2035
- 17.3.3.4. Cost Saving Potential in Drug Discovery for Neurological Disorders, Till 2035
- 17.3.3.5. Cost Saving Potential in Drug Discovery for Respiratory Disorders, Till 2035
- 17.3.3.6. Cost Saving Potential in Drug Discovery for Immunological Disorders, Till 2035
- 17.3.3.7. Cost Saving Potential in Drug Discovery for Gastrointestinal Disorders, Till 2035
- 17.3.3.8. Cost Saving Potential in Drug Discovery for Endocrine Disorders, Till 2035
- 17.3.3.9. Cost Saving Potential in Drug Discovery for Ophthalmological Disorders, Till 2035
- 17.3.3.10. Cost Saving Potential in Drug Discovery for Blood Disorders, Till 2035
- 17.3.3.11. Cost Saving Potential in Drug Discovery for Dermatological Disorders, Till 2035
- 17.3.3.12. Cost Saving Potential in Drug Discovery for Infectious Diseases, Till 2035
- 17.3.3.13. Cost Saving Potential in Drug Discovery for Urinary Disorders, Till 2035
- 17.3.4. Cost Saving Potential: Distribution by End User
- 17.3.4.1. Cost Saving Potential for Pharma and Biotech Companies, Till 2035
- 17.3.4.2. Cost Saving Potential for Contract Research Organizations (CROs), Till 2035
- 17.3.4.3. Cost Saving Potential for Research and Academic Institutions, Till 2035
- 17.3.5. Cost Saving Potential: Distribution by Geographical Regions
- 17.3.5.1. Cost Saving Potential in North America, Till 2035
- 17.3.5.2. Cost Saving Potential in Europe, Till 2035
- 17.3.5.3. Cost Saving Potential in Asia-Pacific, Till 2035
- 17.3.5.4. Cost Saving Potential in MENA, Till 2035
- 17.3.5.5. Cost Saving Potential in Latin America, Till 2035
- 17.3.1. Cost Saving Potential: Distribution by Drug Discovery Steps
- 17.4. Conclusion
18. MARKET IMPACT ANALYSIS: DRIVERS, RESTRAINTS, OPPORTUNITIES AND CHALLENGES
- 18.1. Chapter Overview
- 18.2. Market Drivers
- 18.3. Market Restraints
- 18.4. Market Opportunities
- 18.5. Market Challenges
- 18.6. Conclusion
19. GLOBAL AI-BASED DRUG DISCOVERY MARKET
- 19.1. Chapter Overview
- 19.2. Key Assumptions and Methodology
- 19.3. Global AI-based Drug Discovery Market, Historical Trends (Since 2023) and Forecasted Estimates (Till 2035)
- 19.3.1. Scenario Analysis
- 19.3.1.1. Conservative Scenario
- 19.3.1.2. Optimistic Scenario
- 19.3.1. Scenario Analysis
- 19.4. Key Market Segmentations
20. AI-BASED DRUG DISCOVERY MARKET, BY DRUG DISCOVERY STEP
- 20.1. Chapter Overview
- 20.2. Key Assumptions and Methodology
- 20.3. AI-based Drug Discovery Market: Distribution by Drug Discovery Step
- 20.3.1. AI-based Drug Discovery Market for Target Identification / Validation, Historical Trends (Since 2023) and Forecasted Estimates (Till 2035)
- 20.3.2. AI-based Drug Discovery Market for Hit Generation / Lead Identification, Historical Trends (Since 2023) and Forecasted Estimates (Till 2035)
- 20.3.3. AI-based Drug Discovery Market for Lead Optimization, Historical Trends (Since 2023) and Forecasted Estimates (Till 2035)
- 20.4. Data Triangulation and Validation
21. AI-BASED DRUG DISCOVERY MARKET, BY TYPE OF AI TECHNOLOGY
- 21.1. Chapter Overview
- 21.2. Key Assumptions and Methodology
- 21.3.1. AI-based Drug Discovery Market for Machine Learning, Historical Trends (Since 2023) and Forecasted Estimates (Till 2035)
- 21.3.2. AI-based Drug Discovery Market for Molecular Modelling and Simulation, Historical Trends (Since 2023) and Forecasted Estimates (Till 2035)
- 21.3.3. AI-based Drug Discovery Market for Deep Learning, Historical Trends (Since 2023) and Forecasted Estimates (Till 2035)
- 21.3.4. AI-based Drug Discovery Market for Omics Integration, Historical Trends (Since 2023) and Forecasted Estimates (Till 2035)
- 21.3.5. AI-based Drug Discovery Market for Generative Models, Historical Trends (Since 2023) and Forecasted Estimates (Till 2035)
- 21.3.6. AI-based Drug Discovery Market for Structure-Based Drug Design, Historical Trends (Since 2023) and Forecasted Estimates (Till 2035)
- 21.3.7. AI-based Drug Discovery Market for Others, Historical Trends (Since 2023) and Forecasted Estimates (Till 2035)
- 21.4. Data Triangulation and Validation
22. AI-BASED DRUG DISCOVERY MARKET, BY THERAPEUTIC AREA
- 22.1. Chapter Overview
- 22.2. Key Assumptions and Methodology
- 22.3. AI-based Drug Discovery Market: Distribution by Therapeutic Area
- 22.3.1. AI-based Drug Discovery Market for Oncological Disorders, Historical Trends (Since 2023) and Forecasted Estimates (Till 2035)
- 22.3.2. AI-based Drug Discovery Market for Cardiovascular Disorders, Historical Trends (Since 2023) and Forecasted Estimates (Till 2035)
- 22.3.3. AI-based Drug Discovery Market for Musculoskeletal Disorders, Historical Trends (Since 2023) and Forecasted Estimates (Till 2035)
- 22.3.4. AI-based Drug Discovery Market for Neurological Disorders, Historical Trends (Since 2023) and Forecasted Estimates (Till 2035)
- 22.3.5. AI-based Drug Discovery Market for Respiratory Disorders, Historical Trends (Since 2023) and Forecasted Estimates (Till 2035)
- 22.3.6. AI-based Drug Discovery Market for Immunological Disorders, Historical Trends (Since 2023) and Forecasted Estimates (Till 2035)
- 22.3.7. AI-based Drug Discovery Market for Gastrointestinal Disorders, Historical Trends (Since 2023) and Forecasted Estimates (Till 2035)
- 22.3.8. AI-based Drug Discovery Market for Endocrine Disorders, Historical Trends (Since 2023) and Forecasted Estimates (Till 2035)
- 22.3.9. AI-based Drug Discovery Market for Blood Disorders, Historical Trends (Since 2023) and Forecasted Estimates (Till 2035)
- 22.3.10. AI-based Drug Discovery Market for Ophthalmological Disorders, Historical Trends (Since 2023) and Forecasted Estimates (Till 2035)
- 22.3.11. AI-based Drug Discovery Market for Dermatological Disorders, Historical Trends (Since 2023) and Forecasted Estimates (Till 2035)
- 22.3.12. AI-based Drug Discovery Market for Infectious Diseases, Historical Trends (Since 2023) and Forecasted Estimates (Till 2035)
- 22.3.13. AI-based Drug Discovery Market for Urinary Disorders, Historical Trends (Since 2023) and Forecasted Estimates (Till 2035)
- 22.4. Data Triangulation and Validation
23. AI-BASED DRUG DISCOVERY MARKET, BY END USER
- 23.1. Chapter Overview
- 23.2. Key Assumptions and Methodology
- 23.3. AI-based Drug Discovery Market: Distribution by End User
- 23.3.1. AI-based Drug Discovery Market for Pharma and Biotech Companies, Historical Trends (Since 2023) and Forecasted Estimates (Till 2035)
- 23.3.2. AI-based Drug Discovery Market for Contract Research Organizations, Historical Trends (Since 2023) and Forecasted Estimates (Till 2035)
- 23.3.3. AI-based Drug Discovery Market for Research and Academic Institutions, Historical Trends (Since 2023) and Forecasted Estimates (Till 2035)
- 23.4. Data Triangulation and Validation
24. AI-BASED DRUG DISCOVERY MARKET, BY GEOGRAPHICAL REGIONS
- 23.1. Chapter Overview
- 23.2. Key Assumptions and Methodology
- 24.3. AI-based Drug Discovery Market: Distribution by Geographical Regions
- 24.3.1. AI-based Drug Discovery Market in North America, Historical Trends (Since 2023) and Forecasted Estimates (Till 2035)
- 24.3.1.1. AI-based Drug Discovery Market in the US, Historical Trends (Since 2023) and Forecasted Estimates (Till 2035)
- 24.3.1.2. AI-based Drug Discovery Market in Canada, Historical Trends (Since 2023) and Forecasted Estimates (Till 2035)
- 24.3.2. AI-based Drug Discovery Market in Europe, Historical Trends (Since 2023) and Forecasted Estimates (Till 2035)
- 24.3.2.1. AI-based Drug Discovery Market in the UK, Historical Trends (Since 2023) and Forecasted Estimates (Till 2035)
- 24.3.2.2. AI-based Drug Discovery Market in Germany, Historical Trends (Since 2023) and Forecasted Estimates (Till 2035)
- 24.3.2.3. AI-based Drug Discovery Market in France, Historical Trends (Since 2023) and Forecasted Estimates (Till 2035)
- 24.3.2.4. AI-based Drug Discovery Market in Spain, Historical Trends (Since 2023) and Forecasted Estimates (Till 2035)
- 24.3.2.5. AI-based Drug Discovery Market in Italy, Historical Trends (Since 2023) and Forecasted Estimates (Till 2035)
- 24.3.2.6. AI-based Drug Discovery Market in Rest of Europe, Historical Trends (Since 2023) and Forecasted Estimates (Till 2035)
- 24.3.3. AI-based Drug Discovery Market in Asia-Pacific, Historical Trends (Since 2023) and Forecasted Estimates (Till 2035)
- 24.3.3.1. AI-based Drug Discovery Market in China, Historical Trends (Since 2023) and Forecasted Estimates (Till 2035)
- 24.3.3.2. AI-based Drug Discovery Market in Japan, Historical Trends (Since 2023) and Forecasted Estimates (Till 2035)
- 24.3.3.3. AI-based Drug Discovery Market in South Korea, Historical Trends (Since 2023) and Forecasted Estimates (Till 2035)
- 24.3.3.4. AI-based Drug Discovery Market in Australia, Historical Trends (Since 2023) and Forecasted Estimates (Till 2035)
- 24.3.3.5. AI-based Drug Discovery Market in India, Historical Trends (Since 2023) and Forecasted Estimates (Till 2035)
- 24.3.4. AI-based Drug Discovery Market in MENA, Historical Trends (Since 2023) and Forecasted Estimates (Till 2035)
- 24.3.4.1. AI-based Drug Discovery Market in Saudi Arabia, Historical Trends (Since 2023) and Forecasted Estimates (Till 2035)
- 24.3.4.2. AI-based Drug Discovery Market in UAE, Historical Trends (Since 2023) and Forecasted Estimates (Till 2035)
- 24.3.4.3. AI-based Drug Discovery Market in Egypt, Historical Trends (Since 2023) and Forecasted Estimates (Till 2035)
- 24.3.5. AI-based Drug Discovery Market in Latin America, Historical Trends (Since 2023) and Forecasted Estimates (Till 2035)
- 24.3.5.1. AI-based Drug Discovery Market in Brazil, Historical Trends (Since 2023) and Forecasted Estimates (Till 2035)
- 24.3.5.2. AI-based Drug Discovery Market in Mexico, Historical Trends (Since 2023) and Forecasted Estimates (Till 2035)
- 24.3.5.3. AI-based Drug Discovery Market in Argentina, Historical Trends (Since 2023) and Forecasted Estimates (Till 2035)
- 24.3.1. AI-based Drug Discovery Market in North America, Historical Trends (Since 2023) and Forecasted Estimates (Till 2035)
- 24.4. Market Dynamics Assessment
- 24.4.1. Market Movement Analysis
- 24.4.2. Penetration-Growth (P-G) Matrix
- 24.5. Data Triangulation and Validation
25. CONCLUDING REMARKS
26. EXECUTIVE INSIGHTS
- 26.1. Chapter Overview
- 26.2. Company A
- 26.2.1. Company Snapshot
- 26.2.2. Interview Transcript
- 26.3. Company B
- 26.3.1. Company Snapshot
- 26.3.2. Interview Transcript
- 26.4. Company C
- 26.4.1. Company Snapshot
- 26.4.2. Interview Transcript
- 26.5. Company D
- 26.5.1. Company Snapshot
- 26.5.2. Interview Transcript
- 26.6. Company E
- 26.6.1. Company Snapshot
- 26.6.2. Interview Transcript
- 26.7. Company F
- 26.7.1. Company Snapshot
- 26.7.2. Interview Transcript
- 26.8. Company G
- 26.8.1. Company Snapshot
- 26.8.2. Interview Transcript
27. APPENDIX I: TABULATED DATA
28. APPENDIX II: LIST OF COMPANIES AND ORGANIZATIONS
List of Tables
- Table 7.1 AI-based Drug Discovery Platform Providers: Information on Year of Establishment, Company Size, and Location of Headquarters
- Table 7.2 Key AI-based Drug Discovery Platform Providers: Information on Platform, Type of Business Model, Platform Utilization and Drug Discovery Stages Supported
- Table 7.3 Key AI-based Drug Discovery Platform Providers: Information on Type of AI Technology Used
- Table 7.4 Key AI-based Drug Discovery Platform Providers: Information on Target Therapeutic Area
- Table 7.5 Key AI-based Drug Discovery Platform Providers: Information on Type of Molecule Analyzed and End User
- Table 8.1 AI-based Drug Discovery Platform Providers based in North America: List of Companies Profiled
- Table 8.2 Collaborations Pharmaceuticals: Company Overview
- Table 8.3 Collaborations Pharmaceuticals: AI-based Drug Discovery Platform / Technology Portfolio
- Table 8.4 Collaborations Pharmaceuticals: Recent Developments and Future Outlook
- Table 8.5 Deep Genomics: Company Overview
- Table 8.6 Deep Genomics: AI-based Drug Discovery Platform / Technology Portfolio
- Table 8.7 Deep Genomics: Recent Developments and Future Outlook
- Table 8.8 Genialis: Company Overview
- Table 8.9 Genialis: AI-based Drug Discovery Platform / Technology Portfolio
- Table 8.10 Genialis: Recent Developments and Future Outlook
- Table 8.11 Insilico Medicine: Company Overview
- Table 8.12 Insilico Medicine: AI-based Drug Discovery Platform / Technology Portfolio
- Table 8.13 Insilico Medicine: Recent Developments and Future Outlook
- Table 8.14 XtalPi: Company Overview
- Table 8.15 XtalPi: AI-based Drug Discovery Platform / Technology Portfolio
- Table 8.16 XtalPi: Recent Developments and Future Outlook
- Table 9.1 AI-based Drug Discovery Platform Providers based in Europe: List of Companies Profiled
- Table 9.2 BenevolentAI: Company Overview
- Table 9.3 BenevolentAI: AI-based Drug Discovery Platform / Technology Portfolio
- Table 9.4 Healx: Company Overview
- Table 9.5 Healx: AI-based Drug Discovery Platform / Technology Portfolio
- Table 9.6 Healx: Recent Developments and Future Outlook
- Table 9.7 Iktos: Company Overview
- Table 9.8 Iktos: AI-based Drug Discovery Platform / Technology Portfolio
- Table 9.9 Iktos: Recent Developments and Future Outlook
- Table 9.10 Optibrium: Company Overview
- Table 9.11 Optibrium: AI-based Drug Discovery Platform / Technology Portfolio
- Table 9.12 Optibrium: Recent Developments and Future Outlook
- Table 10.1 AI-based Drug Discovery Platform Providers based in Asia-Pacific and Rest of World: List of Companies Profiled
- Table 10.2 CytoReason: Company Overview
- Table 10.3 CytoReason: AI-based Drug Discovery Platform / Technology Portfolio
- Table 10.4 Deargen: Company Overview
- Table 10.5 Deargen: AI-based Drug Discovery Platform / Technology Portfolio
- Table 11.1 AI-based Drug Discovery: List of Partnerships and Collaborations
- Table 12.1 AI-based Drug Discovery Market: List of Funding and Investments
- Table 13.1 Patent Analysis CPC Sections
- Table 13.2 Patent Analysis Top CPC Symbols
- Table 13.3 Patent Analysis Top CPC Codes
- Table 13.4 Patent Analysis Summary of Benchmarking Analysis
- Table 13.5 Patent Analysis Categorization based on Weighted Valuation Scores
- Table 13.6 Patent Portfolio List of Leading Patents by Highest Relative Valuation
- Table 13.7 Patent Portfolio List of Leading Patents by Number of Citations
- Table 15.1 Company Valuation Analysis: Scoring Sheet
- Table 15.2 Company Valuation Analysis: Estimated Valuation
- Table 18.1 Growth Drivers: Market Impact and Time Period
- Table 18.2 Growth Restraints: Market Impact and Time Period
- Table 18.3 Growth Opportunities: Market Impact and Time Period
- Table 18.4 Growth Challenges: Market Impact and Time Period
- Table 26.1 Aigenpulse: Company Snapshot
- Table 26.2 Cloud Pharmaceuticals: Company Snapshot
- Table 26.3 Deargen: Company Snapshot
- Table 26.4 Intelligent Omics: Company Snapshot
- Table 26.5 Optibrium: Company Snapshot
- Table 26.6 Pepticom: Company Snapshot
- Table 26.7 Sage-N Research: Company Snapshot
- Table 27.1 AI-based Drug Discovery Platform Providers: Distribution by Year of Establishment
- Table 27.2 AI-based Drug Discovery Platform Providers: Distribution by Company Size
- Table 27.3 AI-based Drug Discovery Platform Providers: Distribution by Location of Headquarters (Region)
- Table 27.4 AI-based Drug Discovery Platform Providers: Distribution by Location of Headquarters (Country)
- Table 27.5 Key AI-based Drug Discovery Platform Providers: Distribution by Type of Business Model
- Table 27.6 Key AI-based Drug Discovery Platform Providers: Distribution by Platform Utilization
- Table 27.7 Key AI-based Drug Discovery Platform Providers: Distribution by Drug Discovery Stages Supported
- Table 27.8 Key AI-based Drug Discovery Platform Providers: Distribution by Type of AI Technology Used
- Table 27.9 Key AI-based Drug Discovery Platform Providers: Distribution by Target Therapeutic Area
- Table 27.10 Key AI-based Drug Discovery Platform Providers: Distribution by Type of Molecule Analyzed
- Table 27.11 Key AI-based Drug Discovery Platform Providers: Distribution by End User
- Table 27.12 Partnerships and Collaborations: Quarterly Trend of Partnerships
- Table 27.13 Partnerships and Collaborations: Distribution by Type of Partnership
- Table 27.14 Partnerships and Collaborations: Distribution by Quarter and Type of Partnership
- Table 27.15 Partnerships and Collaborations: Distribution by Type of Partner
- Table 27.16 Most Active Players: Distribution by Number of Partnerships
- Table 27.17 Most Active Players: Distribution by Number of Partnerships
- Table 27.18 Partnerships and Collaborations: Local and International Agreements
- Table 27.19 Partnerships and Collaborations: Intracontinental and Intercontinental Agreements
- Table 27.20 Funding and Investments Analysis: Quarterly Trend of Funding
- Table 27.21 Funding and Investments Analysis: Quarterly Trend of Amount Invested (USD Million)
- Table 27.22 Funding and Investments: Distribution of Instances by Type of Funding
- Table 27.23 Funding and Investments: Distribution by Quarter and Type of Funding (USD Million)
- Table 27.24 Funding and Investments: Distribution of Amount Invested by Type of Funding (USD Million)
- Table 27.25 Funding and Investment Analysis: Distribution of Amount Invested by Quarter and Type of Funding
- Table 27.26 Funding and Investments: Distribution by Geography (Region)
- Table 27.27 Funding and Investments: Distribution by Geography (Country)
- Table 27.28 Most Active Players: Distribution by Number of Funding Instances
- Table 27.29 Most Active Players: Distribution by Amount Raised (USD Million)
- Table 27.30 Leading Investors: Distribution by Number of Funding Instances
- Table 27.31 Patent Analysis: Distribution by Type of Patent
- Table 27.32 Patent Analysis: Cumulative Distribution by Patent Publication Year
- Table 27.33 Patent Analysis: Distribution by Type of Patent and Patent Publication Year
- Table 27.34 Patent Analysis: Distribution by Patent Application Year, 2018-2025
- Table 27.35 Patent Analysis: Distribution by Patent Jurisdiction
- Table 27.36 Patent Analysis: Cumulative Year-wise Distribution by Type of Applicant
- Table 27.37 Leading Industry Players: Distribution by Number of Patents
- Table 27.38 Leading Non-Industry Players: Distribution by Number of Patents
- Table 27.39 Leading Individual Assignees: Distribution by Number of Patents
- Table 27.40 Patent Analysis: Distribution by Patent Age
- Table 27.41 Patent Analysis: Distribution by Patent Valuation
- Table 27.42 Overall Cost Saving Potential Associated with Use of AI-based Drug Discovery Platforms, Till 2035 (USD Billion)
- Table 27.43 Cost Saving Potential: Distribution by Drug Discovery Steps (USD Billion)
- Table 27.44 Cost Saving Potential in Target Identification/Validation, Till 2035 (USD Billion)
- Table 27.45 Cost Saving Potential in Hit Generation/Lead Identification and Optimization, Till 2035 (USD Billion)
- Table 27.46 Cost Saving Potential in Hit Generation/Lead Identification and Optimization, Till 2035 (USD Billion)
- Table 27.47 Cost Saving Potential: Distribution by Type of AI Technology (USD Billion)
- Table 27.48 Cost Saving Potential with Machine Learning, Till 2035 (USD Billion)
- Table 27.49 Cost Saving Potential with Molecular Modelling and Simulation, Till 2035 (USD Billion)
- Table 27.50 Cost Saving Potential with Deep Learning, Till 2035 (USD Billion)
- Table 27.51 Cost Saving Potential with Omics Integration, Till 2035 (USD Billion)
- Table 27.52 Cost Saving Potential with Generative Model, Till 2035 (USD Billion)
- Table 27.53 Cost Saving Potential with Structure-Based Drug Design, Till 2035 (USD Billion)
- Table 27.54 Cost Saving Potential with Other Technologies, Till 2035 (USD Billion)
- Table 27.55 Cost Saving Potential: Distribution by Therapeutic Area (USD Billion)
- Table 27.56 Cost Saving Potential in Drug Discovery for Oncological Disorders, Till 2035 (USD Billion)
- Table 27.57 Cost Saving Potential in Drug Discovery for Cardiovascular Disorders, Till 2035 (USD Billion)
- Table 27.58 Cost Saving Potential in Drug Discovery for Musculoskeletal Disorders, Till 2035 (USD Billion)
- Table 27.59 Cost Saving Potential in Drug Discovery for Neurological Disorders, Till 2035 (USD Billion)
- Table 27.60 Cost Saving Potential in Drug Discovery for Respiratory Disorders, Till 2035 (USD Billion)
- Table 27.61 Cost Saving Potential in Drug Discovery for Immunological Disorders, Till 2035 (USD Billion)
- Table 27.62 Cost Saving Potential in Drug Discovery for Gastrointestinal Disorders, Till 2035 (USD Billion)
- Table 27.63 Cost Saving Potential in Drug Discovery for Endocrine Disorders, Till 2035 (USD Billion)
- Table 27.64 Cost Saving Potential in Drug Discovery for Ophthalmological Disorders, Till 2035 (USD Billion)
- Table 27.65 Cost Saving Potential in Drug Discovery for Blood Disorders, Till 2035 (USD Billion)
- Table 27.66 Cost Saving Potential in Drug Discovery for Dermatological Disorders, Till 2035 (USD Billion)
- Table 27.67 Cost Saving Potential in Drug Discovery for Infectious Diseases, Till 2035 (USD Billion)
- Table 27.68 Cost Saving Potential in Drug Discovery for Urinary Disorders, Till 2035 (USD Billion)
- Table 27.69 Cost Saving Potential: Distribution by End User (USD Billion)
- Table 27.70 Cost Saving Potential for Pharma and Biotech Companies, Till 2035 (USD Billion)
- Table 27.71 Cost Saving Potential for Contract Research Organizations (CRO), Till 2035 (USD Billion)
- Table 27.72 Cost Saving Potential for Research and Academic Institutions, Till 2035 (USD Billion)
- Table 27.73 Cost Saving Potential: Distribution by Geographical Regions (USD Billion)
- Table 27.74 Cost Saving Potential in North America, Till 2035 (USD Billion)
- Table 27.75 Cost Saving Potential in Europe, Till 2035 (USD Billion)
- Table 27.76 Cost Saving Potential in Asia-Pacific, Till 2035 (USD Billion)
- Table 27.77 Cost Saving Potential in MENA, Till 2035 (USD Billion)
- Table 27.78 Cost Saving Potential in Latin America, Till 2035 (USD Billion)
- Table 27.79 Global AI-based Drug Discovery Market, Historical Trends (Since 2023) and Forecasted Estimates (Till 2035) (USD Million)
- Table 27.80 Global AI-based Drug Discovery Market, Forecasted Estimates (Till 2035), Conservative Scenario (USD Million)
- Table 27.81 Global AI-based Drug Discovery Market, Forecasted Estimates (Till 2035), Optimistic Scenario (USD Million)
- Table 27.82 AI-based Drug Discovery Market: Distribution by Drug Discovery Steps
- Table 27.83 AI-based Drug Discovery Market for Target Identification/Validation, Historical Trends (Since 2023) and Forecasted Estimates (Till 2035) (USD Million)
- Table 27.84 AI-based Drug Discovery Market for Hit Generation/Lead Identification, Historical Trends (Since 2023) and Forecasted Estimates (Till 2035) (USD Million)
- Table 27.85 AI-based Drug Discovery Market for Lead Optimization, Historical Trends (Since 2023) and Forecasted Estimates (Till 2035) (USD Million)
- Table 27.86 AI-based Drug Discovery Market: Distribution by Type of AI Technology
- Table 27.87 AI-based Drug Discovery Market for Machine Learning, Historical Trends (Since 2023) and Forecasted Estimates (Till 2035) (USD Million)
- Table 27.88 AI-based Drug Discovery Market for Molecular Modelling and Simulation, Historical Trends (Since 2023) and Forecasted Estimates (Till 2035) (USD Million)
- Table 27.89 AI-based Drug Discovery Market for Deep Learning, Historical Trends (Since 2023) and Forecasted Estimates (Till 2035) (USD Million)
- Table 27.90 AI-based Drug Discovery Market for Omics Integration, Historical Trends (Since 2023) and Forecasted Estimates (Till 2035) (USD Million)
- Table 27.91 AI-based Drug Discovery Market for Generative Models, Historical Trends (Since 2023) and Forecasted Estimates (Till 2035) (USD Million)
- Table 27.92 AI-based Drug Discovery Market for Structure-Based Drug Design, Historical Trends (Since 2023) and Forecasted Estimates (Till 2035) (USD Million)
- Table 27.93 AI-based Drug Discovery Market for Others, Historical Trends (Since 2023) and Forecasted Estimates (Till 2035) (USD Million)
- Table 27.94 AI-based Drug Discovery Market: Distribution by Therapeutic Area
- Table 27.95 AI-based Drug Discovery Market for Oncological Disorders, Historical Trends (Since 2023) and Forecasted Estimates (Till 2035) (USD Million)
- Table 27.96 AI-based Drug Discovery Market for Cardiovascular Disorders, Historical Trends (Since 2023) and Forecasted Estimates (Till 2035) (USD Million)
- Table 27.97 AI-based Drug Discovery Market for Musculoskeletal Disorders, Historical Trends (Since 2023) and Forecasted Estimates (Till 2035) (USD Million)
- Table 27.98 AI-based Drug Discovery Market for Neurological Disorders, Historical Trends (Since 2023) and Forecasted Estimates (Till 2035) (USD Million)
- Table 27.99 AI-based Drug Discovery Market for Respiratory Disorders, Historical Trends (Since 2023) and Forecasted Estimates (Till 2035) (USD Million)
- Table 27.100 AI-based Drug Discovery Market: Distribution by End User
- Table 27.101 AI-based Drug Discovery Market for Pharma and Biotech Companies, Historical Trends (Since 2023) and Forecasted Estimates (Till 2035) (USD Million)
- Table 27.102 AI-based Drug Discovery Market for Contract Research Organizations, Historical Trends (Since 2023) and Forecasted Estimates (Till 2035) (USD Million)
- Table 27.103 AI-based Drug Discovery Market for Research and Academic Institutions, Historical Trends (Since 2023) and Forecasted Estimates (Till 2035) (USD Million)
- Table 27.104 AI-based Drug Discovery Market: Distribution by Geographical Regions
- Table 27.105 AI-based Drug Discovery Market in North America, Historical Trends (Since 2023) and Forecasted Estimates (Till 2035) (USD Million)
- Table 27.106 AI-based Drug Discovery Market in the US, Historical Trends (Since 2023) and Forecasted Estimates (Till 2035) (USD Million)
- Table 27.107 AI-based Drug Discovery Market in Canada, Historical Trends (Since 2023) and Forecasted Estimates (Till 2035) (USD Million)
- Table 27.108 AI-based Drug Discovery Market in Europe, Historical Trends (Since 2023) and Forecasted Estimates (Till 2035) (USD Million)
- Table 27.109 AI-based Drug Discovery Market in the UK, Historical Trends (Since 2023) and Forecasted Estimates (Till 2035) (USD Million)
- Table 27.110 AI-based Drug Discovery Market in Germany, Historical Trends (Since 2023) and Forecasted Estimates (Till 2035) (USD Million)
- Table 27.111 AI-based Drug Discovery Market in France, Historical Trends (Since 2023) and Forecasted Estimates (Till 2035) (USD Million)
- Table 27.112 AI-based Drug Discovery Market in Spain, Historical Trends (Since 2023) and Forecasted Estimates (Till 2035) (USD Million)
- Table 27.113 AI-based Drug Discovery Market in Italy, Historical Trends (Since 2023) and Forecasted Estimates (Till 2035) (USD Million)
- Table 27.114 AI-based Drug Discovery Market in Rest of Europe, Historical Trends (Since 2023) and Forecasted Estimates (Till 2035) (USD Million)
- Table 27.115 AI-based Drug Discovery Market in Asia-Pacific, Historical Trends (Since 2023) and Forecasted Estimates (Till 2035) (USD Million)
- Table 27.116 AI-based Drug Discovery Market in China, Historical Trends (Since 2023) and Forecasted Estimates (Till 2035) (USD Million)
- Table 27.117 AI-based Drug Discovery Market in Japan, Historical Trends (Since 2023) and Forecasted Estimates (Till 2035) (USD Million)
- Table 27.118 AI-based Drug Discovery Market in South Korea, Historical Trends (Since 2023) and Forecasted Estimates (Till 2035) (USD Million)
- Table 27.119 AI-based Drug Discovery Market in Australia, Historical Trends (Since 2023) and Forecasted Estimates (Till 2035) (USD Million)
- Table 27.120 AI-based Drug Discovery Market in India, Historical Trends (Since 2023) and Forecasted Estimates (Till 2035) (USD Million)
- Table 27.121 AI-based Drug Discovery Market in MENA, Historical Trends (Since 2023) and Forecasted Estimates (Till 2035) (USD Million)
- Table 27.122 AI-based Drug Discovery Market in Saudi Arabia, Historical Trends (Since 2023) and Forecasted Estimates (Till 2035) (USD Million)
- Table 27.123 AI-based Drug Discovery Market in UAE, Historical Trends (Since 2023) and Forecasted Estimates (Till 2035) (USD Million)
- Table 27.124 AI-based Drug Discovery Market in Egypt, Historical Trends (Since 2023) and Forecasted Estimates (Till 2035) (USD Million)
- Table 27.125 AI-based Drug Discovery Market in Latin America, Historical Trends (Since 2023) and Forecasted Estimates (Till 2035) (USD
Million)
- Table 27.126 AI-based Drug Discovery Market in Brazil, Historical Trends (Since 2023) and Forecasted Estimates (Till 2035) (USD Million)
- Table 27.127 AI-based Drug Discovery Market in Mexico, Historical Trends (Since 2023) and Forecasted Estimates (Till 2035) (USD Million)
- Table 27.128 AI-based Drug Discovery Market in Argentina, Historical Trends (Since 2023) and Forecasted Estimates (Till 2035) (USD Million)
List of Figures
- Figure 2.1 Research Methodology: Project Methodology
- Figure 2.2 Research Methodology: Data Sources for Secondary Research
- Figure 2.3 Research Methodology: Robust Quality Control
- Figure 3.1 Market Dynamics: Forecast Methodology
- Figure 3.2 Market Dynamics: Market Assessment Framework
- Figure 4.1 Lessons Learnt from Past Recessions
- Figure 5.1 Executive Summary: Overall Market Landscape
- Figure 5.2 Executive Summary: Market Trends
- Figure 5.3 Executive Summary: Market Forecast and Opportunity Analysis
- Figure 6.1 Subsets of AI
- Figure 6.2 Applications of AI in Healthcare
- Figure 6.3 Advantages of Using AI in Drug Discovery
- Figure 7.1 AI-based Drug Discovery Platform Providers: Distribution by Year of Establishment
- Figure 7.2 AI-based Drug Discovery Platform Providers: Distribution by Company Size
- Figure 7.3 AI-based Drug Discovery Platform Providers: Distribution by Location of Headquarters (Region)
- Figure 7.4 AI-based Drug Discovery Platform Providers: Distribution by Location of Headquarters (Country)
- Figure 7.5 Key AI-based Drug Discovery Platform Providers: Distribution by Type of Business Model
- Figure 7.6 Key AI-based Drug Discovery Platform Providers: Distribution by Platform Utilization
- Figure 7.7 Key AI-based Drug Discovery Platform Providers: Distribution by Drug Discovery Stages Supported
- Figure 7.8 Key AI-based Drug Discovery Platform Providers: Distribution by Type of AI Technology Used
- Figure 7.9 Key AI-based Drug Discovery Platform Providers: Distribution by Target Therapeutic Area
- Figure 7.10 Key AI-based Drug Discovery Platform Providers: Distribution by Type of Molecule Analyzed
- Figure 7.11 Key AI-based Drug Discovery Platform Providers: Distribution by End User
- Figure 11.1 Partnerships and Collaborations: Quarterly Trend of Partnerships
- Figure 11.2 Partnerships and Collaborations: Distribution by Type of Partnership
- Figure 11.3 Partnerships and Collaborations: Distribution by Quarter and Type of Partnership
- Figure 11.4 Partnerships and Collaborations: Distribution by Type of Partner
- Figure 11.5 Most Active Players: Distribution by Number of Partnerships
- Figure 11.6 Partnerships and Collaborations: Local and International Agreements
- Figure 11.7 Partnerships and Collaborations: Intracontinental and Intercontinental Agreements
- Figure 12.1 Funding and Investments Analysis: Quarterly Trend of Funding
- Figure 12.2 Funding and Investments Analysis: Quarterly Trend of Amount Invested (USD Million)
- Figure 12.3 Funding and Investment Analysis: Distribution of Instances by Type of Funding
- Figure 12.4 Funding and Investment Analysis: Distribution by Quarter and Type of Funding
- Figure 12.5 Funding and Investment Analysis: Distribution of Amount Invested by Type of Funding (USD Million)
- Figure 12.6 Funding and Investment Analysis: Distribution of Amount Invested by Quarter and Type of Funding
- Figure 12.7 Funding and Investment Analysis: Distribution by Geography (Region)
- Figure 12.8 Funding and Investment Analysis: Distribution by Geography (Country)
- Figure 12.9 Most Active Players: Distribution by Number of Funding Instances
- Figure 12.10 Most Active Players: Distribution by Amount Raised (USD Million)
- Figure 12.11 Leading Investors: Distribution by Number of Funding Instances
- Figure 13.1 Patent Analysis: Distribution by Type of Patent
- Figure 13.2 Patent Analysis: Cumulative Distribution by Patent Publication Year
- Figure 13.3 Patent Analysis: Distribution by Type of Patent and Publication Year
- Figure 13.4 Patent Analysis: Distribution by Patent Application Year
- Figure 13.5 Patent Analysis: Distribution by Patent Jurisdiction
- Figure 13.6 Patent Analysis Distribution by CPC Symbols
- Figure 13.7 Patent Analysis: Cumulative Distribution by Type of Applicant
- Figure 13.8 Leading Industry Players: Distribution by Number of Patents
- Figure 13.9 Leading Non-Industry Players: Distribution by Number of Patents
- Figure 13.10 Leading Individual Assignees: Distribution by Number of Patents
- Figure 13.11 Patent Benchmarking Analysis: Distribution of Patent Characteristics CPC Codes by Leading Industry Players
- Figure 13.12 Patent Benchmarking Analysis: Distribution of Leading Industry Players by Patent Characteristics CPC Codes
- Figure 13.13 Patent Analysis: Distribution by Patent Age
- Figure 13.14 AI-based Drug Discovery: Patent Valuation
- Figure 14.1 Key Elements of Porter's Five Forces
- Figure 14.2 Threat of New Entrants
- Figure 14.3 Bargaining Power of Buyers
- Figure 14.4 Bargaining Power of Solution Providers
- Figure 14.5 Threats of Substitute Products
- Figure 14.6 Rivalry Among Existing Competitors
- Figure 14.7 Porter's Five Forces Analysis: Concluding Remarks
- Figure 17.1 Overall Cost Saving Potential Associated with Use of AI-based Drug Discovery Platforms, Till 2035 (USD Billion)
- Figure 17.2 Cost Saving Potential: Distribution by Drug Discovery Steps (USD Billion)
- Figure 17.3 Cost Saving Potential in Target Identification/Validation, Till 2035 (USD Billion)
- Figure 17.4 Cost Saving Potential in Hit Generation/Lead Identification and Optimization, Till 2035 (USD Billion)
- Figure 17.5 Cost Saving Potential in Hit Generation/Lead Identification and Optimization, Till 2035 (USD Billion)
- Figure 17.6 Cost Saving Potential: Distribution by Type of AI Technology (USD Billion)
- Figure 17.7 Cost Saving Potential with Machine Learning, Till 2035 (USD Billion)
- Figure 17.8 Cost Saving Potential with Molecular Modelling and Simulation, Till 2035 (USD Billion)
- Figure 17.9 Cost Saving Potential with Deep Learning, Till 2035 (USD Billion)
- Figure 17.10 Cost Saving Potential with Omics Integration, Till 2035 (USD Billion)
- Figure 17.11 Cost Saving Potential with Generative Model, Till 2035 (USD Billion)
- Figure 17.12 Cost Saving Potential with Structure-Based Drug Design, Till 2035 (USD Billion)
- Figure 17.13 Cost Saving Potential with Other Technologies, Till 2035 (USD Billion)
- Figure 17.14 Cost Saving Potential: Distribution by Therapeutic Area (USD Billion)
- Figure 17.15 Cost Saving Potential in Drug Discovery for Oncological Disorders, Till 2035 (USD Billion)
- Figure 17.16 Cost Saving Potential in Drug Discovery for Cardiovascular Disorders, Till 2035 (USD Billion)
- Figure 17.17 Cost Saving Potential in Drug Discovery for Musculoskeletal Disorders, Till 2035 (USD Billion)
- Figure 17.18 Cost Saving Potential in Drug Discovery for Neurological Disorders, Till 2035 (USD Billion)
- Figure 17.19 Cost Saving Potential in Drug Discovery for Respiratory Disorders, Till 2035 (USD Billion)
- Figure 17.20 Cost Saving Potential in Drug Discovery for Immunological Disorders, Till 2035 (USD Billion)
- Figure 17.21 Cost Saving Potential in Drug Discovery for Gastrointestinal Disorders, Till 2035 (USD Billion)
- Figure 17.22 Cost Saving Potential in Drug Discovery for Endocrine Disorders, Till 2035 (USD Billion)
- Figure 17.23 Cost Saving Potential in Drug Discovery for Ophthalmological Disorders, Till 2035 (USD Billion)
- Figure 17.24 Cost Saving Potential in Drug Discovery for Blood Disorders, Till 2035 (USD Billion)
- Figure 17.25 Cost Saving Potential in Drug Discovery for Dermatological Disorders, Till 2035 (USD Billion)
- Figure 17.26 Cost Saving Potential in Drug Discovery for Infectious Diseases, Till 2035 (USD Billion)
- Figure 17.27 Cost Saving Potential in Drug Discovery for Urinary Disorders, Till 2035 (USD Billion)
- Figure 17.28 Cost Saving Potential: Distribution by End User (USD Billion)
- Figure 17.29 Cost Saving Potential for Pharma and Biotech Companies, Till 2035 (USD Billion)
- Figure 17.30 Cost Saving Potential for Contract Research Organizations (CRO), Till 2035 (USD Billion)
- Figure 17.31 Cost Saving Potential for Research and Academic Institutions, Till 2035 (USD Billion)
- Figure 17.32 Cost Saving Potential: Distribution by Geographical Regions (USD Billion)
- Figure 17.33 Cost Saving Potential in North America, Till 2035 (USD Billion)
- Figure 17.34 Cost Saving Potential in Europe, Till 2035 (USD Billion)
- Figure 17.35 Cost Saving Potential in Asia-Pacific, Till 2035 (USD Billion)
- Figure 17.36 Cost Saving Potential in MENA, Till 2035 (USD Billion)
- Figure 17.37 Cost Saving Potential in Latin America, Till 2035 (USD Billion)
- Figure 19.1 Global AI-based Drug Discovery Market, Historical Trends (Since 2023) and Forecasted Estimates (Till 2035) (USD Million)
- Figure 19.2 Global AI-based Drug Discovery Market, Forecasted Estimates (Till 2035), Conservative Scenario (USD Million)
- Figure 19.3 Global AI-based Drug Discovery Market, Forecasted Estimates (Till 2035), Optimistic Scenario (USD Million)
- Figure 20.1 AI-based Drug Discovery Market: Distribution by Drug Discovery Steps
- Figure 20.2 AI-based Drug Discovery Market for Target Identification / Validation, Historical Trends (Since 2023) and Forecasted Estimates (Till 2035) (USD Million)
- Figure 20.3 AI-based Drug Discovery Market for Hit Generation / Lead Identification, Historical Trends (Since 2023) and Forecasted Estimates (Till 2035) (USD Million)
- Figure 20.4 AI-based Drug Discovery Market for Lead Optimization, Historical Trends (Since 2023) and Forecasted Estimates (Till 2035) (USD Million)
- Figure 21.1 AI-based Drug Discovery Market: Distribution by Type of AI Technology
- Figure 21.2 AI-based Drug Discovery Market for Machine Learning, Historical Trends (Since 2023) and Forecasted Estimates (Till 2035) (USD Million)
- Figure 21.3 AI-based Drug Discovery Market for Molecular Modelling and Simulation, Historical Trends (Since 2023) and Forecasted Estimates (Till 2035) (USD Million)
- Figure 21.4 AI-based Drug Discovery Market for Deep Learning, Historical Trends (Since 2023) and Forecasted Estimates (Till 2035) (USD Million)
- Figure 21.5 AI-based Drug Discovery Market for Omics Integration, Historical Trends (Since 2023) and Forecasted Estimates (Till 2035) (USD Million)
- Figure 21.6 AI-based Drug Discovery Market for Generative Models, Historical Trends (Since 2023) and Forecasted Estimates (Till 2035) (USD Million)
- Figure 21.7 AI-based Drug Discovery Market for Structure-Based Drug Design, Historical Trends (Since 2023) and Forecasted Estimates (Till 2035) (USD Million)
- Figure 21.8 AI-based Drug Discovery Market for Others, Historical Trends (Since 2023) and Forecasted Estimates (Till 2035) (USD Million)
- Figure 22.1 AI-based Drug Discovery Market: Distribution by Therapeutic Area
- Figure 22.2 AI-based Drug Discovery Market for Oncological Disorders, Historical Trends (Since 2023) and Forecasted Estimates (Till 2035) (USD Million)
- Figure 22.3 AI-based Drug Discovery Market for Cardiovascular Disorders, Historical Trends (Since 2023) and Forecasted Estimates (Till 2035) (USD Million)
- Figure 22.4 AI-based Drug Discovery Market for Musculoskeletal Disorders, Historical Trends (Since 2023) and Forecasted Estimates (Till 2035) (USD Million)
- Figure 22.5 AI-based Drug Discovery Market for Neurological Disorders, Historical Trends (Since 2023) and Forecasted Estimates (Till 2035) (USD Million)
- Figure 22.6 AI-based Drug Discovery Market for Respiratory Disorders, Historical Trends (Since 2023) and Forecasted Estimates (Till 2035) (USD Million)
- Figure 22.7 AI-based Drug Discovery Market for Immunological Disorders, Historical Trends (Since 2023) and Forecasted Estimates (Till 2035) (USD Million)
- Figure 22.8 AI-based Drug Discovery Market for Gastrointestinal Disorders, Historical Trends (Since 2023) and Forecasted Estimates (Till 2035) (USD Million)
- Figure 22.9 AI-based Drug Discovery Market for Endocrine Disorders, Historical Trends (Since 2023) and Forecasted Estimates (Till 2035) (USD Million)
- Figure 22.10 AI-based Drug Discovery Market for Blood Disorders, Historical Trends (Since 2023) and Forecasted Estimates (Till 2035) (USD Million)
- Figure 22.11 AI-based Drug Discovery Market for Ophthalmological Disorders, Historical Trends (Since 2023) and Forecasted Estimates (Till 2035) (USD Million)
- Figure 22.12 AI-based Drug Discovery Market for Dermatological Disorders, Historical Trends (Since 2023) and Forecasted Estimates (Till 2035) (USD Million)
- Figure 22.13 AI-based Drug Discovery Market for Infectious Diseases, Historical Trends (Since 2023) and Forecasted Estimates (Till 2035) (USD Million)
- Figure 22.14 AI-based Drug Discovery Market for Urinary Disorders, Historical Trends (Since 2023) and Forecasted Estimates (Till 2035) (USD Million)
- Figure 23.1 AI-based Drug Discovery Market: Distribution by End User
- Figure 23.2 AI-based Drug Discovery Market for Pharma and Biotech Companies, Historical Trends (Since 2023) and Forecasted Estimates (Till 2035) (USD Million)
- Figure 23.3 AI-based Drug Discovery Market for Contract Research Organizations, Historical Trends (Since 2023) and Forecasted Estimates (Till 2035) (USD Million)
- Figure 23.4 AI-based Drug Discovery Market for Research and Academic Institutions, Historical Trends (Since 2023) and Forecasted Estimates (Till 2035) (USD Million)
- Figure 24.1 AI-based Drug Discovery Market: Distribution by Geographical Regions
- Figure 24.2 AI-based Drug Discovery Market in North America, Historical Trends (Since 2023) and Forecasted Estimates (Till 2035) (USD Million)
- Figure 24.3 AI-based Drug Discovery Market in the US, Historical Trends (Since 2023) and Forecasted Estimates (Till 2035) (USD Million)
- Figure 24.4 AI-based Drug Discovery Market in Canada, Historical Trends (Since 2023) and Forecasted Estimates (Till 2035) (USD Million)
- Figure 24.5 AI-based Drug Discovery Market in Europe, Historical Trends (Since 2023) and Forecasted Estimates (Till 2035) (USD Million)
- Figure 24.6 AI-based Drug Discovery Market in the UK, Historical Trends (Since 2023) and Forecasted Estimates (Till 2035) (USD Million)
- Figure 24.7 AI-based Drug Discovery Market in Germany, Historical Trends (Since 2023) and Forecasted Estimates (Till 2035) (USD Million)
- Figure 24.8 AI-based Drug Discovery Market in France, Historical Trends (Since 2023) and Forecasted Estimates (Till 2035) (USD Million)
- Figure 24.9 AI-based Drug Discovery Market in Spain, Historical Trends (Since 2023) and Forecasted Estimates (Till 2035) (USD Million)
- Figure 24.10 AI-based Drug Discovery Market in Italy, Historical Trends (Since 2023) and Forecasted Estimates (Till 2035) (USD Million)
- Figure 24.11 AI-based Drug Discovery Market in Rest of Europe, Historical Trends (Since 2023) and Forecasted Estimates (Till 2035) (USD Million)
- Figure 24.12 AI-based Drug Discovery Market in Asia-Pacific, Historical Trends (Since 2023) and Forecasted Estimates (Till 2035) (USD Million)
- Figure 24.13 AI-based Drug Discovery Market in China, Historical Trends (Since 2023) and Forecasted Estimates (Till 2035) (USD Million)
- Figure 24.14 AI-based Drug Discovery Market in Japan, Historical Trends (Since 2023) and Forecasted Estimates (Till 2035) (USD Million)
- Figure 24.15 AI-based Drug Discovery Market in South Korea, Historical Trends (Since 2023) and Forecasted Estimates (Till 2035) (USD Million)
- Figure 24.16 AI-based Drug Discovery Market in Australia, Historical Trends (Since 2023) and Forecasted Estimates (Till 2035) (USD Million)
- Figure 24.17 AI-based Drug Discovery Market in India, Historical Trends (Since 2023) and Forecasted Estimates (Till 2035) (USD Million)
- Figure 24.18 AI-based Drug Discovery Market in MENA, Historical Trends (Since 2023) and Forecasted Estimates (Till 2035) (USD Million)
- Figure 24.19 AI-based Drug Discovery Market in Saudi Arabia, Historical Trends (Since 2023) and Forecasted Estimates (Till 2035) (USD Million)
- Figure 24.20 AI-based Drug Discovery Market in UAE, Historical Trends (Since 2023) and Forecasted Estimates (Till 2035) (USD Million)
- Figure 24.21 AI-based Drug Discovery Market in Egypt, Historical Trends (Since 2023) and Forecasted Estimates (Till 2035) (USD Million)
- Figure 24.22 AI-based Drug Discovery Market in Latin America, Historical Trends (Since 2023) and Forecasted Estimates (Till 2035) (USD Million)
- Figure 24.23 AI-based Drug Discovery Market in Brazil, Historical Trends (Since 2023) and Forecasted Estimates (Till 2035) (USD Million)
- Figure 24.24 AI-based Drug Discovery Market in Mexico, Historical Trends (Since 2023) and Forecasted Estimates (Till 2035) (USD Million)
- Figure 24.25 AI-based Drug Discovery Market in Argentina, Historical Trends (Since 2023) and Forecasted Estimates (Till 2035) (USD Million)
- Figure 24.26 Market Movement Analysis: Geographical Regions
- Figure 24.27 Penetration-Growth (P-G) Matrix: Geographical Regions
- Figure 25.1 Concluding Remarks: Current Market Landscape
- Figure 25.2 Concluding Remarks: Partnerships and Collaborations
- Figure 25.3 Concluding Remarks: Funding and Investments
- Figure 25.4 Concluding Remarks: Patent Analysis
- Figure 25.6 Concluding Remarks: Market Forecast and Opportunity Analysis (I/II)
- Figure 25.7 Concluding Remarks: Market Forecast and Opportunity Analysis (II/II)

