
PUBLISHER: Roots Analysis | PRODUCT CODE: 2072255

PUBLISHER: Roots Analysis | PRODUCT CODE: 2072255
Small Scale Bioreactors Market : Industry Trends and Global Forecasts, Till 2035: Distribution by Capacity of Bioreactors, Type of Cell Culture, Mode of Operation, Type of Bioreactor, End-user, Scale of Operation, Geographical Regions and Key Players
Small Scale Bioreactors Market: Overview
As per Roots Analysis, the small scale bioreactors market is estimated to grow from USD 2,739 million in the current year to USD 5,796 million by 2035, at a CAGR of 8.68% during the forecast period, till 2035.
Small Scale Bioreactors Market: Growth and Trends
Biologics have increasingly gained prominence over time, driven by their strong therapeutic efficacy, favorable safety profiles, and capability to address a broad spectrum of disease indications that are often challenging to treat using conventional therapies. The clinical and commercial success of these products has further amplified market demand, prompting stakeholders to invest in the advancement and optimization of biologics manufacturing technologies.
Growing pressure to enhance productivity, improve operational flexibility, maximize profitability, and accelerate time-to-market has driven a transition from traditional manufacturing systems to more innovative production technologies. As a result, a range of advanced platforms and process analytical tools have been developed to streamline and expedite the overall manufacturing lifecycle.
A notable advancement in this domain is the increasing adoption of small-scale bioreactors, or microbioreactors, within modern biopharmaceutical manufacturing. These systems offer high-throughput capabilities for process development by enabling the rapid evaluation of multiple critical parameters essential for optimizing industrial bioprocesses. Furthermore, microbioreactors support the miniaturization of both mammalian and microbial cell culture processes, allowing for enhanced experimental throughput at comparatively lower costs. Collectively, these advantages contribute to reduced operational downtime and an increased number of production batches within a defined timeframe. The small-scale bioreactors market is poised for robust growth over the coming years, driven by increasing investments in biopharmaceutical research, the growing adoption of high-throughput process development platforms, and the rising demand for cost-effective bioprocess optimization solutions.
Growth Drivers: Strategic Enablers of Market Expansion
The small-scale bioreactors market is primarily driven by the growing demand for efficient and cost-effective bioprocess development solutions within the expanding biologics and biosimilars landscape. Increasing emphasis on accelerating drug development timelines and reducing time-to-market has encouraged biopharmaceutical companies to adopt high-throughput systems that enable rapid screening and optimization of multiple process parameters. Additionally, the rising need for operational flexibility and scalability, particularly in early-stage research and development, has further supported the adoption of small-scale bioreactors. Technological advancements, including automation, integration of process analytical technologies (PAT), and real-time monitoring capabilities, have enhanced process control and reproducibility, thereby improving overall productivity. Moreover, increasing investments in biopharmaceutical R&D, coupled with the growing trend toward personalized medicine and continuous manufacturing, continue to reinforce the adoption of small-scale bioreactor systems across both academic and industrial settings.
Market Challenges: Critical Barriers Impeding Progress
The small-scale bioreactors market faces several challenges that may hinder its widespread adoption despite its growing relevance in bioprocess development. A key limitation lies in the scalability of data, as results obtained from small-scale systems do not always accurately translate to large-scale commercial manufacturing, leading to potential inconsistencies and additional validation efforts. Furthermore, the high initial cost of advanced microbioreactor systems and associated automation technologies can restrict adoption, particularly among small and mid-sized organizations. Technical complexities related to system integration, calibration, and maintenance, along with the need for skilled personnel to operate and interpret experimental data, further add to operational constraints. In addition, challenges associated with optimizing culture media and replicating precise physiological conditions at a microscale can impact process reliability. Regulatory uncertainties and the lack of standardized protocols for small-scale systems also pose barriers, as companies must ensure compliance while maintaining efficiency in process development.
Small Scale Bioreactors Market: Key Insights
The report delves into the current state of the small scale bioreactors market and identifies potential growth opportunities within industry. Some key findings from the report include:
- At present, several companies are engaged in offering small scale bioreactors across the globe; over 40% of such companies are based in Asia-Pacific region.
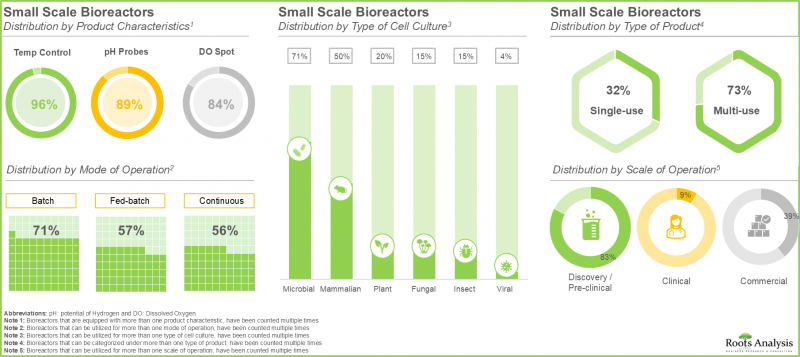
- More than 70% of the bioreactors are multi-use with majority of them operating in batch mode to process different types of cell cultures and monitor variety of product characteristics.
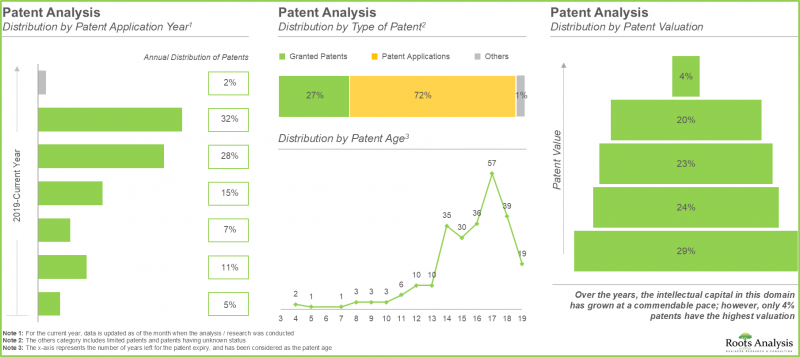
- Over the past few years, more than 300 patents have been filed by both industry and non-industry players to protect the intellectual property related to small scale bioreactors.
- More than 500 single-use upstream bioprocessing equipment are commercially available / being developed; notably, single use bioreactors are gaining traction for applicability across a variety of cell culture types.
- As a result of the growing interest in targeted therapies, personalized medicine coupled with focus on operational efficiency, the market for small scale bioreactors is anticipated to witness steady growth in the near future.
- Given the rising demand for biopharmaceuticals and biologics, the market for small scale bioreactors is anticipated to grow at an annualized rate (CAGR) of 8.87% till 2035.
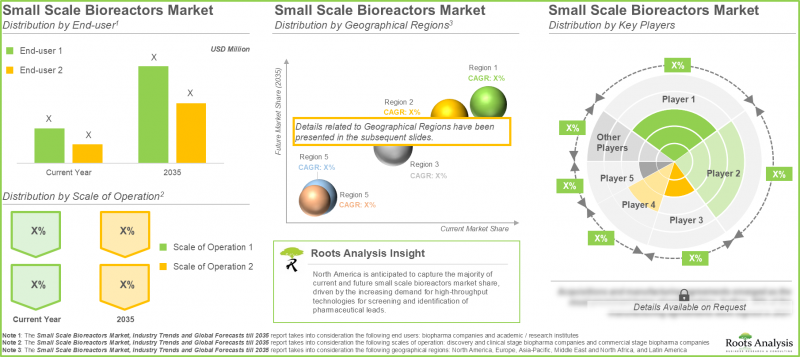
- At present, majority of the small scale bioreactors market is captured by biopharmaceutical end users; North America captures the largest share of the market.
- Given the rising demand for biologics, along with the rising R&D expenditure and technological advancements, the small scale bioreactor industry is well-positioned for future growth.
Small Scale Bioreactors Market
The market sizing and opportunity analysis has been segmented across the following parameters:
Capacity of Bioreactor
- Upto 300 mL
- 300mL-1L
- 1-3L
- 3-5L
- 5L-50L
- 50L-200L
Type of Cell Culture
- Mammalian
- Microbial
- Viral
- Insect
- Others
Mode of Operation
- Batch / Fed-batch
- Continuous
By Type of Bioreactor
- Single Use Bioreactors
- Stainless Bioreactors
- Glass Bioreactors
By End-user
- Biopharma Companies
- Academic / Research Institutes
Scale of Operation
- Discovery and Clinical Stage Biopharma Companies
- Commercial Stage Biopharma Companies
By Geographical Regions
- North America
- Europe
- Asia-Pacific
- Middle East and North Africa
- Latin America
Small Scale Bioreactors Market: Key Segments
Market Share by Bioreactor Capacity: 1-3 L Segment Leads the Market
According to market analysis, the 1-3 L bioreactor segment is projected to account for the largest share (~25%) in 2026 within the small-scale bioreactors market. This dominance can be attributed to the widespread use of bioreactors within this volume range for detailed experimental studies and pilot-scale production, enabling researchers to produce small batches, conduct rigorous testing, refine bioprocesses, and generate critical data for scale-up. Meanwhile, the <=300 mL segment is anticipated to witness the fastest growth (CAGR of 9.22%) over the forecast period, driven by its suitability for rapid perfusion-based process development and optimization of therapeutic antibody production.
Market Share by Cell Culture Type: Mammalian Culture Dominates the Small-Scale Bioreactors Market
Mammalian cell culture is estimated to hold the largest share (~35%) of the small-scale bioreactors market in the current year. This is primarily due to its essential role in the production of complex biologics, including recombinant glycoproteins that require precise post-translational modifications. Looking ahead, the viral culture sub-segment is expected to register a higher growth rate (CAGR of 13.05%) during the forecast period, supported by its increasing application in the development and scale-up of manufacturing processes for vaccines and gene therapies.
Market Share by Mode of Operation: Batch / Fed-Batch Remains Predominant in the Small Scale Bioreactors Market
The batch and fed-batch modes of operation currently dominate the market and are projected to account for approximately 90% of the total revenue share by 2035. The strong adoption of fed-batch systems is driven by their ability to maintain a controlled nutrient environment, thereby preventing the accumulation of inhibitory byproducts that can adversely affect cell growth. In contrast, the continuous manufacturing segment is expected to demonstrate notable growth (CAGR of 9.59%) over the forecast period, owing to its potential to reduce production costs through minimized downtime, streamlined processing steps, improved resource utilization, and lower contamination risks.
Top of Form
Bottom of Form
Example Players in Small Scale Bioreactors Market
- Biosan
- Bionet
- Cytiva
- Distek
- Eppendorf
- Merck Millipore
- Pall Corporation
- Sartorius
Small Scale Bioreactors Market: Research Coverage
- Market Sizing and Opportunity Analysis: The report features an in-depth analysis of the small scale bioreactors market, focusing on key market segments, including [A] capacity of bioreactors, [B] type of cell culture, [C] mode of operation, [D] type of bioreactor, [E] end-user, [F] scale of operation, and [G] geographical regions.
- Small Scale Bioreactors Market Landscape: A detailed assessment of the overall small scale bioreactors market landscape, along with information on several relevant parameters, such as [A] product characteristics, [B] mode of operation, [C] type of cell culture, [D] type of bioreactor, [E] type of fabrication material, [F] scale of operation, [G] application area, [H] type of process development, [I] end-user, [J] total volume, [K] company size and [L] location of headquarters.
- Company Competitiveness Analysis: An in-depth competitiveness analysis of various small scale bioreactors based on various relevant parameters, such as [A] supplier strength, and [B] portfolio strength.
- Company Profiles: In-depth profiles of key companies based in North America, Europe and Asia-Pacific based on several parameters such as [A] year of establishment, [B] location of headquarters, [C] product portfolio, [D] recent developments and [E] an informed future outlook.
- Patent Analysis: A detailed analysis of the patents that have been filed / granted based on important parameters such as, [A] type of patent, [B] publication year, [C] application year, [D] number of granted patents and patent applications, [E] patent jurisdiction, [F] CPC symbols, [G] patent age, [H] type of applicant, and [I] individual patent assignees (in terms of size of intellectual property portfolio).
- Case Study: A case study on single-use bioreactors, featuring information on a number of relevant parameters, such as [A] scale of operation, [B] type of cell culture system, [C] type of cell culture, [D] type of molecule, [E] key features, [F] application area and [G] end users. In addition, it also presents details of the companies developing single-use bioreactors, along with information on their year of establishment, company size, and location of headquarters.
- Market Impact Analysis: An in-depth analysis of the factors that can impact the growth of the market. It also features identification and analysis of key drivers, potential restraints, emerging opportunities, and existing challenges in this domain.
Key Questions Answered in this Report
- Which are the leading companies in the small-scale bioreactors market?
- Which region dominates the small-scale bioreactors market?
- What are the key trends observed in the small-scale bioreactors market?
- What factors are likely to influence the evolution of this market?
- What are the primary challenges faced by small-scale bioreactor manufacturers?
- What is the current and future market size?
- What is the CAGR of this market?
- How is the current and future market opportunity likely to be distributed across key market segments?
Reasons to Buy this Report
- The report provides a comprehensive market analysis, offering detailed revenue projections of the overall market and its specific sub-segments. This information is valuable to both established market leaders and emerging entrants.
- The report offers stakeholders a comprehensive overview of the market, including key drivers, barriers, opportunities, and challenges. This information empowers stakeholders to stay abreast of market trends and make data-driven decisions to capitalize on growth prospects.
- The report can aid businesses in identifying future opportunities in any sector. It also helps in understanding if those opportunities are worth pursuing.
- The report helps in identifying customer demand by understanding the needs, preferences, and behavior of the target audience in order to tailor products or services effectively.
- The report equips new entrants with requisite information regarding a particular market to help them build successful business strategies.
- The report allows for more effective communication with the audience and in building strong business relations.
Additional Benefits
- Complementary PPT Insights Pack
- Complimentary Excel Data Packs for all Analytical Modules in the Report
- 15% Free Content Customization
- Detailed Report Walkthrough Session with Research Team
- Free Updated report if the report is 6-12 months old or older
TABLE OF CONTENTS
1. PREFACE
- 1.1. Introduction
- 1.2. Market Share Insights
- 1.3. Key Market Insights
- 1.4. Report Coverage
- 1.5. Key Questions Answered
- 1.6. Chapter Outlines
2. RESEARCH METHODOLOGY
- 2.1. Chapter Overview
- 2.2. Research Assumptions
- 2.2.1. Market Landscape and Market Trends
- 2.2.2. Market Forecast and Opportunity Analysis
- 2.2.3. Comparative Analysis
- 2.3. Database Building
- 2.3.1. Data Collection
- 2.3.2. Data Validation
- 2.3.3. Data Analysis
- 2.4. Project Methodology
- 2.4.1. Secondary Research
- 2.4.1.1. Annual Reports
- 2.4.1.2. Academic Research Papers
- 2.4.1.3. Company Websites
- 2.4.1.4. Investor Presentations
- 2.4.1.5. Regulatory Filings
- 2.4.1.6. White Papers
- 2.4.1.7. Industry Publications
- 2.4.1.8. Conferences and Seminars
- 2.4.1.9. Government Portals
- 2.4.1.10. Media and Press Releases
- 2.4.1.11. Newsletters
- 2.4.1.12. Industry Databases
- 2.4.1.13. Roots Proprietary Databases
- 2.4.1.14. Paid Databases and Sources
- 2.4.1.15. Social Media Portals
- 2.4.1.16. Other Secondary Sources
- 2.4.2. Primary Research
- 2.4.2.1. Types of Primary Research
- 2.4.2.1.1. Qualitative Research
- 2.4.2.1.2. Quantitative Research
- 2.4.2.1.3. Hybrid Approach
- 2.4.2.2. Advantages of Primary Research
- 2.4.2.3. Techniques for Primary Research
- 2.4.2.3.1. Interviews
- 2.4.2.3.2. Surveys
- 2.4.2.3.3. Focus Groups
- 2.4.2.3.4. Observational Research
- 2.4.2.3.5. Social Media Interactions
- 2.4.2.4. Key Opinion Leaders Considered in Primary Research
- 2.4.2.4.1. Company Executives (CXOs)
- 2.4.2.4.2. Board of Directors
- 2.4.2.4.3. Company Presidents and Vice Presidents
- 2.4.2.4.4. Research and Development Heads
- 2.4.2.4.5. Technical Experts
- 2.4.2.4.6. Subject Matter Experts
- 2.4.2.4.7. Scientists
- 2.4.2.4.8. Doctors and Other Healthcare Providers
- 2.4.2.5. Ethics and Integrity
- 2.4.2.5.1. Research Ethics
- 2.4.2.5.2. Data Integrity
- 2.4.2.1. Types of Primary Research
- 2.4.3. Analytical Tools and Databases
- 2.4.1. Secondary Research
- 2.5. Robust Quality Control
3. MARKET DYNAMICS
- 3.1. Chapter Overview
- 3.2. Forecast Methodology
- 3.2.1. Top-down Approach
- 3.2.2. Bottom-up Approach
- 3.2.3. Hybrid Approach
- 3.3. Market Assessment Framework
- 3.3.1. Total Addressable Market (TAM)
- 3.3.2. Serviceable Addressable Market (SAM)
- 3.3.3. Serviceable Obtainable Market (SOM)
- 3.3.4. Currently Acquired Market (CAM)
- 3.4. Forecasting Tools and Techniques
- 3.4.1. Qualitative Forecasting
- 3.4.2. Correlation
- 3.4.3. Regression
- 3.4.4. Extrapolation
- 3.4.5. Convergence
- 3.4.6. Sensitivity Analysis
- 3.4.7. Scenario Planning
- 3.4.8. Data Visualization
- 3.4.9. Time Series Analysis
- 3.4.10. Forecast Error Analysis
- 3.5. Key Considerations
- 3.5.1. Demographics
- 3.5.2. Government Regulations
- 3.5.3. Reimbursement Scenarios
- 3.5.4. Market Access
- 3.5.5. Supply Chain
- 3.5.6. Industry Consolidation
- 3.5.7. Pandemic / Unforeseen Disruptions Impact
- 3.6. Limitations
4. MACRO-ECONOMIC INDICATORS
- 4.1. Chapter Overview
- 4.2. Market Dynamics
- 4.2.1. Time Period
- 4.2.1.1. Historical Trends
- 4.2.1.2. Current and Forecasted Estimates
- 4.2.2. Currency Coverage
- 4.2.2.1. Major Currencies Affecting the Market
- 4.2.2.2. Factors Affecting Currency Fluctuations
- 4.2.2.3. Impact of Currency Fluctuations on the Industry
- 4.2.3. Foreign Currency Exchange Rate
- 4.2.3.1. Impact of Foreign Exchange Rate Volatility on the Market
- 4.2.3.2. Strategies for Mitigating Foreign Exchange Risk
- 4.2.4. Recession
- 4.2.4.1. Assessment of Current Economic Conditions and Potential Impact on the Market
- 4.2.4.2. Historical Analysis of Past Recessions and Lessons Learnt
- 4.2.5. Inflation
- 4.2.5.1. Measurement and Analysis of Inflationary Pressures in the Economy
- 4.2.5.2. Potential Impact of Inflation on the Market Evolution
- 4.2.6. Interest Rates
- 4.2.6.1. Interest Rates and Their Impact on the Market
- 4.2.6.2. Strategies for Managing Interest Rate Risk
- 4.2.7. Commodity Flow Analysis
- 4.2.7.1. Type of Commodity
- 4.2.7.2. Origins and Destinations
- 4.2.7.3. Values and Weights
- 4.2.7.4. Modes of Transportation
- 4.2.8. Global Trade Dynamics
- 4.2.8.1. Import Scenario
- 4.2.8.2. Export Scenario
- 4.2.8.3. Trade Policies
- 4.2.8.4. Strategies for Mitigating the Risks Associated with Trade Barriers
- 4.2.8.5. Impact of Trade Barriers on the Market
- 4.2.9. War Impact Analysis
- 4.2.9.1. Russian-Ukraine War
- 4.2.9.2. Israel-Hamas War
- 4.2.10. COVID Impact / Related Factors
- 4.2.10.1. Global Economic Impact
- 4.2.10.2. Industry-specific Impact
- 4.2.10.3. Government Response and Stimulus Measures
- 4.2.10.4. Future Outlook and Adaptation Strategies
- 4.2.11. Other Indicators
- 4.2.11.1. Fiscal Policy
- 4.2.11.2. Consumer Spending
- 4.2.11.3. Gross Domestic Product (GDP)
- 4.2.11.4. Employment
- 4.2.11.5. Taxes
- 4.2.11.6. Stock Market Performance
- 4.2.11.7. Cross-Border Dynamics
- 4.2.1. Time Period
- 4.3. Conclusion
5. EXECUTIVE SUMMARY
6. INTRODUCTION
- 6.1. Chapter Overview
- 6.2. Overview of Small Scale Bioreactors
- 6.2.1. Types of Small Scale Bioreactors
- 6.3. Advantages of Small Scale Bioreactors
- 6.4. Fabrication Materials for Small Scale Bioreactors
- 6.5. Future Perspectives
7. MARKET LANDSCAPE
- 7.1. Chapter Overview
- 7.2. Small Scale Bioreactors: Overall Market Landscape
- 7.2.1. Analysis by Minimum Working Volume
- 7.2.2. Analysis by Maximum Working Volume
- 7.2.3. Analysis by Stirrer Speed
- 7.2.4. Analysis by Mode of Operations
- 7.2.5. Analysis by Usability
- 7.2.6. Analysis by Parameters Controlled
- 7.3. Small Scale Bioreactors Manufacturers: List of Developers
- 7.3.1. Analysis by Year of Establishment
- 7.3.2. Analysis by Company Size
- 7.3.3. Analysis by Year of Establishment and Company Size
- 7.3.4. Analysis by Location of Headquarters
- 7.3.5. Leading Manufacturers: Analysis by Number of Products
8. PRODUCT COMPETITIVENESS ANALYSIS
- 8.1. Chapter Overview
- 8.2. Assumptions and Key Parameters
- 8.3. Methodology
- 8.4. Product Competitiveness Analysis: Small Scale Bioreactors
- 8.4.1. Small Scale Bioreactors Offered by Players based in North America
- 8.4.2. Small Scale Bioreactors Offered by Players based in Europe
- 8.4.3. Small Scale Bioreactors Offered by Players based in Asia-Pacific
9. COMPANY PROFILES
- 9.1. Chapter Overview
- 9.2. Bionet
- 9.2.1. Company Overview
- 9.2.2. Product Portfolio
- 9.2.3 Recent Developments and Future Outlook
- 9.3. Biosan
- 9.4. Cytiva
- 9.5. Distek
- 9.6. Eppendorf
- 9.7. Merck Millipore
- 9.8. Pall Corporation
- 9.9. Sartorius
10. PATENT ANALYSIS
- 10.1. Chapter Overview
- 10.2. Scope and Methodology
- 10.3. Small Scale Bioreactors: Patent Analysis
- 10.3.1. Analysis by Patent Publication Year
- 10.3.2. Analysis by Type of Patent and Publication Year
- 10.3.3. Analysis by Patent Application Year
- 10.3.4. Analysis by Patent Jurisdiction
- 10.3.5. Analysis by CPC Symbols
- 10.3.6. Analysis by Type of Applicant
- 10.3.7. Leading Industry Players: Analysis by Number of Patents
- 10.3.8. Leading Non-Industry Players: Analysis by Number of Patents
- 10.4. Patent Benchmarking Analysis
- 10.4.1. Analysis by Patent Characteristics
- 10.5. Patent Valuation
- 10.6. Leading Patents by Number of Citations
11. CASE STUDY: SINGLE USE BIOREACTORS
- 11.1. Chapter Overview
- 11.2. Single Use Bioreactors: List of Products
- 11.2.1. Analysis by Type of Bioreactor
- 11.2.2. Analysis by Scale of Operation
- 11.2.3. Analysis by Type of Cell Culture System
- 11.2.4. Analysis by Type of Cell Culture
- 11.2.5. Analysis by Type of Molecule Processed
- 11.2.6. Analysis by Key Features
- 11.2.7. Analysis by Application Area
- 11.2.8. Analysis by End Users
- 11.2.9. Analysis by Working Volume
- 11.3. Single Use Bioreactor Developers: Overall Market Landscape
- 11.3.1. Analysis by Year of Establishment
- 11.3.2. Analysis by Company Size
- 11.3.3. Analysis by Location of Headquarters
- 11.3.4. Leading Developers: Analysis by Number of Single Use Bioreactors
12. GLOBAL SMALL SCALE BIOREACTORS MARKET
- 12.1. Chapter Overview
- 12.2. Assumptions and Methodology
- 12.3. Global Small Scale Bioreactors Market, Historical Trends (Since 2021) and Forecasted Estimates (Till 2035)
- 12.3.1. Scenario Analysis
- 12.3.1.1. Conservative Scenario
- 12.3.1.2. Optimistic Scenario
- 12.3.1. Scenario Analysis
- 12.4. Key Market Segmentations
13. SMALL SCALE BIOREACTORS MARKET, BY CAPACITY OF BIOREACTORS
- 13.1. Chapter Overview
- 13.2. Key Assumptions and Methodology
- 13.3. Small Scale Bioreactors Market: Distribution by Capacity of Bioreactors
- 13.3.1. Small Scale Bioreactors Market for Upto 300 mL, Historical Trends (Since 2021) and Forecasted Estimates (Till 2035)
- 13.3.2. Small Scale Bioreactors Market for 300 mL-1L, Historical Trends (Since 2021) and Forecasted Estimates (Till 2035)
- 13.3.3. Small Scale Bioreactors Market for 1-3L, Historical Trends (Since 2021) and Forecasted Estimates (Till 2035)
- 13.3.4. Small Scale Bioreactors Market for 3-5L, Historical Trends (Since 2021) and Forecasted Estimates (Till 2035)
- 13.3.5. Small Scale Bioreactors Market for 5-50L, Historical Trends (Since 2021) and Forecasted Estimates (Till 2035)
- 13.3.6. Small Scale Bioreactors Market for 50-200L, Historical Trends (Since 2021) and Forecasted Estimates (Till 2035)
- 13.4. Data Triangulation and Validation
14. SMALL SCALE BIOREACTORS MARKET, BY TYPE OF CELL CULTURE
- 14.1. Chapter Overview
- 14.2. Key Assumptions and Methodology
- 14.3. Small Scale Bioreactors Market: Distribution by Type of Cell Culture
- 14.3.1. Small Scale Bioreactors Market for Mammalian Culture, Historical Trends (Since 2021) and Forecasted Estimates (Till 2035)
- 14.3.2. Small Scale Bioreactors Market for Microbial Culture, Historical Trends (Since 2021) and Forecasted Estimates (Till 2035)
- 14.3.3. Small Scale Bioreactors Market for Viral Culture, Historical Trends (Since 2021) and Forecasted Estimates (Till 2035)
- 14.3.4. Small Scale Bioreactors Market for Insect Culture, Historical Trends (Since 2021) and Forecasted Estimates (Till 2035)
- 14.3.5. Small Scale Bioreactors Market for Others, Historical Trends (Since 2021) and Forecasted Estimates (Till 2035)
- 14.4. Data Triangulation and Validation
15. SMALL SCALE BIOREACTORS MARKET, BY MODE OF OPERATION
- 15.1. Chapter Overview
- 15.2. Key Assumptions and Methodology
- 15.3. Small Scale Bioreactors Market: Distribution by Mode of Operation
- 15.3.1. Small Scale Bioreactors Market for Batch / Fed-batch, Historical Trends (Since 2021) and Forecasted Estimates (Till 2035)
- 15.3.2. Small Scale Bioreactors Market for Continuous, Historical Trends (Since 2021) and Forecasted Estimates (Till 2035)
- 15.4. Data Triangulation and Validation
16. SMALL SCALE BIOREACTORS MARKET, BY TYPE OF BIOREACTOR
- 16.1. Chapter Overview
- 16.2. Key Assumptions and Methodology
- 16.3. Small Scale Bioreactors Market: Distribution by Type of Bioreactor
- 16.3.1. Small Scale Bioreactors Market for Single Use Bioreactors, Historical Trends (Since 2021) and Forecasted Estimates (Till 2035)
- 16.3.2. Small Scale Bioreactors Market for Stainless Steel Bioreactors, Historical Trends (Since 2021) and Forecasted Estimates (Till 2035)
- 16.3.3. Small Scale Bioreactors Market for Glass Bioreactors, Historical Trends (Since 2021) and Forecasted Estimates (Till 2035)
- 16.4. Data Triangulation and Validation
17. SMALL SCALE BIOREACTORS MARKET, BY END-USER
- 17.1. Chapter Overview
- 17.2. Key Assumptions and Methodology
- 17.3. Small Scale Bioreactors Market: Distribution by End-user
- 17.3.1. Small Scale Bioreactors Market for Biopharma Companies, Historical Trends (Since 2021) and Forecasted Estimates (Till 2035)
- 17.3.1.1. Biopharma Companies Small Scale Bioreactors Market for Discovery and Clinical Stage, Historical Trends (Since 2021) and Forecasted Estimates (Till 2035)
- 17.3.1.2. Biopharma Companies Small Scale Bioreactors Market for Commercial Stage, Historical Trends (Since 2021) and Forecasted Estimates (Till 2035)
- 17.3.2. Small Scale Bioreactors Market for Academic / Research Institutes, Historical Trends (Since 2021) and Forecasted Estimates (Till 2035)
- 17.3.1. Small Scale Bioreactors Market for Biopharma Companies, Historical Trends (Since 2021) and Forecasted Estimates (Till 2035)
- 17.4. Data Triangulation and Validation
18. SMALL SCALE BIOREACTORS MARKET, BY GEOGRAPHICAL REGIONS
- 18.1. Chapter Overview
- 18.2. Key Assumptions and Methodology
- 18.3. Small Scale Bioreactors Market: Distribution by Geographical Regions
- 18.3.1. Small Scale Bioreactors Market in North America, Historical Trends (Since 2021) and Forecasted Estimates (Till 2035)
- 18.3.2. Small Scale Bioreactors Market in Europe, Historical Trends (Since 2021) and Forecasted Estimates (Till 2035)
- 18.3.3. Small Scale Bioreactors Market in Asia-Pacific, Historical Trends (Since 2021) and Forecasted Estimates (Till 2035)
- 18.3.4. Small Scale Bioreactors Market in Middle East and North Africa, Historical Trends (Since 2021) and Forecasted Estimates (Till 2035)
- 18.3.5. Small Scale Bioreactors Market in Latin America, Historical Trends (Since 2021) and Forecasted Estimates (Till 2035)
- 18.4. Data Triangulation and Validation
19. MARKET OPPORTUNITY ANALYSIS: NORTH AMERICA
- 19.1. Small Scale Bioreactors Market in North America: Distribution by Capacity of Bioreactors
- 19.1.1. Small Scale Bioreactors Market in North America for Upto 300 mL, Historical Trends (Since 2021) and Forecasted Estimates (Till 2035)
- 19.1.2. Small Scale Bioreactors Market in North America for 300 mL- 1L, Historical Trends (Since 2021) and Forecasted Estimates (Till 2035)
- 19.1.3. Small Scale Bioreactors Market in North America for 1-3L, Historical Trends (Since 2021) and Forecasted Estimates (Till 2035)
- 19.1.4. Small Scale Bioreactors Market in North America for 3-5L, Historical Trends (Since 2021) and Forecasted Estimates (Till 2035)
- 19.1.5. Small Scale Bioreactors Market in North America for 5-50L, Historical Trends (Since 2021) and Forecasted Estimates (Till 2035)
- 19.1.6. Small Scale Bioreactors Market in North America for 50-200L, Historical Trends (Since 2021) and Forecasted Estimates (Till 2035)
- 19.2. Small Scale Bioreactors Market in North America: Distribution by Type of Cell Culture
- 19.2.1. Small Scale Bioreactors Market in North America for Mammalian Culture, Historical Trends (Since 2021) and Forecasted Estimates (Till 2035)
- 19.2.2. Small Scale Bioreactors Market in North America for Microbial Culture, Historical Trends (Since 2021) and Forecasted Estimates (Till 2035)
- 19.2.3. Small Scale Bioreactors Market in North America for Viral Culture, Historical Trends (Since 2021) and Forecasted Estimates (Till 2035)
- 19.2.4. Small Scale Bioreactors Market in North America for Insect Culture, Historical Trends (Since 2021) and Forecasted Estimates (Till 2035)
- 19.2.5. Small Scale Bioreactors Market in North America for Others, Historical Trends (Since 2021) and Forecasted Estimates (Till 2035)
- 19.3. Small Scale Bioreactors Market in North America: Distribution by Mode of Operation
- 19.3.1. Small Scale Bioreactors Market in North America for batch / Fed-batch, Historical Trends (Since 2021) and Forecasted Estimates (Till 2035)
- 19.3.2. Small Scale Bioreactors Market in North America for Continuous, Historical Trends (Since 2021) and Forecasted Estimates (Till 2035)
- 19.4. Small Scale Bioreactors Market in North America: Distribution by Type of Bioreactor
- 19.4.1. Small Scale Bioreactors Market in North America for Single Use Bioreactors, Historical Trends (Since 2021) and Forecasted Estimates (Till 2035)
- 19.4.2. Small Scale Bioreactors Market in North America for Stainless Steel Bioreactors, Historical Trends (Since 2021) and Forecasted Estimates (Till 2035)
- 19.4.3. Small Scale Bioreactors Market in North America for Glass Bioreactors, Historical Trends (Since 2021) and Forecasted Estimates (Till 2035)
- 19.5. Small Scale Bioreactors Market in North America: Distribution by End-user
- 19.5.1. Small Scale Bioreactors Market in North America for Biopharma Companies, Historical Trends (Since 2021) and Forecasted Estimates (Till 2035)
- 19.5.1.1. Biopharma Companies Small Scale Bioreactors Market in North America for Discovery and Clinical stage, Historical Trends (Since 2021) and Forecasted Estimates (Till 2035)
- 19.5.1.2. Biopharma Companies Small Scale Bioreactors Market in North America for Commercial stage, Historical Trends (Since 2021) and Forecasted Estimates (Till 2035)
- 19.5.2. Small Scale Bioreactors Market in North America for Academic / Research Institutes, Historical Trends (Since 2021) and Forecasted Estimates (Till 2035)
- 19.5.1. Small Scale Bioreactors Market in North America for Biopharma Companies, Historical Trends (Since 2021) and Forecasted Estimates (Till 2035)
20. MARKET OPPORTUNITY ANALYSIS: EUROPE
- 20.1. Small Scale Bioreactors Market in Europe: Distribution by Capacity of Bioreactors
- 20.1.1. Small Scale Bioreactors Market in Europe for Upto 300 mL, Historical Trends (Since 2021) and Forecasted Estimates (Till 2035)
- 20.1.2. Small Scale Bioreactors Market in Europe for 300 mL- 1L, Historical Trends (Since 2021) and Forecasted Estimates (Till 2035)
- 20.1.3. Small Scale Bioreactors Market in Europe for 1-3L, Historical Trends (Since 2021) and Forecasted Estimates (Till 2035)
- 20.1.4. Small Scale Bioreactors Market in Europe for 3-5L, Historical Trends (Since 2021) and Forecasted Estimates (Till 2035)
- 20.1.5. Small Scale Bioreactors Market in Europe for 5-50L, Historical Trends (Since 2021) and Forecasted Estimates (Till 2035)
- 20.1.6. Small Scale Bioreactors Market in Europe for 50-200L, Historical Trends (Since 2021) and Forecasted Estimates (Till 2035)
- 20.2. Small Scale Bioreactors Market in Europe: Distribution by Type of Cell Culture
- 20.2.1. Small Scale Bioreactors Market in Europe for Mammalian Culture, Historical Trends (Since 2021) and Forecasted Estimates (Till 2035)
- 20.2.2. Small Scale Bioreactors Market in Europe for Microbial Culture, Historical Trends (Since 2021) and Forecasted Estimates (Till 2035)
- 20.2.3. Small Scale Bioreactors Market in Europe for Viral Culture, Historical Trends (Since 2021) and Forecasted Estimates (Till 2035)
- 20.2.4. Small Scale Bioreactors Market in Europe for Insect Culture, Historical Trends (Since 2021) and Forecasted Estimates (Till 2035)
- 20.2.5. Small Scale Bioreactors Market in Europe for Others, Historical Trends (Since 2021) and Forecasted Estimates (Till 2035)
- 20.3. Small Scale Bioreactors Market in Europe: Distribution by Mode of Operation
- 20.3.1. Small Scale Bioreactors Market in Europe for batch / Fed-batch, Historical Trends (Since 2021) and Forecasted Estimates (Till 2035)
- 20.3.2. Small Scale Bioreactors Market in Europe for Continuous, Historical Trends (Since 2021) and Forecasted Estimates (Till 2035)
- 20.4. Small Scale Bioreactors Market in Europe: Distribution by Type of Bioreactor
- 20.4.1. Small Scale Bioreactors Market in Europe for Single Use Bioreactors, Historical Trends (Since 2021) and Forecasted Estimates (Till 2035)
- 20.4.2. Small Scale Bioreactors Market in Europe for Stainless Steel Bioreactors, Historical Trends (Since 2021) and Forecasted Estimates (Till 2035)
- 20.4.3. Small Scale Bioreactors Market in Europe for Glass Bioreactors, Historical Trends (Since 2021) and Forecasted Estimates (Till 2035)
- 20.5. Small Scale Bioreactors Market in Europe: Distribution by End-user
- 20.5.1. Small Scale Bioreactors Market in Europe for Biopharma Companies, Historical Trends (Since 2021) and Forecasted Estimates (Till 2035)
- 20.5.1.1. Biopharma Companies Small Scale Bioreactors Market in Europe for Discovery and Clinical stage, Historical Trends (Since 2021) and Forecasted Estimates (Till 2035)
- 20.5.1.2. Biopharma Companies Small Scale Bioreactors Market in Europe for Commercial stage, Historical Trends (Since 2021) and Forecasted Estimates (Till 2035)
- 20.5.2. Small Scale Bioreactors Market in Europe for Academic / Research Institutes, Historical Trends (Since 2021) and Forecasted Estimates (Till 2035)
- 20.5.1. Small Scale Bioreactors Market in Europe for Biopharma Companies, Historical Trends (Since 2021) and Forecasted Estimates (Till 2035)
21. MARKET OPPORTUNITY ANALYSIS: ASIA-PACIFIC
- 21.1. Small Scale Bioreactors Market in Asia-Pacific: Distribution by Capacity of Bioreactors
- 21.1.1. Small Scale Bioreactors Market in Asia-Pacific for Upto 300 mL, Historical Trends (Since 2021) and Forecasted Estimates (Till 2035)
- 21.1.2. Small Scale Bioreactors Market in Asia-Pacific for 300 mL- 1L, Historical Trends (Since 2021) and Forecasted Estimates (Till 2035)
- 21.1.3. Small Scale Bioreactors Market in Asia-Pacific for 1-3L, Historical Trends (Since 2021) and Forecasted Estimates (Till 2035)
- 21.1.4. Small Scale Bioreactors Market in Asia-Pacific for 3-5L, Historical Trends (Since 2021) and Forecasted Estimates (Till 2035)
- 21.1.5. Small Scale Bioreactors Market in Asia-Pacific for 5-50L, Historical Trends (Since 2021) and Forecasted Estimates (Till 2035)
- 21.1.6. Small Scale Bioreactors Market in Asia-Pacific for 50-200L, Historical Trends (Since 2021) and Forecasted Estimates (Till 2035)
- 21.2. Small Scale Bioreactors Market in Asia-Pacific: Distribution by Type of Cell Culture
- 21.2.1. Small Scale Bioreactors Market in Asia-Pacific for Mammalian Culture, Historical Trends (Since 2021) and Forecasted Estimates (Till 2035)
- 21.2.2. Small Scale Bioreactors Market in Asia-Pacific for Microbial Culture, Historical Trends (Since 2021) and Forecasted Estimates (Till 2035)
- 21.2.3. Small Scale Bioreactors Market in Asia-Pacific for Viral Culture, Historical Trends (Since 2021) and Forecasted Estimates (Till 2035)
- 21.2.4. Small Scale Bioreactors Market in Asia-Pacific for Insect Culture, Historical Trends (Since 2021) and Forecasted Estimates (Till 2035)
- 21.2.5. Small Scale Bioreactors Market in Asia-Pacific for Others, Historical Trends (Since 2021) and Forecasted Estimates (Till 2035)
- 21.3. Small Scale Bioreactors Market in Asia-Pacific: Distribution by Mode of Operation
- 21.3.1. Small Scale Bioreactors Market in Asia-Pacific for Batch / Fed-batch, Historical Trends (Since 2021) and Forecasted Estimates (Till 2035)
- 21.3.2. Small Scale Bioreactors Market in Asia-Pacific for Continuous, Historical Trends (Since 2021) and Forecasted Estimates (Till 2035)
- 21.4. Small Scale Bioreactors Market in Asia-Pacific: Distribution by Type of Bioreactor
- 21.4.1. Small Scale Bioreactors Market in Asia-Pacific for Single Use Bioreactors, Historical Trends (Since 2021) and Forecasted Estimates (Till 2035)
- 21.4.2. Small Scale Bioreactors Market in Asia-Pacific for Stainless Steel Bioreactors, Historical Trends (Since 2021) and Forecasted Estimates (Till 2035)
- 21.4.3. Small Scale Bioreactors Market in Asia-Pacific for Glass Bioreactors, Historical Trends (Since 2021) and Forecasted Estimates (Till 2035)
- 21.5. Small Scale Bioreactors Market in Asia-Pacific: Distribution by End-user
- 21.5.1. Small Scale Bioreactors Market in Asia-Pacific for Biopharma Companies, Historical Trends (Since 2021) and Forecasted Estimates (Till 2035)
- 21.5.1.1. Biopharma Companies Small Scale Bioreactors Market in Asia-Pacific for Discovery and Clinical stage, Historical Trends (Since 2021) and Forecasted Estimates (Till 2035)
- 21.5.1.2. Biopharma Companies Small Scale Bioreactors Market in Asia-Pacific for Commercial stage, Historical Trends (Since 2021) and Forecasted Estimates (Till 2035)
- 21.5.2. Small Scale Bioreactors Market in Asia-Pacific for Academic / Research Institutes, Historical Trends (Since 2021) and Forecasted Estimates (Till 2035)
- 21.5.1. Small Scale Bioreactors Market in Asia-Pacific for Biopharma Companies, Historical Trends (Since 2021) and Forecasted Estimates (Till 2035)
22. MARKET OPPORTUNITY ANALYSIS: MIDDLE EAST AND NORTH AFRICA
- 22.1. Small Scale Bioreactors Market in Middle East and North Africa: Distribution by Capacity of Bioreactors
- 22.1.1. Small Scale Bioreactors Market in Middle East and North Africa for upto 300 mL, Historical Trends (Since 2021) and Forecasted Estimates (Till 2035)
- 22.1.2. Small Scale Bioreactors Market in Middle East and North Africa for 300 mL- 1L, Historical Trends (Since 2021) and Forecasted Estimates (Till 2035)
- 22.1.3. Small Scale Bioreactors Market in Middle East and North Africa for 1-3L, Historical Trends (Since 2021) and Forecasted Estimates (Till 2035)
- 22.1.4. Small Scale Bioreactors Market in Middle East and North Africa for 3-5L, Historical Trends (Since 2021) and Forecasted Estimates (Till 2035)
- 22.1.5. Small Scale Bioreactors Market in Middle East and North Africa for 5-50L, Historical Trends (Since 2021) and Forecasted Estimates (Till 2035)
- 22.1.6. Small Scale Bioreactors Market in Middle East and North Africa for 50-200L, Historical Trends (Since 2021) and Forecasted Estimates (Till 2035)
- 22.2. Small Scale Bioreactors Market in Middle East and North Africa: Distribution by Type of Cell Culture
- 22.2.1. Small Scale Bioreactors Market in Middle East and North Africa for Mammalian Culture, Historical Trends (Since 2021) and Forecasted Estimates (Till 2035)
- 22.2.2. Small Scale Bioreactors Market in Middle East and North Africa for Microbial Culture, Historical Trends (Since 2021) and Forecasted Estimates (Till 2035)
- 22.2.3. Small Scale Bioreactors Market in Middle East and North Africa for Viral Culture, Historical Trends (Since 2021) and Forecasted Estimates (Till 2035)
- 22.2.4. Small Scale Bioreactors Market in Middle East and North Africa for Insect Culture, Historical Trends (Since 2021) and Forecasted Estimates (Till 2035)
- 22.2.5. Small Scale Bioreactors Market in Middle East and North Africa for Others, Historical Trends (Since 2021) and Forecasted Estimates (Till 2035)
- 22.3. Small Scale Bioreactors Market in Middle East and North Africa: Distribution by Mode of Operation
- 22.3.1. Small Scale Bioreactors Market in Middle East and North Africa for batch / Fed-batch, Historical Trends (Since 2021) and Forecasted Estimates (Till 2035)
- 22.3.2. Small Scale Bioreactors Market in Middle East and North Africa for Continuous, Historical Trends (Since 2021) and Forecasted Estimates (Till 2035)
- 22.4. Small Scale Bioreactors Market in Middle East and North Africa: Distribution by Type of Bioreactor
- 22.4.1. Small Scale Bioreactors Market in Middle East and North Africa for Single Use Bioreactors, Historical Trends (Since 2021) and Forecasted Estimates (Till 2035)
- 22.4.2. Small Scale Bioreactors Market in Middle East and North Africa for Stainless Steel Bioreactors, Historical Trends (Since 2021) and Forecasted Estimates (Till 2035)
- 22.4.3. Small Scale Bioreactors Market in Middle East and North Africa for Glass Bioreactors, Historical Trends (Since 2021) and Forecasted Estimates (Till 2035)
- 22.5. Small Scale Bioreactors Market in Middle East and North Africa: Distribution by End-user
- 22.5.1. Small Scale Bioreactors Market in Middle East and North Africa for Biopharma Companies, Historical Trends (Since 2021) and Forecasted Estimates (Till 2035)
- 22.5.1.1. Biopharma Companies Small Scale Bioreactors Market in Middle East and North Africa for Discovery and Clinical stage, Historical Trends (Since 2021) and Forecasted Estimates (Till 2035)
- 22.5.1.2. Biopharma Companies Small Scale Bioreactors Market in Middle East and North Africa for Commercial stage, Historical Trends (Since 2021) and Forecasted Estimates (Till 2035)
- 22.5.2. Small Scale Bioreactors Market in Middle East and North Africa for Academic / Research Institutes, Historical Trends (Since 2021) and Forecasted Estimates (Till 2035)
- 22.5.1. Small Scale Bioreactors Market in Middle East and North Africa for Biopharma Companies, Historical Trends (Since 2021) and Forecasted Estimates (Till 2035)
23. MARKET OPPORTUNITY ANALYSIS: LATIN AMERICA
- 23.1. Small Scale Bioreactors Market in Latin America: Distribution by Capacity of Bioreactors
- 23.1.1. Small Scale Bioreactors Market in Latin America for Upto 300 mL, Historical Trends (Since 2021) and Forecasted Estimates (Till 2035)
- 23.1.2. Small Scale Bioreactors Market in Latin America for 300 mL- 1L, Historical Trends (Since 2021) and Forecasted Estimates (Till 2035)
- 23.1.3. Small Scale Bioreactors Market in Latin America for 1-3L, Historical Trends (Since 2021) and Forecasted Estimates (Till 2035)
- 23.1.4. Small Scale Bioreactors Market in Latin America for 3-5L, Historical Trends (Since 2021) and Forecasted Estimates (Till 2035)
- 23.1.5. Small Scale Bioreactors Market in Latin America for 5-50L, Historical Trends (Since 2021) and Forecasted Estimates (Till 2035)
- 23.1.6. Small Scale Bioreactors Market in Latin America for 50-200L, Historical Trends (Since 2021) and Forecasted Estimates (Till 2035)
- 23.2. Small Scale Bioreactors Market in Latin America: Distribution by Type of Cell Culture
- 23.2.1. Small Scale Bioreactors Market in Latin America for Mammalian Culture, Historical Trends (Since 2021) and Forecasted Estimates (Till 2035)
- 23.2.2. Small Scale Bioreactors Market in Latin America for Microbial Culture, Historical Trends (Since 2021) and Forecasted Estimates (Till 2035)
- 23.2.3. Small Scale Bioreactors Market in Latin America for Viral Culture, Historical Trends (Since 2021) and Forecasted Estimates (Till 2035)
- 23.2.4. Small Scale Bioreactors Market in Latin America for Insect Culture, Historical Trends (Since 2021) and Forecasted Estimates (Till 2035)
- 23.2.5. Small Scale Bioreactors Market in Latin America for Others, Historical Trends (Since 2021) and Forecasted Estimates (Till 2035)
- 23.3. Small Scale Bioreactors Market in Latin America: Distribution by Mode of Operation
- 23.3.1. Small Scale Bioreactors Market in Latin America for Batch / Fed-batch, Historical Trends (Since 2021) and Forecasted Estimates (Till 2035)
- 23.3.2. Small Scale Bioreactors Market in Latin America for Continuous, Historical Trends (Since 2021) and Forecasted Estimates (Till 2035)
- 23.4. Small Scale Bioreactors Market in Latin America: Distribution by Type of Bioreactor
- 23.4.1. Small Scale Bioreactors Market in Latin America for Single Use Bioreactors, Historical Trends (Since 2021) and Forecasted Estimates (Till 2035)
- 23.4.2. Small Scale Bioreactors Market in Latin America for Stainless Steel Bioreactors, Historical Trends (Since 2021) and Forecasted Estimates (Till 2035)
- 23.4.3. Small Scale Bioreactors Market in Latin America for Glass Bioreactors, Historical Trends (Since 2021) and Forecasted Estimates (Till 2035)
- 23.5. Small Scale Bioreactors Market in Latin America: Distribution by End-user
- 23.5.1. Small Scale Bioreactors Market in Latin America for Biopharma Companies, Historical Trends (Since 2021) and Forecasted Estimates (Till 2035)
- 23.5.1.1. Biopharma Companies Small Scale Bioreactors Market in Latin America for Discovery and Clinical stage, Historical Trends (Since 2021) and Forecasted Estimates (Till 2035)
- 23.5.1.2. Biopharma Companies Small Scale Bioreactors Market in Latin America for Commercial stage, Historical Trends (Since 2021) and Forecasted Estimates (Till 2035)
- 23.5.2. Small Scale Bioreactors Market in Latin America for Academic / Research Institutes, Historical Trends (Since 2021) and Forecasted Estimates (Till 2035)
- 23.5.1. Small Scale Bioreactors Market in Latin America for Biopharma Companies, Historical Trends (Since 2021) and Forecasted Estimates (Till 2035)
24. CONCLUDING REMARKS
25. TABULATED DATA
26. LIST OF COMPANIES AND ORGANIZATIONS
List of Tables
- Table 6.1 Fabrication Materials for Small Scale Bioreactors
- Table 7.1 Small Scale Bioreactors: Information on Total Volume, Stirrer Speed, Mode of Operation and Usability
- Table 7.2 Small Scale Bioreactors: Information on Parameters Controlled
- Table 7.3 Small Scale Bioreactors: List of Manufacturers
- Table 9.1 Small Scale Bioreactors: List of Companies Profiled
- Table 9.2 BIONET: Company Snapshot
- Table 9.3 BIONET: Product Portfolio
- Table 9.4 Biosan: Company Snapshot
- Table 9.5 Biosan: Product Portfolio
- Table 9.6 Cytiva: Company Snapshot
- Table 9.7 Cytiva: Product Portfolio
- Table 9.8 Distek: Company Snapshot
- Table 9.9 Distek: Product Portfolio
- Table 9.10 Eppendorf: Company Snapshot
- Table 9.11 Eppendorf: Product Portfolio
- Table 9.12 Eppendorf: Recent Developments and Future Outlook
- Table 9.13 Merck Millipore: Company Snapshot
- Table 9.14 Merck Millipore: Product Portfolio
- Table 9.15 Merck Millipore: Recent Developments and Future Outlook
- Table 9.16 Pall Corporation: Company Snapshot
- Table 9.17 Pall Corporation: Product Portfolio
- Table 9.18 Pall Corporation: Recent Developments and Future Outlook
- Table 9.19 Sartorius: Company Snapshot
- Table 9.20 Sartorius: Product Portfolio
- Table 9.21 Sartorius: Recent Developments and Future Outlook
- Table 10.1 Patent Analysis: Prominent CPC Symbols
- Table 10.2 Patent Analysis: Categorization based on Weighted Valuation Scores
- Table 11.1 Single-Use Bioreactors: Information on Scale of Operation
- Table 11.2 Single-Use Bioreactors: Information on Type of Bioreactor
- Table 11.3 Single-Use Bioreactors: Information on Type of Cell Culture System
- Table 11.4 Single-Use Bioreactors: List of Developers
- Table 25.1 Small Scale Bioreactors: Distribution by Minimum Working Volume
- Table 25.2 Small Scale Bioreactors: Distribution by Maximum Working Volume
- Table 25.3 Small Scale Bioreactors: Distribution by Speed of Stirrer
- Table 25.4 Small Scale Bioreactors: Distribution by Mode of Operation
- Table 25.5 Small Scale Bioreactors: Distribution by Usability
- Table 25.6 Small Scale Bioreactors: Distribution by Parameters Controlled
- Table 25.7 Small Scale Bioreactors Developers: Distribution by Year of Establishment
- Table 25.8 Small Scale Bioreactors Developers: Distribution by Company Size
- Table 25.9 Small Scale Bioreactors Developers: Distribution by Year of Establishment and Company Size
- Table 25.10 Small Scale Bioreactors Developers: Distribution by Location of Headquarters
- Table 25.11 Leading Manufacturers: Distribution by Number of Products
- Table 25.12 Patent Analysis: Distribution by Type of Patent
- Table 25.13 Patent Analysis: Cumulative Distribution by Publication Year, Since 2016
- Table 25.14 Patent Analysis: Cumulative Distribution by Application Year, Since 2016
- Table 25.15 Patent Analysis: Distribution by Geographical Location
- Table 25.16 Patent Analysis: Cumulative Year-wise Distribution by Type of Organization
- Table 25.17 Leading Industry Players: Distribution by Number of Patents
- Table 25.18 Leading Non-Industry Players: Distribution by Number of Patents
- Table 25.19 Patent Analysis: Leading Individual Assignees
- Table 25.20 Patent Analysis (Leading Industry Players): Benchmarking by Patent Characteristics (CPC Symbols)
- Table 25.21 Patent Analysis: Distribution of Patents by Age
- Table 25.22 Small Scale Bioreactors: Patent Valuation Analysis
- Table 25.23 Single-Use Bioreactors: Distribution by Status of Development
- Table 25.24 Single-Use Bioreactors: Distribution by Type of Single-Use Bioreactor
- Table 25.25 Single-Use Bioreactors: Distribution by Scale of Operation
- Table 25.26 Single-Use Bioreactors: Distribution by Area of Application
- Table 25.27 Single-Use Bioreactors: Distribution by Working Volume
- Table 25.28 Single-Use Bioreactors: Distribution by Type of Cell Culture Handled
- Table 25.29 Single-Use Bioreactors: Distribution by Type of Molecule
- Table 25.30 Single-Use Bioreactor Developers: Distribution by Year of Establishment
- Table 25.31 Single-Use Bioreactor Developers: Distribution by Company Size
- Table 25.32 Single-Use Bioreactor Developers: Distribution by Location of Headquarters
- Table 25.33 Leading Manufacturers: Distribution by Number of Products
- Table 25.34 Global Small Scale Bioreactors Market, Historical Trends (Since 2021) and Forecasted Estimates (Till 2035) (USD Million)
- Table 25.35 Global Small Scale Bioreactors Market, Forecasted Estimates (Till 2035): Conservative Scenario (USD Million)
- Table 25.36 Global Small Scale Bioreactors Market, Forecasted Estimates (Till 2035): Optimistic Scenario (USD Million)
- Table 25.37 Small Scale Bioreactors Market: Distribution by Capacity of Bioreactors
- Table 25.38 Small Scale Bioreactors Market for Upto 300 mL, Historical Trends (Since 2021) and Forecasted Estimates (Till 2035): Conservative, Base and Optimistic Scenarios (USD Million)
- Table 25.39 Small Scale Bioreactors Market for 300 mL-1L, Historical Trends (Since 2021) and Forecasted Estimates (Till 2035): Conservative, Base and Optimistic Scenarios (USD Million)
- Table 25.40 Small Scale Bioreactors Market for 1-3L, Historical Trends (Since 2021) and Forecasted Estimates (Till 2035): Conservative, Base and Optimistic Scenarios (USD Million)
- Table 25.41 Small Scale Bioreactors Market for 3-5L, Historical Trends (Since 2021) and Forecasted Estimates (Till 2035): Conservative, Base and Optimistic Scenarios (USD Million)
- Table 25.42 Small Scale Bioreactors Market for 5-50L, Historical Trends (Since 2021) and Forecasted Estimates (Till 2035): Conservative, Base and Optimistic Scenarios (USD Million)
- Table 25.43 Small Scale Bioreactors Market for 50-200L, Historical Trends (Since 2021) and Forecasted Estimates (Till 2035): Conservative, Base and Optimistic Scenarios (USD Million)
- Table 25.44 Small Scale Bioreactors Market: Distribution by Type of Cell Culture
- Table 25.45 Small Scale Bioreactors Market for Mammalian Culture, Historical Trends (Since 2021) and Forecasted Estimates (Till 2035): Conservative, Base and Optimistic Scenarios (USD Million)
- Table 25.46 Small Scale Bioreactors Market for Microbial Culture, Historical Trends (Since 2021) and Forecasted Estimates (Till 2035): Conservative, Base and Optimistic Scenarios (USD Million)
- Table 25.47 Small Scale Bioreactors Market for Viral Culture, Historical Trends (Since 2021) and Forecasted Estimates (Till 2035): Conservative, Base and Optimistic Scenarios (USD Million)
- Table 25.48 Small Scale Bioreactors Market for Insect Culture, Historical Trends (Since 2021) and Forecasted Estimates (Till 2035): Conservative, Base and Optimistic Scenarios (USD Million)
- Table 25.49 Small Scale Bioreactors Market for Others, Historical Trends (Since 2021) and Forecasted Estimates (Till 2035): Conservative, Base and Optimistic Scenarios (USD Million)
- Table 25.50 Small Scale Bioreactors Market: Distribution by Mode of Operation
- Table 25.51 Small Scale Bioreactors Market for Batch / Fed-batch, Historical Trends (Since 2021) and Forecasted Estimates (Till 2035): Conservative, Base and Optimistic Scenarios (USD Million)
- Table 25.52 Small Scale Bioreactors Market for Continuous, Historical Trends (Since 2021) and Forecasted Estimates (Till 2035): Conservative, Base and Optimistic Scenarios (USD Million)
- Table 25.53 Small Scale Bioreactors Market: Distribution by Type of Bioreactor
- Table 25.54 Small Scale Bioreactors Market for Single Use Bioreactors, Historical Trends (Since 2021) and Forecasted Estimates (Till 2035): Conservative, Base and Optimistic Scenarios (USD Million)
- Table 25.55 Small Scale Bioreactors Market for Stainless Steel Bioreactors, Historical Trends (Since 2021) and Forecasted Estimates (Till 2035): Conservative, Base and Optimistic Scenarios (USD Million)
- Table 25.56 Small Scale Bioreactors Market for Glass Bioreactors, Historical Trends (Since 2021) and Forecasted Estimates (Till 2035): Conservative, Base and Optimistic Scenarios (USD Million)
- Table 25.57 Small Scale Bioreactors Market: Distribution by End-user
- Table 25.58 Small Scale Bioreactors Market for Biopharma Companies, Historical Trends (Since 2021) and Forecasted Estimates (Till 2035): Conservative, Base and Optimistic Scenarios (USD Million)
- Table 25.59 Biopharma Companies Small Scale Bioreactors Market for Discovery and Clinical Stage, Historical Trends (Since 2021) and Forecasted Estimates (Till 2035): Conservative, Base and Optimistic Scenarios (USD Million)
- Table 25.60 Biopharma Companies Small Scale Bioreactors Market for Commercial Stage, Historical Trends (Since 2021) and Forecasted Estimates (Till 2035): Conservative, Base and Optimistic Scenarios (USD Million)
- Table 25.61 Small Scale Bioreactors Market for Academic / Research Institutes, Historical Trends (Since 2021) and Forecasted Estimates (Till 2035): Conservative, Base and Optimistic Scenarios (USD Million)
- Table 25.62 Small Scale Bioreactors Market: Distribution by Geographical regions
- Table 25.63 Small Scale Bioreactors Market in North America, Historical Trends (Since 2021) and Forecasted Estimates (Till 2035): Conservative, Base and Optimistic Scenarios (USD Million)
- Table 25.64 Small Scale Bioreactors Market in Europe, Historical Trends (Since 2021) and Forecasted Estimates (Till 2035): Conservative, Base and Optimistic Scenarios (USD Million)
- Table 25.65 Small Scale Bioreactors Market in Asia-Pacific, Historical Trends (Since 2021) and Forecasted Estimates (Till 2035): Conservative, Base and Optimistic Scenarios (USD Million)
- Table 25.66 Small Scale Bioreactors Market in Middle East and North Africa, Historical Trends (Since 2021) and Forecasted Estimates (Till 2035): Conservative, Base and Optimistic Scenarios (USD Million)
- Table 25.67 Small Scale Bioreactors Market in Latin America, Historical Trends (Since 2021) and Forecasted Estimates (Till 2035): Conservative, Base and Optimistic Scenarios (USD Million)
List of Figures
- Figure 2.1 Research Methodology: Project Methodology
- Figure 2.2 Research Methodology: Data Sources for Secondary Research
- Figure 2.3 Research Methodology: Robust Quality Control
- Figure 3.1 Market Dynamics: Forecast Methodology
- Figure 3.2 Market Dynamics: Market Assessment Framework
- Figure 4.1 Lessons Learnt from Past Recessions
- Figure 5.1 Executive Summary: Market Landscape
- Figure 5.2 Executive Summary: Market Trends
- Figure 5.5 Executive Summary: Market Sizing and Opportunity Analysis
- Figure 6.1 Bioreactors: Relation between Process Information and Experimental Output
- Figure 6.2 Types of Small Scale Bioreactors
- Figure 6.3 Advantages of Small Scale Bioreactors
- Figure 7.1 Small Scale Bioreactors: Distribution by Minimum Working Volume
- Figure 7.2 Small Scale Bioreactors: Distribution by Maximum Working Volume
- Figure 7.3 Small Scale Bioreactors: Distribution by Speed of Stirrer
- Figure 7.4 Small Scale Bioreactors: Distribution by Mode of Operation
- Figure 7.5 Small Scale Bioreactors: Distribution by Usability
- Figure 7.6 Small Scale Bioreactors: Distribution by Parameters Controlled
- Figure 7.7 Small Scale Bioreactors Manufacturers: Distribution by Year of Establishment
- Figure 7.8 Small Scale Bioreactors Manufacturers: Distribution by Company Size
- Figure 7.9 Small Scale Bioreactors Manufacturers: Distribution by Year of Establishment and Company Size
- Figure 7.10 Small Scale Bioreactors Manufacturers: Distribution by Location of Headquarters
- Figure 7.11 Leading Manufacturers: Distribution by Number of Products
- Figure 8.1 Small Scale Bioreactors: Offered by Players based in North America
- Figure 8.2 Small Scale Bioreactors: Offered by Players based in Europe
- Figure 8.3 Small Scale Bioreactors: Offered by Players based in Asia-Pacific
- Figure 10.1 Patent Analysis: Distribution by Type of Patent
- Figure 10.2 Patent Analysis: Cumulative Distribution by Publication Year, Since 2016
- Figure 10.3 Patent Analysis: Cumulative Distribution by Application Year, Since 2016
- Figure 10.4 Patent Analysis: Distribution by Geographical Location
- Figure 10.5 Patent Analysis: Distribution by CPC Symbols
- Figure 10.6 Patent Analysis: Cumulative Year-wise Distribution by Type of Organization
- Figure 10.7 Leading Industry Players: Distribution by Number of Patents
- Figure 10.8 Leading Non-Industry Players: Distribution by Number of Patents
- Figure 10.9 Patent Analysis (Leading Industry Players): Benchmarking by Patent Characteristics (CPC Symbols)
- Figure 10.10Patent Analysis: Distribution of Patents by Age
- Figure 10.12Small Scale Bioreactors: Patent Valuation Analysis
- Figure 11.1 Single-Use Bioreactors: Distribution by Status of Development
- Figure 11.2 Single-Use Bioreactors: Distribution by Type of Single-Use Bioreactor
- Figure 11.3 Single-Use Bioreactors: Distribution by Scale of Operation
- Figure 11.4 Single-Use Bioreactors: Distribution by Area of Application
- Figure 11.5 Single-Use Bioreactors: Distribution by Working Volume
- Figure 11.6 Single-Use Bioreactors: Distribution by Type of Cell Culture Handled
- Figure 11.7 Single-Use Bioreactors: Distribution by Type of Molecule
- Figure 11.8 Single-Use Bioreactor Developers: Distribution by Year of Establishment
- Figure 11.9 Single-Use Bioreactor Developers: Distribution by Company Size
- Figure 11.10Single-Use Bioreactor Developers: Distribution by Location of Headquarters
- Figure 11.11 Leading Developers: Distribution by Number of Products
- Figure 12.1 Global Small Scale Bioreactors Market, Historical Trends (Since 2021) and Forecasted Estimates (Till 2035) (USD Million)
- Figure 12.2 Global Small Scale Bioreactors Market, Forecasted Estimates (Till 2035): Conservative Scenario (USD Million)
- Figure 12.3 Global Small Scale Bioreactors Market, Forecasted Estimates (Till 2035): Optimistic Scenario (USD Million)
- Figure 13.1 Small Scale Bioreactors Market: Distribution by Capacity of Bioreactors
- Figure 13.2 Small Scale Bioreactors Market for Upto 300 mL, Historical Trends (Since 2021) and Forecasted Estimates (Till 2035) (USD Million)
- Figure 13.3 Small Scale Bioreactors Market for 300 mL-1L, Historical Trends (Since 2021) and Forecasted Estimates (Till 2035) (USD Million)
- Figure 13.4 Small Scale Bioreactors Market for 1-3L, Historical Trends (Since 2021) and Forecasted Estimates (Till 2035) (USD Million)
- Figure 13.5 Small Scale Bioreactors Market for 3-5L, Historical Trends (Since 2021) and Forecasted Estimates (Till 2035) (USD Million)
- Figure 13.6 Small Scale Bioreactors Market for 5-50L, Historical Trends (Since 2021) and Forecasted Estimates (Till 2035) (USD Million)
- Figure 13.7 Small Scale Bioreactors Market for 50-200L, Historical Trends (Since 2021) and Forecasted Estimates (Till 2035) (USD Million)
- Figure 14.1 Small Scale Bioreactors Market: Distribution by Type of Cell Culture
- Figure 14.2 Small Scale Bioreactors Market for Mammalian Culture, Historical Trends (Since 2021) and Forecasted Estimates (Till 2035) (USD Million)
- Figure 14.3 Small Scale Bioreactors Market for Microbial Culture, Historical Trends (Since 2021) and Forecasted Estimates (Till 2035) (USD Million)
- Figure 14.4 Small Scale Bioreactors Market for Viral Culture, Historical Trends (Since 2021) and Forecasted Estimates (Till 2035) (USD Million)
- Figure 14.5 Small Scale Bioreactors Market for Insect Culture, Historical Trends (Since 2021) and Forecasted Estimates (Till 2035) (USD Million)
- Figure 14.6 Small Scale Bioreactors Market for Others, Historical Trends (Since 2021) and Forecasted Estimates (Till 2035) (USD Million)
- Figure 15.1 Small Scale Bioreactors Market: Distribution by Mode of Operation
- Figure 15.2 Small Scale Bioreactors Market for Batch / Fed-batch, Historical Trends (Since 2021) and Forecasted Estimates (Till 2035) (USD Million)
- Figure 15.3 Small Scale Bioreactors Market for Continuous, Historical Trends (Since 2021) and Forecasted Estimates (Till 2035) (USD Million)
- Figure 16.1 Small Scale Bioreactors Market: Distribution by Type of Bioreactor
- Figure 16.2 Small Scale Bioreactors Market for Single Use Bioreactors, Historical Trends (Since 2021) and Forecasted Estimates (Till 2035) (USD Million)
- Figure 16.3 Small Scale Bioreactors Market for Stainless Steel Bioreactors, Historical Trends (Since 2021) and Forecasted Estimates (Till 2035) (USD Million)
- Figure 16.4 Small Scale Bioreactors Market for Glass Bioreactors, Historical Trends (Since 2021) and Forecasted Estimates (Till 2035) (USD Million)
- Figure 17.1 Small Scale Bioreactors Market: Distribution by End-user
- Figure 17.2 Small Scale Bioreactors Market for Biopharma Companies, Historical Trends (Since 2021) and Forecasted Estimates (Till 2035) (USD Million)
- Figure 17.3 Biopharma Companies Small Scale Bioreactors Market for Discovery and Clinical Stage, Historical Trends (Since 2021) and Forecasted Estimates (Till 2035) (USD Million)
- Figure 17.4 Biopharma Companies Small Scale Bioreactors Market for Commercial Stage, Historical Trends (Since 2021) and Forecasted Estimates (Till 2035) (USD Million)
- Figure 17.5 Small Scale Bioreactors Market for Academic / Research Institutes, Historical Trends (Since 2021) and Forecasted Estimates (Till 2035) (USD Million)
- Figure 18.1 Small Scale Bioreactors Market: Distribution by Geographical regions
- Figure 18.2 Small Scale Bioreactors Market in North America, Historical Trends (Since 2021) and Forecasted Estimates (Till 2035) (USD Million)
- Figure 18.3 Small Scale Bioreactors Market in Europe, Historical Trends (Since 2021) and Forecasted Estimates (Till 2035) (USD Million)
- Figure 18.4 Small Scale Bioreactors Market in Asia-Pacific, Historical Trends (Since 2021) and Forecasted Estimates (Till 2035) (USD Million)
- Figure 18.5 Small Scale Bioreactors Market in Middle East and North Africa, Historical Trends (Since 2021) and Forecasted Estimates (Till 2035) (USD Million)
- Figure 18.6 Small Scale Bioreactors Market in Latin America, Historical Trends (Since 2021) and Forecasted Estimates (Till 2035) (USD Million)
- Figure 24.1 Concluding Remarks: Market Landscape
- Figure 24.2 Concluding Remarks: Market Trends
- Figure 24.3 Concluding Remarks: Market Forecast and Opportunity Analysis

