PUBLISHER: Roots Analysis | PRODUCT CODE: 2112611

PUBLISHER: Roots Analysis | PRODUCT CODE: 2112611
RNAi Therapeutics Market (3rd Edition) by Type of RNAi Molecule, Therapeutic Area, Route of Administration, Key Geographical Regions, Sales Forecast and Leading Industry Players - Trends and Forecast Till 2035
RNAi THERAPEUTICS MARKET: OVERVIEW
As per Roots Analysis, the global RNAi therapeutics market is estimated to grow from USD 3.6 billion in the current year to USD 9.1 billion by 2035, reflecting a compound annual growth rate (CAGR) of approximately 10.8% during the forecast period.
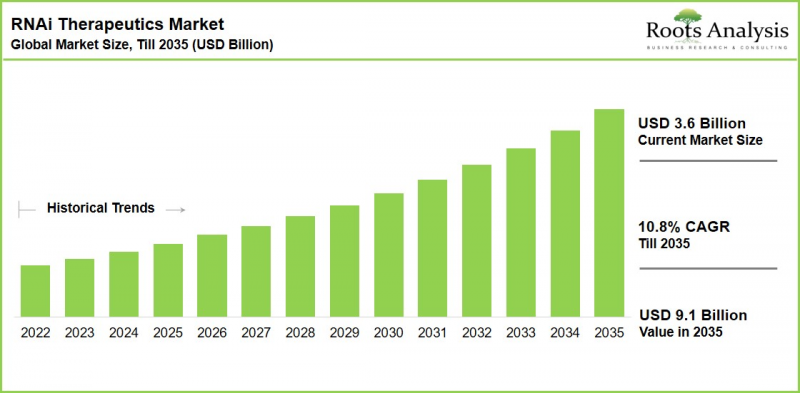
RNAi Therapeutics Market: Growth and Trends
RNA interference (RNAi) therapeutics have emerged as a clinically validated class of precision medicines that selectively suppress disease-driving genes through post-transcriptional gene silencing. By preventing the expression of pathogenic proteins, RNAi-based therapies offer a highly specific treatment approach with broad applicability across rare genetic, metabolic, cardiovascular, hepatic, ophthalmic, neurological and oncology indications. The successful clinical translation of RNAi technology, supported by multiple regulatory approvals over the past few years, has transformed the field from an experimental gene-silencing platform into a commercially viable therapeutic modality with increasing adoption across the biopharmaceutical industry.
The market is witnessing sustained expansion, driven by a combination of regulatory milestones, pipeline maturation and continuous improvements in oligonucleotide chemistry and targeted delivery technologies. Increasing clinical validation has encouraged developers to broaden RNAi applications beyond liver-directed therapies, with next-generation delivery platforms enabling selective targeting of tissues such as the central nervous system, kidney, lung, eye and solid tumors. At the same time, strategic licensing agreements, platform collaborations and rising investment in RNA-based drug development are accelerating innovation while reducing development risk, strengthening the long-term commercial outlook of the market.
Despite its strong growth trajectory, widespread adoption of RNAi therapeutics remains constrained by challenges associated with extrahepatic delivery, manufacturing scalability, long-term safety evaluation and premium treatment costs. However, continuous advances in tissue-specific delivery technologies, expanding clinical evidence, favorable regulatory support and increasing pharmaceutical investment are expected to overcome these barriers, positioning RNAi therapeutics as one of the fastest-evolving segments within the broader nucleic acid therapeutics landscape over the coming decade.
Growth Drivers: Factors Fueling Market Expansion
One of the significant drivers of the market is the increasing number of regulatory approvals, which is strengthening clinical confidence in RNAi therapeutics and expanding the modality across multiple disease areas. Recent approvals for ATTR amyloidosis with cardiomyopathy, hemophilia A or B, and familial chylomicronemia syndrome demonstrate the growing therapeutic relevance of RNAi-based medicines beyond their initial rare-disease focus. These approvals are expected to support broader physician adoption, patient access, and commercial expansion.
Continued advances in RNA chemistry and targeted delivery technologies are also improving the stability, potency, and clinical utility of RNAi therapeutics. Chemical modifications, conjugation strategies, and optimized delivery platforms have enabled more targeted tissue uptake, longer duration of gene silencing, and convenient dosing schedules across several approved and investigational therapies, helping developers improve treatment efficacy, reduce dosing burden, and expand the clinical value of the modality.
Market Challenges: Critical Barriers Hindering Progress
Despite significant progress in liver-targeted delivery, efficient delivery of RNAi to non-hepatic tissues remains a major technical challenge. Several candidates continue to face barriers related to tissue-specific targeting, cellular uptake, endosomal escape, and sustained gene silencing in non-hepatic tissues. Overcoming these limitations will be critical for expanding RNAi therapeutics into larger disease areas such as oncology, neurology, ophthalmology, and renal disorders.
RNAi therapeutics also continue to face challenges related to off-target effects, immune stimulation, chemical modification complexity, manufacturing scalability, and high treatment costs. Developers must carefully optimize RNAi sequences, delivery systems, and dosing regimens to minimize unintended gene silencing while maintaining therapeutic efficacy. These requirements can increase development timelines, regulatory scrutiny, and commercialization costs for market participants.
RNAi Therapeutics Market: Key Insights
The report delves into the current state of the RNAi therapeutics market and identifies potential growth opportunities within the industry, particularly from a distributor and channel-partner perspective. Some key findings include:
- Accelerating Strategic Collaborations: Recent months have seen a wave of high-value partnerships aimed at expanding RNAi discovery and delivery capabilities, including a multi-billion-dollar AI-driven RNAi discovery collaboration, an expanded platform license spanning multiple therapeutic areas beyond neurology, and a cross-border licensing agreement covering cardiovascular siRNA assets, reflecting sustained strategic interest in the space.
- Growing Access to Growth Capital: Recent financing activity, including a sizeable Series B round supporting a next-generation RNAi engineering platform and pipeline, alongside continued capacity investment by leading manufacturers, reflects sustained investor confidence in siRNA and shRNA-based drug development.
- Blockbuster Commercial Validation: An approved siRNA therapy used to reduce LDL cholesterol generated in excess of USD 1 billion in annual sales, achieving blockbuster status and highlighting the commercial strength of RNAi therapies in the treatment and management of metabolic indications.
- Favorable Regulatory Environment: A steady cadence of USFDA approvals across haematological, metabolic, and rare genetic disorders over the past two years have de-risked the technology and shortened the path from launch to physician adoption.
- Rising Relevance of Asia-Pacific Innovation: China-based developers are advancing next-generation siRNA platforms across cardiovascular, metabolic, rare disease, CNS, and viral hepatitis indications, and are increasingly entering global licensing agreements with established multinational pharmaceutical companies.
- Key Future Growth Outlook: Efficient, tissue-selective delivery beyond the liver remains the central technical bottleneck; long-term extrahepatic delivery data is still accumulating and is expected to be a key determinant of platform adoption and market consolidation, making it an important metric for investors to monitor.
RNAi Therapeutics Market Segments
Roots Analysis segments the global RNAi Therapeutics opportunity across the following parameters:
By Type of RNAi Molecule
- siRNA
- shRNA
By Therapeutic Area
- Oncological Disorders
- Genetic Disorders
- Metabolic Disorders
- Hematological Disorders
- Ophthalmic Disorders
- Other Disorders
By Route of Administration
- Subcutaneous
- Intravenous
- Topical
- Intradermal
By Key Geographical Regions
- North America
- Europe
- Asia-Pacific
- Rest of the World
RNAi Therapeutics Market: Key Segments Insight
siRNA Segment Leads the RNAi Therapeutics Market
Based on our market assessment, the siRNA segment is expected to account for the largest share of the RNAi therapeutics market. This leadership is primarily driven by the strong clinical validation, regulatory success, and commercial availability of siRNA-based therapies across multiple therapeutic areas. Several approved RNAi products are based on siRNA technology, reinforcing the segment's leading position, while advances in chemical modification and targeted delivery continue to improve stability, potency, and dosing convenience. Some notable examples of the approved RNAi products are Onpattro(R), Amvuttra(R), Givlaari(R), Oxlumo(R), Leqvio(R), Qfitlia(R), and Rivfloza(R).
On the other hand, the shRNA segment is projected to register the highest CAGR during the forecast period. This growth is attributed to increasing interest in vector-based RNAi approaches that support longer-duration gene silencing compared to transient RNAi strategies, with platforms being explored across oncology, genetic disorders, and other difficult-to-address disease areas.
Metabolic Disorders Account for the Largest Share by Therapeutic Area
Based on our market analysis, revenues generated through drugs targeting gene silencing in metabolic disorders account for the largest share of the current market. This dominance is primarily driven by strong commercial adoption of RNAi therapies targeting lipid metabolism and cardiometabolic risk factors, reinforced by the recent approval of a rare metabolic disorder indication.
In contrast, revenues generated through drugs targeting gene silencing in oncological disorders are expected to register the highest CAGR during the forecast period. This highest CAGR is likely due to the increasing exploration of RNAi approaches for cancer-associated genes that remain difficult to address with conventional treatment strategies.
Intravenous Route Leads the Delivery of RNAi Therapeutics
According to our proprietary market analysis, the intravenous route of administration holds the highest share in the RNAi therapeutics market. This dominance is due to its suitability for delivering complex RNAi formulations under medical supervision through established infusion-center networks and reimbursement pathways. In contrast, the subcutaneous route is expected to register the highest CAGR through 2035, driven by the increasing shift toward convenient, less resource-intensive, outpatient dosing models.
North America Maintains Market Leadership; Asia-Pacific Emerges as the Fastest-Growing Region
North America is expected to retain the highest share of global market revenue through the forecast period. This dominance is supported by the region's strong RNAi innovation ecosystem, established specialty-care infrastructure, and concentration of companies advancing RNAi therapeutics across rare genetic, cardiometabolic, hematological, and neurological indications. Additionally, the ongoing investment in domestic siRNA manufacturing capacity is further strengthening regional supply readiness.
The RNAi therapeutics market in Asia-Pacific is expected to grow at the highest CAGR during the forecast period. This lucrative growth is driven by increasing regional RNAi innovation, expanding clinical development activity, and stronger participation of Asia-based companies in global RNAi drug development, particularly across cardiovascular, metabolic, rare disease, CNS, and viral hepatitis indications.
Example Players in RNAi Therapeutics Market
- Alnylam Pharmaceuticals
- Arbutus Biopharma
- Arrowhead Pharmaceuticals
- Benitec Biopharma
- Novo Nordisk
- Novartis
- OliX Pharmaceuticals
- Silence Therapeutics
- Sirnaomics
Expert Interview and Industry Insights
The opinions and insights presented in this study were influenced by discussions conducted with multiple stakeholders. The research report features detailed transcripts of interviews held with the following industry stakeholders:
- Founder and Chief Executive Officer, Mid-sized Company, US
- President and Chief Executive Officer, Mid-sized Company, UK
- President and Chief Executive Officer, Small Company, US
- Chief Executive Officer and Co-Founder, Small Company, US
- Chief Executive Officer, Large Company, US
- Senior Vice President, Head of International Region, Large Company, US
- Executive Vice President, Chief Commercial Officer, Large Company, US
- Chief Technology Officer and Head of US Operations, Mid-sized Company, US
- Former Chief Medical Officer, Large Company, US
- Head of Advanced Drug Delivery, Very Large Company, UK
RNAi THERAPEUTICS MARKET: RESEARCH COVERAGE
- Market Dynamics and Macro-Economic Indicators: The report examines the forecast methodology (top-down, bottom-up and hybrid approaches), the market assessment framework (TAM / SAM / SOM / CAM), and key macro-economic indicators, including currency fluctuations, recession and inflation trends, trade dynamics, and geopolitical and pandemic-related disruptions, that may influence market evolution through 2035.
- Introduction to RNAi: An overview of the discovery, mechanism, molecule types (siRNA, miRNA and shRNA), applications, and advantages / disadvantages of RNA interference, along with a case study on regulatory concerns raised during clinical submissions.
- Market Overview and Pipeline Analysis: A detailed assessment of the marketed and development-stage RNAi therapeutics pipeline, featuring analyses by type of RNAi molecule, phase of development, target gene, therapeutic area, route of administration, and special regulatory designations.
- Competitive Landscape and Company Competitiveness Analysis: A comprehensive study of RNAi therapeutics developers based on parameters such as year of establishment, company size, and location of headquarters, along with a proprietary company competitiveness analysis benchmarking developers based in North America, Europe, and Asia-Pacific.
- Approved and Late-Stage RNAi Therapeutics: In-depth profiles of approved and late-stage RNAi drug candidates, featuring information on drug and technology overview, current development status, recent clinical trial results, and recent partnerships.
- Company Profiles: In-depth profiles of prominent players engaged in the development of RNAi therapeutics, featuring information on company overview, RNAi therapeutics portfolio, management team, and key initiatives.
- Key Therapeutic Indications: A detailed analysis of RNAi therapeutics being developed across oncological disorders, infectious diseases, metabolic disorders, ophthalmic diseases, and genetic disorders, segmented by target indication, phase of development, and type of RNAi molecule.
- Clinical Trial Analysis: An analysis of clinical trials related to RNAi therapeutics, based on parameters such as trial registration year, trial phase, recruitment status, type of sponsor, therapeutic area, and geography, along with enrolled patient population trends.
- Key Opinion Leaders: An analysis of key opinion leaders (KOLs) active in the RNAi therapeutics domain, based on type of organization, qualification, geographical location, and comparative KOL strength and activeness scores.
- Patent Analysis: An analysis of patents filed / granted related to RNAi therapeutics, based on parameters such as type of patent, publication year, CPC symbols, type of applicant, geography, patent benchmarking, and patent valuation.
- Publication Analysis: An assessment of scientific publications related to RNAi therapeutics, based on year of publication, type of publication, popular keywords, journals, publishers, copyright holders, and funding institutes.
- Recent Partnerships and Collaborations: A detailed analysis of recent partnerships and collaborations in this industry, based on parameters such as year of partnership, type of partnership, type of RNAi molecule, scale of partnership, therapeutic area, and regional distribution of deals.
- Funding and Investment Analysis: An analysis of recent funding and investments in the RNAi therapeutics domain, based on amount invested, type of funding, type of RNAi molecule, region, and most active players and investors.
- Key Commercialization Strategies: An examination of commercialization strategies adopted by RNAi-based therapy developers before and after product approval, including participation in global events, collaborations, indication expansion, geographical expansion, patient assistance programs, and government alignment initiatives.
- RNAi in Diagnostics: An overview of circulating miRNA biomarkers and their diagnostic applications in oncological and cardiovascular disorders, along with an assessment of miRNA-based diagnostic tests in the pipeline.
- RNAi Therapeutics Service Providers: A detailed analysis of contract research organizations (CROs), contract manufacturing organizations (CMOs), and consumables / other service providers supporting the RNAi therapeutics industry.
- Demand Analysis: An estimate of the global demand for RNAi therapeutics, in terms of target patient population, segmented by therapeutic approach, target therapeutic area, route of administration, key players, and geography.
- Market Sizing and Opportunity Analysis: The report features an in-depth analysis of the RNAi therapeutics market, focusing on key market segments, including type of RNAi molecule, therapeutic area, route of administration, and geographical regions, along with product-level sales forecasts, net present value, and value creation analysis for key approved and late-stage RNAi therapeutics.
- SWOT Analysis: A qualitative assessment of the strengths, weaknesses, opportunities, and threats characterizing the RNAi therapeutics industry, along with a comparative Harvey Ball analysis of SWOT factors.
- Executive Insights: The report features detailed transcripts of interviews held with senior executives representing companies engaged in the RNAi therapeutics domain.
Key Questions Answered in this Report
- Which are the leading companies in the RNAi therapeutics market?
- Which region dominates the RNAi therapeutics market?
- What are the key trends observed in the RNAi therapeutics market?
- What factors are likely to influence the evolution of this market?
- What are the primary challenges faced by RNAi therapeutics developers?
- What is the current and future market size?
- What is the CAGR of this market?
- How is the current and future market opportunity likely to be distributed across key market segments?
Reasons to Buy this Report
This report has been specifically developed to support distributors, channel partners, and business development teams evaluating entry into the RNAi therapeutics market.
- The report provides a comprehensive market analysis, offering detailed revenue projections of the overall market and its specific sub-segments. This information is valuable to both established market leaders and emerging entrants.
- The report offers stakeholders a comprehensive overview of the market, including key drivers, barriers, opportunities, and challenges. This information empowers stakeholders to stay abreast of market trends and make data-driven decisions to capitalize on growth prospects.
- The report can aid businesses in identifying future opportunities in any sector. It also helps in understanding if those opportunities are worth pursuing.
- The report helps in identifying customer demand by understanding the needs, preferences, and behavior of the target audience in order to tailor products or services effectively.
- The report equips new entrants with requisite information regarding a particular market to help them build successful business strategies.
- The report allows for more effective communication with the audience and in building strong business relations.
Additional Benefits
- Complementary Insights Pack
- Complementary PPT Insights Pack
- Complementary Excel Data Packs for all Analytical Modules in the Report
- 15% Free Content Customization
- Detailed Report Walkthrough Session with Research Team
- Free Updated report if the report is 6-12 months old or older
TABLE OF CONTENTS
1. PREFACE
- 1.1. Scope of the Report
- 1.2. Research Methodology
- 1.3. Market Segmentations
- 1.4. Key Questions Answered
- 1.5. Chapter Outlines
2. RESEARCH METHODOLOGY
- 2.1. Chapter Overview
- 2.2. Research Assumptions
- 2.2.1. Market Landscape and Market Trends
- 2.2.2. Market Forecast and Opportunity Analysis
- 2.2.3. Comparative Analysis
- 2.3. Database Building
- 2.3.1. Data Collection
- 2.3.2. Data Validation
- 2.3.3. Data Analysis
- 2.4. Project Methodology
- 2.4.1. Secondary Research
- 2.4.1.1. Annual Reports
- 2.4.1.2. Academic Research Papers
- 2.4.1.3. Company Websites
- 2.4.1.4. Investor Presentations
- 2.4.1.5. Regulatory Filings
- 2.4.1.6. White Papers
- 2.4.1.7. Industry Publications
- 2.4.1.8. Conferences and Seminars
- 2.4.1.9. Government Portals
- 2.4.1.10. Media and Press Releases
- 2.4.1.11. Newsletters
- 2.4.1.12. Industry Databases
- 2.4.1.13. Roots Proprietary Databases
- 2.4.1.14. Paid Databases and Sources
- 2.4.1.15. Social Media Portals
- 2.4.1.16. Other Secondary Sources
- 2.4.2. Primary Research
- 2.4.2.1. Types of Primary Research
- 2.4.2.1.1. Qualitative Research
- 2.4.2.1.2. Quantitative Research
- 2.4.2.1.3. Hybrid Approach
- 2.4.2.2. Advantages of Primary Research
- 2.4.2.3. Techniques for Primary Research
- 2.4.2.3.1. Interviews
- 2.4.2.3.2. Surveys
- 2.4.2.3.3. Focus Groups
- 2.4.2.3.4. Observational Research
- 2.4.2.3.5. Social Media Interactions
- 2.4.2.4. Key Opinion Leaders Considered in Primary Research
- 2.4.2.4.1. Company Executives (CXOs)
- 2.4.2.4.2. Board of Directors
- 2.4.2.4.3. Company Presidents and Vice Presidents
- 2.4.2.4.4. Research and Development Heads
- 2.4.2.4.5. Technical Experts
- 2.4.2.4.6. Subject Matter Experts
- 2.4.2.4.7. Scientists
- 2.4.2.4.8. Doctors and Other Healthcare Providers
- 2.4.2.5. Ethics and Integrity
- 2.4.2.5.1. Research Ethics
- 2.4.2.5.2. Data Integrity
- 2.4.2.1. Types of Primary Research
- 2.4.3. Analytical Tools and Databases
- 2.4.1. Secondary Research
- 2.5. Robust Quality Control
3. MARKET DYNAMICS
- 3.1. Chapter Overview
- 3.2. Forecast Methodology
- 3.2.1. Top-down Approach
- 3.2.2. Bottom-up Approach
- 3.2.3. Hybrid Approach
- 3.3. Market Assessment Framework
- 3.3.1. Total Addressable Market (TAM)
- 3.3.2. Serviceable Addressable Market (SAM)
- 3.3.3. Serviceable Obtainable Market (SOM)
- 3.3.4. Currently Acquired Market (CAM)
- 3.4. Forecasting Tools and Techniques
- 3.4.1. Qualitative Forecasting
- 3.4.2. Correlation
- 3.4.3. Regression
- 3.4.4. Extrapolation
- 3.4.5. Convergence
- 3.4.6. Sensitivity Analysis
- 3.4.7. Scenario Planning
- 3.4.8. Data Visualization
- 3.4.9. Time Series Analysis
- 3.4.10. Forecast Error Analysis
- 3.5. Key Considerations
- 3.5.1. Demographics
- 3.5.2. Government Regulations
- 3.5.3. Reimbursement Scenarios
- 3.5.4. Market Access
- 3.5.5. Supply Chain
- 3.5.6. Industry Consolidation
- 3.5.7. Pandemic / Unforeseen Disruptions Impact
- 3.6. Limitations
4. MACRO-ECONOMIC INDICATORS
- 4.1. Chapter Overview
- 4.2. Market Dynamics
- 4.2.1. Time Period
- 4.2.1.1. Historical Trends
- 4.2.1.2. Current and Forecasted Estimates
- 4.2.2. Currency Coverage
- 4.2.2.1. Major Currencies Affecting the Market
- 4.2.2.2. Factors Affecting Currency Fluctuations on the Industry
- 4.2.2.3. Impact of Currency Fluctuations on the Industry
- 4.2.3. Foreign Currency Exchange Rate
- 4.2.3.1. Impact of Foreign Exchange Rate Volatility on the Market
- 4.2.3.2. Strategies for Mitigating Foreign Exchange Risk
- 4.2.4. Recession
- 4.2.4.1. Assessment of Current Economic Conditions and Potential Impact on the Market
- 4.2.4.2. Historical Analysis of Past Recessions and Lessons Learnt
- 4.2.5. Inflation
- 4.2.5.1. Measurement and Analysis of Inflationary Pressures in the Economy
- 4.2.5.2. Potential Impact of Inflation on the Market Evolution
- 4.2.6. Interest Rates
- 4.2.6.1. Interest Rates and Their Impact on the Market
- 4.2.6.2. Strategies for Managing Interest Rate Risk
- 4.2.7. Commodity Flow Analysis
- 4.2.7.1. Type of Commodity
- 4.2.7.2. Origins and Destinations
- 4.2.7.3. Values and Weights
- 4.2.7.4. Modes of Transportation
- 4.2.8. Global Trade Dynamics
- 4.2.8.1. Import Scenario
- 4.2.8.2. Export Scenario
- 4.2.8.3. Trade Policies
- 4.2.8.4. Strategies for Mitigating the Risks Associated with Trade Barriers
- 4.2.8.5. Impact of Trade Barriers on the Market
- 4.2.9. War Impact Analysis
- 4.2.9.1. Russian-Ukraine War
- 4.2.9.2. Israel-Hamas War
- 4.2.10. COVID Impact / Related Factors
- 4.2.10.1. Global Economic Impact
- 4.2.10.2. Industry-specific Impact
- 4.2.10.3. Government Response and Stimulus Measures
- 4.2.10.4. Future Outlook and Adaptation Strategies
- 4.2.11. Other Indicators
- 4.2.11.1. Fiscal Policy
- 4.2.11.2. Consumer Spending
- 4.2.11.3. Gross Domestic Product
- 4.2.11.4. Employment
- 4.2.11.5. Taxes
- 4.2.11.6. Stock Market Performance
- 4.2.11.7. Cross Border Dynamics
- 4.2.1. Time Period
- 4.3. Conclusion
5. EXECUTIVE SUMMARY
6. INTRODUCTION
- 6.1. Chapter Overview
- 6.2. Key Milestones and Historical Trends
- 6.2.1. Discovery of RNAi
- 6.2.2. RNAi Therapy Development Efforts
- 6.3. Mechanism of RNAi
- 6.3.1. Components of RNAi
- 6.3.2. Cellular Mechanism
- 6.4. Types of RNAi Molecules
- 6.4.1. siRNA
- 6.4.2. miRNA
- 6.4.3. shRNA
- 6.5. Applications of RNAi
- 6.5.1. Functional Genomics
- 6.5.2. Therapeutics
- 6.5.3. Biotechnology
- 6.5.4. Genome-scale Screening
- 6.6. Advantages and Disadvantages of RNAi
- 6.6.1. Advantages of RNAi
- 6.6.2. Disadvantages of RNAi
- 6.6.3. Case Study: Concerns Discussed During Regulatory Submissions in Clinic
- 6.7. Future Perspectives
7. MARKET OVERVIEW
- 7.1. Chapter Overview
- 7.2. RNAi Therapeutics: Marketed and Development Pipeline
- 7.2.1. Analysis by Type of RNAi Molecule
- 7.2.2. Analysis by Phase of Development
- 7.2.3. Analysis by Type of Molecule and Phase of Development
- 7.2.4. Analysis by Target Gene
- 7.2.5. Analysis by Therapeutic Area
- 7.2.6. Analysis by Route of Administration
- 7.2.7. RNAi Therapeutics: Special Designations
- 7.2.8. Key Players
8. COMPETITIVE LANDSCAPE
- 8.1. Chapter Overview
- 8.2. RNAi Therapeutics: Developer Landscape
- 8.2.1. Analysis by Year of Establishment
- 8.2.2. Analysis by Company Size
- 8.2.3. Analysis by Location of Headquarters
- 8.2.4. Analysis by Location of Headquarters (Country-wise)
- 8.2.5. Key Players: Analysis by Number of Drug Candidates
- 8.3. RNAi Therapeutics: Regional Landscape
9. COMPANY COMPETITIVENESS ANALYSIS
- 9.1. Chapter Overview
- 9.2. Assumptions / Key Parameters
- 9.3. Methodology
- 9.4. Company Competitive Analysis: RNAi Therapeutics Developers
- 9.5. Developers based in North America
- 9.6. Developers based in Europe
- 9.7. Developers based in Asia-Pacific
10. APPROVED AND LATE-STAGE RNAi THERAPEUTICS
- 10.1. Chapter Overview
- 10.2. Onpattro(R)
- 10.2.1. Drug Overview
- 10.2.2. Technology Overview
- 10.2.3. Current Development Status
- 10.2.4. Recent Clinical Trial Results
- 10.2.5. Recent Partnerships
- Similar details are presented for other RNAi therapeutics mentioned below (based on information in the public domain)
- 10.3. Givlaari(R)
- 10.4. Leqvio(R)
- 10.5. Oxlumo(R)
- 10.6. Fitusiran
- 10.7. Vutrisiran
- 10.8. Rivfloza(R)
- 10.9. SYL 1001
- 10.10. SR-061
11. COMPANY PROFILES
- 11.1. Chapter Overview
- 11.2. Alnylam Pharmaceuticals
- 11.2.1. Company Overview
- 11.2.2. RNAi Therapeutics Portfolio
- 11.2.3. Management Team
- 11.2.4. Key Initiatives
- Similar details are presented for other RNAi therapeutics developers mentioned below (based on information in the public domain)
- 11.3. Arbutus Biopharma
- 11.4. Arrowhead Pharmaceuticals
- 11.5. Benitec Biopharma
- 11.6. Novo Nordisk
- 11.7. Novartis
- 11.8. OliX Pharmaceuticals
- 11.9. Silence Therapeutics
12. KEY THERAPEUTIC INDICATIONS
- 12.1. Chapter Overview
- 12.2. Oncological Disorders
- 12.2.1. Analysis by Target Indication and Phase of Development
- 12.2.2. Analysis by Type of RNAi Molecule
- 12.3. Infectious Diseases
- 12.3.1. Analysis by Target Indication and Phase of Development
- 12.3.2. Analysis by Type of RNAi Molecule
- 12.4. Metabolic Disorders
- 12.4.1. Analysis by Target Indication and Phase of Development
- 12.4.2. Analysis by Type of RNAi Molecule
- 12.5. Ophthalmic Diseases
- 12.5.1. Analysis by Target Indication and Phase of Development
- 12.5.2. Analysis by Type of RNAi Molecule
- 12.6. Genetic Disorders
- 12.6.1. Analysis by Target Indication and Phase of Development
- 12.6.2. Analysis by Type of RNAi Molecule
13. CLINICAL TRIAL ANALYSIS
- 13.1. Chapter Overview
- 13.2. Scope and Methodology
- 13.3. RNAi Therapeutics: Clinical Trial Analysis
- 13.3.1. Analysis by Trial Registration Year
- 13.3.2. Analysis by Trial Phase
- 13.3.3. Analysis by Trial Recruitment Status
- 13.3.4. Analysis by Type of Sponsor / Collaborator
- 13.3.5. Analysis by Type of RNAi Molecule and Trial Recruitment Status
- 13.3.6. Analysis by Therapeutic Area
- 13.3.7. Geographical Analysis by Number of Clinical Trials
- 13.3.8. Geographical Analysis by Number of Clinical Trials, Trial Phase and Recruitment Status
- 13.3.9. Geographical Analysis by Number of Clinical Trials and Type of RNAi Molecule
- 13.3.10. Geographical Analysis by Number of Clinical Trials, Type of RNAi Molecule and Trial Phase
- 13.3.11. Geographical Analysis by Number of Clinical Trials and Therapeutic Area
- 13.3.12. Geographical Analysis by Number of Clinical Trials, Therapeutic Area and Trial Phase
- 13.3.13. Geographical Analysis of Enrolled Patient Population by Location of Trial
- 13.3.14. Geographical Analysis of Enrolled Patient Population by Trial Phase and Trial Recruitment Status
- 13.3.15. Geographical Analysis of Enrolled Patient Population by Type of RNAi Molecule and Location of Trial
- 13.3.16. Geographical Analysis of Enrolled Patient Population by Type of RNAi Molecule, Trial Phase and Location of Trial
- 13.3.17. Geographical Analysis of Enrolled Patient Population by Therapeutic Area and Location of Trial
- 13.3.18. Geographical Analysis of Enrolled Patient Population by Therapeutic Area, Trial Phase and Location of Trial
- 13.4. Concluding Remarks
- 13.4.1. Key Therapeutic Candidates
- 13.4.2. Key Clinical Trials
14. KEY OPINION LEADERS
- 14.1. Chapter Overview
- 14.2. RNAi Therapeutics: Key Opinion Leaders
- 14.2.1. Analysis by Type of Organization
- 14.2.2. Analysis by Qualification
- 14.2.3. Analysis by Geographical Location of KOLs
- 14.2.4. Most Prominent Organizations: Analysis by Number of KOLs
- 14.2.5. KOL Activeness v/s KOL Strength
- 14.2.6. Most Prominent KOLs: Analysis by KOL Strength
- 14.2.7. Most Prominent KOLs: Comparison of RA Score and Third-Party Score
15. PATENT ANALYSIS
- 15.1. Chapter Overview
- 15.2. Scope and Methodology
- 15.3. RNAi Therapeutics: Patent Analysis
- 15.3.1. Analysis by Publication Year
- 15.3.2. Analysis by Patent Type and Publication Year
- 15.3.3. Analysis by CPC Code
- 15.3.4. Analysis by Type of Applicant
- 15.3.5. Analysis by Geography
- 15.3.5.1. Analysis by Geography: North American Scenario
- 15.3.5.2. Analysis by Geography: European Scenario
- 15.3.5.3. Analysis by Geography: Asia-Pacific Scenario
- 15.3.6. Emerging Focus Areas
- 15.3.7. Leading Players: Analysis by Number of Patents
- 15.4. RNAi Therapeutics: Patent Benchmarking Analysis
- 15.4.1. Analysis by Key Patent Characteristics
- 15.4.1.1. Arrowhead Pharmaceuticals and Sirna Therapeutics
- 15.4.1.2. Other Leading Patent Assignees
- 15.4.1. Analysis by Key Patent Characteristics
- 15.5. RNAi Therapeutics: Patent Valuation Analysis
16. PUBLICATION ANALYSIS
- 16.1. Chapter Overview
- 16.2. Scope and Methodology
- 16.3. Analysis by Year of Publication
- 16.4. Analysis by Type of Publication
- 16.5. Most Popular Keywords
- 16.6. Most Popular Journals: Analysis by Number of Publications
- 16.7. Most Popular Publisher: Analysis by Number of Publications
- 16.8. Most Popular Copyright Holders: Analysis by Number of Publications
- 16.9. Key Funding Institutes: Analysis by Number of Publications
17. PARTNERSHIPS AND COLLABORATIONS
- 17.1. Chapter Overview
- 17.2. Partnership Models
- 17.3. RNAi Therapeutics: Recent Partnerships and Collaborations
- 17.3.1. Analysis by Year of Partnership
- 17.3.2. Analysis by Type of Partnership
- 17.3.3. Analysis by Type of RNAi Molecule
- 17.3.4. Analysis by Scale of Partnership
- 17.3.5. Analysis by Therapeutic Area
- 17.3.6. Most Active Players: Analysis by Number of Partnerships
- 17.3.7. Regional Analysis
- 17.3.7.1. Country-wise Distribution
- 17.3.7.2. Intercontinental and Intracontinental Deals
18. FUNDING AND INVESTMENT ANALYSIS
- 18.1. Chapter Overview
- 18.2. Types of Funding
- 18.3. RNAi Therapeutics: Funding and Investment Analysis
- 18.3.1. Analysis by Cumulative Funding Instances, Since 2014
- 18.3.2. Analysis by Amount Invested
- 18.3.3. Analysis by Type of Funding
- 18.3.4. Analysis by Year and Type of Funding
- 18.3.5. Analysis of Amount Invested Across Different Types of RNAi Molecules
- 18.3.6. Regional Analysis by Amount Invested
- 18.3.7. Most Active Players
- 18.3.8. Key Investors
- 18.4. Concluding Remarks
19. KEY COMMERCIALIZATION STRATEGIES
- 19.1. Chapter Overview
- 19.2. Successful Drug Launch Strategy: ROOTS Framework
- 19.3. Successful Drug Launch Strategy: Product Differentiation
- 19.4. Commonly Adopted Commercialization Strategies based on Stage of Development of the Product
- 19.5. Approved RNAi Therapeutics
- 19.6. Key Commercialization Strategies Adopted by RNAi-based Therapy Developers
- 19.6.1. Strategies Adopted Before Therapy Approval
- 19.6.1.1. Participation in Global Events
- 19.6.1.1.1. Onpattro
- 19.6.1.1.2. Givlaari
- 19.6.1.1.3. Oxlumo
- 19.6.1.2. Collaboration with Stakeholders and Pharmaceutical Firms
- 19.6.1.2.1. Leqvio
- 19.6.1.3. Indication Expansion
- 19.6.1.3.1. Onpattro
- 19.6.1.3.2. Givlaari
- 19.6.1.3.3. Oxlumo
- 19.6.1.3.4. Leqvio
- 19.6.1.1. Participation in Global Events
- 19.6.2. Strategies Adopted During / Post Therapy Approval
- 19.6.2.1. Participation in Global Events
- 19.6.2.1.1. Onpattro
- 19.6.2.1.2. Leqvio
- 19.6.2.2. Geographical Expansion
- 19.6.2.2.1. Onpattro
- 19.6.2.2.2. Givlaari
- 19.6.2.2.3. Oxlumo
- 19.6.2.2.4. Leqvio
- 19.6.2.3. Patient Assistance Programs
- 19.6.2.3.1. Onpattro
- 19.6.2.3.2. Givlaari
- 19.6.2.3.3. Oxlumo
- 19.6.2.4. Awareness Through Product Websites
- 19.6.2.5. Collaboration with Stakeholders and Pharmaceutical Firms
- 19.6.2.5.1. Onpattro
- 19.6.2.5.2. Givlaari
- 19.6.2.5.3. Oxlumo
- 19.6.2.5.4. Leqvio
- 19.6.2.6. Aligning with Government Initiatives to Ensure High Adoption Rate
- 19.6.2.6.1. Onpattro
- 19.6.2.6.2. Givlaari
- 19.6.2.6.3. Leqvio
- 19.6.2.1. Participation in Global Events
- 19.6.1. Strategies Adopted Before Therapy Approval
- 19.7. Concluding Remarks
20. RNAi IN DIAGNOSTICS
- 20.1. Chapter Overview
- 20.2. Key Characteristics of Biomarkers
- 20.3. Circulating miRNA Biomarkers
- 20.4. miRNA Biomarkers in Oncological Disorders
- 20.4.1. Importance of Early Cancer Detection
- 20.4.2. Cancer Screening and Diagnosis
- 20.4.3. Conventional Cancer Diagnostics
- 20.4.3.1. Biopsy
- 20.4.4. Need for Non-Invasive Approaches
- 20.4.5. Key Indications
- 20.4.5.1. Breast Cancer
- 20.4.5.2. Colorectal Cancer
- 20.4.5.3. Gastric Cancer
- 20.4.5.4. Hematological Cancer
- 20.4.5.4.1. Acute Myeloid Leukemia
- 20.4.5.4.2. Lymphoma
- 20.4.5.5. Lung Cancer
- 20.4.5.6. Prostate Cancer
- 20.5. miRNA Biomarkers in Cardiovascular Diseases
- 20.5.1. Key Indications
- 20.5.1.1. Coronary Artery Disease
- 20.5.1.2. Myocardial Infarction
- 20.5.1. Key Indications
- 20.6. miRNA Based Diagnostic Tests
21. RNAi THERAPEUTICS SERVICE PROVIDERS
- 21.1. Chapter Overview
- 21.2. Analysis by Types of Service Providers
- 21.3. RNAi Therapeutics: List of CROs
- 21.3.1. Analysis by Year of Establishment
- 21.3.2. Analysis by Location of Headquarters
- 21.3.3. Analysis by Company Size
- 21.3.4. Analysis by Type of RNAi Molecule
- 21.4. RNAi Therapeutics: List of CMOs
- 21.4.1. Analysis by Year of Establishment
- 21.4.2. Analysis by Location of Headquarters
- 21.4.3. Analysis by Company Size
- 21.4.4. Analysis by Type of RNAi Molecule
- 21.5. RNAi Therapeutics: List of Consumables and Other Service Providers
- 21.5.1. Analysis by Year of Establishment
- 21.5.2. Analysis by Location of Headquarters
- 21.5.3. Analysis by Company Size
- 21.5.4. Analysis by Type of RNAi Molecule
22. DEMAND ANALYSIS
- 22.1. Chapter Overview
- 22.2. Methodology
- 22.3. Global Demand for RNAi Therapeutics, Historical Trends (since 2022) and Forecasted Estimates (till 2035)
- 22.3.1. Analysis by Therapeutic Approach
- 22.3.2. Analysis by Target Therapeutic Area
- 22.3.3. Analysis by Route of Administration
- 22.3.4. Analysis by Key Players
- 22.3.5. Analysis by Geography
23. MARKET SIZING AND OPPORTUNITY ANALYSIS
- 23.1. Chapter Overview
- 23.2. Scope and Limitations
- 23.3. Key Assumptions and Forecast Methodology
- 23.4. Overall RNAi Therapeutics Market, Historical Trends (since 2022) and Forecasted Estimates (till 2035) (USD Billion)
- 23.4.1. RNAi Therapeutics Market: Analysis by Type of RNAi Molecule
- 23.4.2. RNAi Therapeutics Market: Analysis by Therapeutic Area
- 23.4.3. RNAi Therapeutics Market: Analysis by Route of Administration
- 23.4.4. RNAi Therapeutics Market: Share of Leading Players
- 23.4.5. RNAi Therapeutics Market: Analysis by Geography
- 23.5. RNAi Therapeutics Market: Value Creation Analysis
- 23.6. RNAi Therapeutics Market: Sales Forecasts
- 23.6.1. Onpattro(R)
- 23.6.1.1. Target Patient Population
- 23.6.1.2. Sales Forecast
- 23.6.1.3. Net Present Value
- 23.6.1.4. Value Creation Analysis
- 23.6.2. Givlaari(TM)
- 23.6.2.1. Target Patient Population
- 23.6.2.2. Sales Forecast
- 23.6.2.3. Net Present Value
- 23.6.2.4. Value Creation Analysis
- 23.6.3. Leqvio(R)
- 23.6.3.1. Target Patient Population
- 23.6.3.2. Sales Forecast
- 23.6.3.3. Net Present Value
- 23.6.3.4. Value Creation Analysis
- 23.6.4. Oxlumo(TM)
- 23.6.4.1. Target Patient Population
- 23.6.4.2. Sales Forecast
- 23.6.4.3. Net Present Value
- 23.6.4.4. Value Creation Analysis
- 23.6.5. Fitusiran
- 23.6.5.1. Target Patient Population
- 23.6.5.2. Sales Forecast
- 23.6.5.3. Net Present Value
- 23.6.5.4. Value Creation Analysis
- 23.6.6. Vutrisiran
- 23.6.6.1. Target Patient Population
- 23.6.6.2. Sales Forecast
- 23.6.6.3. Net Present Value
- 23.6.6.4. Value Creation Analysis
- 23.6.7. SYL-1001
- 23.6.7.1. Target Patient Population
- 23.6.7.2. Sales Forecast
- 23.6.7.3. Net Present Value
- 23.6.7.4. Value Creation Analysis
- 23.6.8. Nedosiran
- 23.6.8.1. Target Patient Population
- 23.6.8.2. Sales Forecast
- 23.6.8.3. Net Present Value
- 23.6.8.4. Value Creation Analysis
- 23.6.1. Onpattro(R)
24. SWOT ANALYSIS
- 24.1. Chapter Overview
- 24.2. Strengths
- 24.3. Weaknesses
- 24.4. Opportunities
- 24.5. Threats
- 24.6. Comparison of SWOT Factors
- 24.6.1. Concluding Remarks
25. EXECUTIVE INSIGHTS
26. CONCLUSION
- 26.1. Chapter Overview
- 26.2. Key Takeaways
27. APPENDIX 1: TABULATED DATA
List of Tables
- Table 6.1 Merits and Demerits of RNAi Delivery Systems
- Table 6.2 Comparison between siRNA, miRNA and shRNA
- Table 7.1 RNAi Therapeutics: Marketed and Development Pipeline
- Table 7.2 RNAi Therapeutics: Information on Special Drug Designation
- Table 8.1 RNAi Therapeutics: List of Developers
- Table 10.1 RNAi Therapeutics: List of Marketed and Approved Products
- Table 10.2 Onpattro(R) (Patisiran): Drug Overview
- Table 10.3 Onpattro(R) (Patisiran): Information on Completed and Active Clinical Trials
- Table 10.4 Givlaari(R) (ALN-AS1): Drug Overview
- Table 10.5 Givlaari(R): Information on Completed and Active Clinical Trials
- Table 10.6 Leqvio(R) (Inclisiran): Drug Overview
- Table 10.7 Leqvio(R) (Inclisiran): Information on Completed and Active Clinical Trials
- Table 10.8 Oxlumo(R) (Lumasiran): Drug Overview
- Table 10.9 Oxlumo(R) (Lumasiran): Information on Completed and Active Clinical Trials
- Table 10.10 Fitusiran (ALN-AT3): Drug Overview
- Table 10.11 Fitusiran (ALN-AT3): Information on Completed and Active Clinical Trials
- Table 10.12 Vutrisiran (ALN-TTRsc02): Drug Overview
- Table 10.13 Vutrisiran (ALN-TTRsc02): Information on Completed and Active Clinical Trials
- Table 10.14 Rivfloza(R): Drug Overview
- Table 10.15 Rivfloza(R): Information on Completed and Active Clinical Trials
- Table 10.16 SYL1001(Tivanisiran): Drug Overview
- Table 10.17 SYL1001(Tivanisiran): Information on Completed and Active Clinical Trials
- Table 10.18 SR-061: Drug Overview
- Table 10.19 SR-061: Information on Completed and Active Clinical Trials
- Table 13.1 Clinical Trial Analysis: Key Therapeutic Candidates
- Table 13.2 Clinical Trial Analysis: Key Clinical Trials
- Table 14.1 Key Opinion Leaders: List of Principal Investigators Involved in Clinical Trials
- Table 15.1 Patent Analysis: CPC Code Definitions
- Table 15.2 Patent Analysis: Most Popular CPC Codes
- Table 15.3 Patent Analysis: List of Top CPC Codes
- Table 15.4 Patent Analysis: Summary of Benchmarking Analysis
- Table 15.5 Patent Analysis: List of Leading Patents (by Highest Relative Valuation)
- Table 16.1 RNAi Therapeutics: List of Publications
- Table 17.1 RNAi Therapeutics: List of Partnerships, Since 2014
- Table 18.1 RNAi Therapeutics: List of Funding and Investments, Since 2014
- Table 18.2 Funding and Investment Analysis: Summary of Investments
- Table 19.1 Onpattro(R): Presentations in Conferences Before Product Approval
- Table 19.2 Givlaari(R): Presentations in Conferences Before Product Approval
- Table 19.3 Oxlumo(R): Presentations in Conferences Before Product Approval
- Table 19.4 Onpattro(R): Presentations in Conferences After Product Approval
- Table 19.5 Leqvio(R): Presentations in Conferences Before Product Approval
- Table 19.6 Approved RNAi Therapies: Patient Support Services Available on Product Websites (Comparative Analysis)
- Table 19.7 Leqvio(R): Presentations in Conferences After Product Approval
- Table 19.8 Approved RNAi Therapies: Patient Support Services Available on Product Websites (Comparative Analysis)
- Table 20.1 Survival on Early Diagnosis of Cancer
- Table 20.2 Cost of Biopsy for Different Cancer Indications (in USD)
- Table 20.3 Breast Cancer: Reported miRNA Biomarkers
- Table 20.4 Colorectal Cancer: Reported miRNA Biomarkers
- Table 20.5 Gastric Cancer: Reported miRNA Biomarkers
- Table 20.6 AML: Reported miRNA Biomarkers
- Table 20.7 de novo DLBCL: Reported miRNA Biomarkers
- Table 20.8 Lung Cancer: Reported miRNA Biomarkers
- Table 20.9 Prostate Cancer: Reported miRNA Biomarkers
- Table 20.10 Coronary Artery Disease: Reported miRNA Biomarkers
- Table 20.11 Myocardial Infarction: Reported miRNA Biomarkers
- Table 20.12 miRNA Diagnostic Tests: Pipeline
- Table 21.1 RNAi Therapeutics: List of CROs
- Table 21.2 RNAi Therapeutics: List of CMOs
- Table 21.3 RNAi Therapeutics: List of Consumables Providers and Other Service Providers
- Table 23.1 RNAi Therapeutics: Expected Launch Year of Advanced Stage Drug Candidates
- Table 23.2 Onpattro(R): Target Patient Population
- Table 23.3 Onpattro(R): Net Present Value (USD Million)
- Table 23.4 Onpattro(R): Value Creation Analysis (USD Million)
- Table 23.5 Givlaari(R): Target Patient Population
- Table 23.6 Givlaari(R): Net Present Value (USD Million)
- Table 23.7 Givlaari(R): Value Creation Analysis (USD Million)
- Table 23.8 Leqvio(R): Target Patient Population
- Table 23.9 Leqvio(R): Net Present Value (USD Million)
- Table 23.10 Leqvio(R): Value Creation Analysis (USD Million)
- Table 23.11 Oxlumo(R): Target Patient Population
- Table 23.12 Oxlumo(R): Net Present Value (USD Million)
- Table 23.13 Oxlumo(R): Value Creation Analysis (USD Million)
- Table 23.14 Fitusiran: Target Patient Population
- Table 23.15 Fitusiran: Net Present Value (USD Million)
- Table 23.16 Fitusiran: Value Creation Analysis (USD Million)
- Table 23.17 Vutrisiran: Target Patient Population
- Table 23.18 Vutrisiran: Net Present Value (USD Million)
- Table 23.19 Vutrisiran: Value Creation Analysis (USD Million)
- Table 23.20 SYL 1001: Target Patient Population
- Table 23.21 SYL 1001: Net Present Value (USD Million)
- Table 23.22 SYL 1001: Value Creation Analysis (USD Million)
- Table 23.23 Rivfloza(R): Target Patient Population
- Table 23.24 Rivfloza(R): Net Present Value (USD Million)
- Table 23.25 Rivfloza(R): Value Creation Analysis (USD Million)
- Table 24.1 RNAi Therapeutics: SWOT Analysis
- Table 24.2 Comparison of SWOT Factors: Harvey Ball Analysis
Table 26.1 Concluding Remarks: Market Overview
- Table 26.2 Concluding Remarks: Competitive Landscape
- Table 26.3 Concluding Remarks: Company Competitiveness Analysis
- Table 26.4 Concluding Remarks: Technology Competitiveness Analysis
- Table 26.5 Concluding Remarks: Clinical Trial Analysis
- Table 26.6 Concluding Remarks: Key Opinion Leaders
- Table 26.7 Concluding Remarks: Patent Analysis
- Table 26.8 Concluding Remarks: Publication Analysis
- Table 26.9 Concluding Remarks: Recent Partnerships
- Table 26.10 Concluding Remarks: Funding and Investment Analysis
- Table 26.11 Concluding Remarks: Demand Analysis
- Table 26.12 Concluding Remarks: Market Sizing and Opportunity Analysis
- Table 27.1 RNAi Therapeutics: Distribution by Type of RNAi Molecule
- Table 27.2 RNAi Therapeutics: Distribution by Phase of Development
- Table 27.3 RNAi Therapeutics: Distribution by Type of RNAi Molecule and Phase of Development
- Table 27.4 RNAi Therapeutics: Distribution by Target Gene
- Table 27.5 RNAi Therapeutics: Distribution by Therapeutic Area
- Table 27.6 RNAi Therapeutics: Distribution by Route of Administration
- Table 27.7 RNAi Therapeutics: Distribution by Special Drug Designation
- Table 27.8 RNAi Therapeutics: Distribution by Special Drug Designation and Therapeutic Area
- Table 27.9 RNAi Therapeutics: Key Players
- Table 27.10 RNAi Therapeutics Developers: Distribution by Year of Establishment
- Table 27.11 RNAi Therapeutics Developers: Distribution by Company Size
- Table 27.12 RNAi Therapeutics Developers: Distribution by Location of Headquarters (Continent-wise)
- Table 27.13 RNAi Therapeutics Developers: Distribution by Location of Headquarters (Country-wise)
- Table 27.14 RNAi Therapeutics Developers: Key Players
- Table 27.15 RNAi Technology Platforms: Distribution by Purpose of Technology
- Table 27.16 RNAi Technology Platforms: Distribution by Type of Molecule(s) Delivered
- Table 27.17 RNAi Technology Platforms: Distribution by Type of Cell/ Tissue Targeted
- Table 27.18 RNAi Technology Developers: Distribution by Year of Establishment
- Table 27.19 RNAi Technology Developers: Distribution by Company Size
- Table 27.20 RNAi Technology Developers: Distribution by Location of Headquarters (Continent-wise)
- Table 27.21 RNAi Technology Developers: Distribution by Location of Headquarters (Country-wise)
- Table 27.22 RNAi Therapeutics for Oncological Disorders: Distribution by Target Indication and Phase of Development
- Table 27.23 RNAi Therapeutics for Oncological Disorders: Distribution by Type of RNAi Molecule
- Table 27.24 RNAi Therapeutics for Infectious Diseases: Distribution by Target Indication and Phase of Development
- Table 27.25 RNAi Therapeutics for Infectious Diseases: Distribution by Type of RNAi Molecule
- Table 27.26 RNAi Therapeutics for Metabolic Disorders: Distribution by Target Indication and Phase of Development
- Table 27.27 RNAi Therapeutics for Metabolic Disorders: Distribution by Type of RNAi Molecule
- Table 27.28 RNAi Therapeutics for Ophthalmic Diseases: Distribution by Target Indication and Phase of Development
- Table 27.29 RNAi Therapeutics for Ophthalmic Diseases: Distribution by Type of RNAi Molecule
- Table 27.30 RNAi Therapeutics for Genetic Disorders: Distribution by Target Indication and Phase of Development
- Table 27.31 RNAi Therapeutics for Genetic Disorders: Distribution by Type of RNAi Molecule
- Table 27.32 Clinical Trial Analysis: Cumulative Distribution by Trial Registration Year, Since 2014
- Table 27.33 Clinical Trial Analysis: Distribution of Trials by Start Year and Type of Molecule, Since 2014
- Table 27.34 Cumulative Distribution of Enrolled Patient Population by Study Start Year, Since 2014
- Table 27.35 Clinical Trial Analysis: Distribution of Enrolled Patient Population by Trial Phase
- Table 27.36 Clinical Trial Analysis: Distribution by Trial Recruitment Status and Phase of Development
- Table 27.37 Clinical Trial Analysis: Distribution by Type of Sponsor / Collaborator
- Table 27.38 Clinical Trial Analysis: Distribution by Type of RNAi Molecule and Trial Recruitment Status
- Table 27.39 Clinical Trial Analysis: Distribution by Type of RNAi Molecule and Trial Registration Year
- Table 27.40 Clinical Trial Analysis: Distribution by Type of RNAi Molecule and Phase of Development
- Table 27.41 Clinical Trial Analysis: Distribution by Therapeutic Area
- Table 27.42 Clinical Trial Analysis: Distribution by Therapeutic Area and Phase of Development
- Table 27.43 Clinical Trial Analysis: Geographical Distribution of Clinical Trials
- Table 27.44 Clinical Trial Analysis: Geographical Distribution of Clinical Trials by Trial Phase and Recruitment Status
- Table 27.45 Clinical Trial Analysis: Geographical Distribution of Clinical Trials by Type of RNAi Molecule
- Table 27.46 Clinical Trial Analysis: Geographical Distribution of Clinical Trials by Trial Phase and Type of RNAi Molecule
- Table 27.47 Clinical Trial Analysis: Geographical Distribution of Clinical Trials by Trial Phase and Therapeutic Area
- Table 27.48 Geographical Analysis by Number of Clinical Trials, Therapeutic Area and Trial Phase
- Table 27.49 Clinical Trial Analysis: Geographical Distribution of Enrolled Patient Population
- Table 27.50 Clinical Trial Analysis: Geographical Distribution of Enrolled Patient Population by Trial Phase and Recruitment Status
- Table 27.51 Clinical Trial Analysis: Geographical Distribution of Enrolled Patient Population by Type of RNAi Molecule
- Table 27.52 Clinical Trial Analysis: Geographical Distribution of Enrolled Patient Population by Trial Phase and Type of RNAi Molecule
- Table 27.53 Clinical Trial Analysis: Geographical Distribution of Enrolled Patient Population by Therapeutic Area
- Table 27.54 Clinical Trial Analysis: Geographical Distribution of Enrolled Patient Population by Trial Phase and Therapeutic Area
- Table 27.55 Key Opinion Leaders: Distribution by Type of Organization
- Table 27.56 KOL Analysis: Distribution by Qualification
- Table 27.57 KOL Analysis: Distribution by Geographical Location
- Table 27.58 Most Prominent Organizations: Distribution by Number of KOLs
- Table 27.59 Most Prominent KOLs: Distribution by KOL Strength
- Table 27.60 Patent Analysis: Distribution by Type of Patent
- Table 27.61 Patent Analysis: Cumulative Distribution by Publication Year, Since 2016
- Table 27.62 Patent Analysis: Distribution by Patent Type and Publication Year
- Table 27.63 Patent Analysis: Distribution by Type of Applicant
- Table 27.64 Patent Analysis: Distribution by Geography
- Table 27.65 Patent Analysis: North American Scenario
- Table 27.66 Patent Analysis: European Scenario
- Table 27.67 Patent Analysis: Asia-Pacific Scenario
- Table 27.68 Leading Players (Industry): Distribution by Number of Patents
- Table 27.69 Leading Players (Non-Industry): Distribution by Number of Patents
- Table 27.70 Patent Analysis: Distribution by Patent Age, Since 2016
- Table 27.71 Publication Analysis: Cumulative Year-wise Trend, Since 2016
- Table 27.72 Publication Analysis: Distribution by Type of Publication
- Table 27.73 Publication Analysis: Most Popular Keywords
- Table 27.74 Top Journals: Distribution by Number of Publications
- Table 27.75 Top Publishers: Distribution by Number of Publications
- Table 27.76 Key Copyright Holders: Distribution by Number of Publications
- Table 27.77 Key Funding Institutes: Distribution by Number of Publications
- Table 27.78 Partnerships: Cumulative Year-Wise Trend, Since 2014
- Table 27.79 Partnerships: Distribution by Type of Partnership
- Table 27.80 Partnerships: Year-wise Trend by Type of Partnership
- Table 27.81 Partnerships: Distribution by Type of RNAi Molecule
- Table 27.82 Partnerships: Distribution by Scale of Partnership
- Table 27.83 Partnerships: Distribution by Therapeutic Area
- Table 27.84 Most Active Players: Distribution by Number of Partnerships
- Table 27.85 Partnerships: Local and International Agreements
- Table 27.86 Partnerships: Intercontinental and Intracontinental Distribution
- Table 27.87 Funding and Investment Analysis: Distribution by Type of Funding and Year of Establishment, Since 2014
- Table 27.88 Funding and Investment Analysis: Cumulative Number of Instances by Year, Since 2014
- Table 27.89 Funding and Investment Analysis: Cumulative Amount Invested, Since 2014 (USD Million)
- Table 27.90 Funding and Investment Analysis: Distribution of Instances by Type of Funding, Since 2014
- Table 27.91 Funding and Investment Analysis: Distribution of the Total Amount Invested by Type of Funding, Since 2014 (USD Million)
- Table 27.92 Funding and Investments: Distribution of Number of Instances by Year and Type of Funding
- Table 27.93 Funding and Investments: Distribution of Amount Invested across Different Types of RNAi Therapeutics
- Table 27.94 Funding and Investment Analysis: Distribution by Geography
- Table 27.95 Funding and Investment Analysis: Regional Distribution of Funding Instances
- Table 27.96 Most Active Players: Distribution by Number of Instances, Since 2014
- Table 27.97 Most Active Players: Distribution by Amount Invested, Since 2014 (USD Million)
- Table 27.98 Key Investors: Distribution by Number of Instances
- Table 27.99 RNAi Therapeutics: Types of Service Providers
- Table 27.100 RNAi Therapeutic CROs: Distribution by Year of Establishment
- Table 27.101 RNAi Therapeutics CROs: Distribution by Location of Headquarters
- Table 27.102 RNAi Therapeutics CROs: Distribution by Company Size
- Table 27.103 RNAi Therapeutics CROs: Distribution by Type of RNAi Molecule
- Table 27.104 RNAi Therapeutics CMOs: Distribution by Year of Establishment
- Table 27.105 RNAi Therapeutics CMOs: Distribution by Location of Headquarters
- Table 27.106 RNAi Therapeutics CMOs: Distribution by Company Size
- Table 27.107 RNAi Therapeutic Consumable Providers: Distribution by Year of Establishment
- Table 27.108 RNAi Therapeutic Consumable Providers: Distribution by Location of Headquarters
- Table 27.109 RNAi Therapeutic Consumable Providers: Distribution by Company Size
- Table 27.110 RNAi Therapeutic Consumable Providers: Distribution by Type of RNAi Molecule
- Table 27.111 Global Demand for RNAi Therapeutics, Historical Trends (since 2022) and Forecasted Estimates (till 2035) (in terms of Target Patient Population)
- Table 27.112 Demand Analysis: Distribution by Type of Molecule (in terms of Target Patient Population)
- Table 27.113 Demand Analysis: Distribution by Therapeutic Area (in terms of Target Patient Population)
- Table 27.114 Demand Analysis: Distribution by Route of Administration (in terms of Target Patient Population)
- Table 27.115 Demand Analysis: Distribution by Key Players (in terms of Target Patient Population)
- Table 27.116 Demand Analysis: Distribution by Geography (in terms of Target Patient Population)
- Table 27.117 Overall RNAi Therapeutics Market, Historical Trends (since 2022) and Forecasted Estimates (till 2035) (USD Billion)
- Table 27.118 RNAi Therapeutics Market: Distribution by Type of RNAi Molecule (USD Million)
- Table 27.119 RNAi Therapeutics Market: Distribution by Therapeutic Area (USD Billion)
- Table 27.120 RNAi Therapeutics Market: Distribution by Route of Administration (USD Million)
- Table 27.121 RNAi Therapeutics Market: Distribution by Share of Leading Players (USD Million)
- Table 27.122 RNAi Therapeutics Market: Distribution by Geography (USD Billion)
- Table 27.123 Onpattro Sales Forecast (Till 2035): Conservative, Base and Optimistic Scenarios (USD Million)
- Table 27.124 Givosiran Sales Forecast (Till 2035): Conservative, Base and Optimistic Scenarios (USD Million)
- Table 27.125 Inclisiran Sales Forecast (Till 2035): Conservative, Base and Optimistic Scenarios (USD Million)
- Table 27.126 Lumasiran Sales Forecast (Till 2035): Conservative, Base and Optimistic Scenarios (USD Million)
- Table 27.127 Fitusiran Sales Forecast (Till 2035): Conservative, Base and Optimistic Scenarios (USD Million)
- Table 27.128 Vutrisiran Sales Forecast (Till 2035): Conservative, Base and Optimistic Scenarios (USD Million)
- Table 27.129 SYL 1001 Sales Forecast (Till 2035): Conservative, Base and Optimistic Scenarios (USD Million)
- Table 27.130 Rivfloza(R) Sales Forecast (Till 2035): Conservative, Base and Optimistic Scenarios (USD Million)
List of Figures
- Figure 2.1 Research Methodology: Project Methodology
- Figure 2.2 Research Methodology: Data Sources for Secondary Research
- Figure 2.3 Research Methodology: Robust Quality Control
- Figure 3.1 Market Dynamics: Forecast Methodology
- Figure 3.2 Market Dynamics: Market Assessment Framework
- Figure 4.1 Lessons Learnt from Past Recessions
- Figure 5.1 Executive Summary: Market Landscape
- Figure 5.2 Executive Summary: Competitive Landscape
- Figure 5.3 Executive Summary: Technology Platforms and Delivery Systems
- Figure 5.4 Executive Summary: Clinical Trial Analysis
- Figure 5.5 Executive Summary: Patent Analysis
- Figure 5.6 Executive Summary: Publication Analysis
- Figure 5.7 Executive Summary: Partnerships and Collaborations
- Figure 5.8 Executive Summary: Funding and Investment Analysis
- Figure 5.9 Executive Summary: Demand Analysis
- Figure 5.10 Executive Summary: Market Sizing and Opportunity Analysis
- Figure 6.1 RNA Interference: Key Milestones and Historical Evolution
- Figure 6.2 RNA Interference: Key Components
- Figure 6.3 RNA Interference: Working Mechanism
- Figure 6.4 RNA Interference: Types of Delivery Systems
- Figure 6.5 RNA Interference: Advantages and Disadvantages
- Figure 7.1 RNAi Therapeutics: Distribution by Type of RNAi Molecule
- Figure 7.2 RNAi Therapeutics: Distribution by Phase of Development
- Figure 7.3 RNAi Therapeutics: Distribution by Molecule and Phase of Development
- Figure 7.4 RNAi Therapeutics Pipeline: Distribution by Target Gene
- Figure 7.5 RNAi Therapeutics Pipeline: Distribution by Therapeutic Area
- Figure 7.6 RNAi Therapeutics Pipeline: Distribution by Route of Administration
- Figure 7.7 RNAi Therapeutics: Distribution by Special Drug Designation
- Figure 7.8 RNAi Therapeutics: Distribution by Special Drug Designation and Therapeutic Area
- Figure 7.9 RNAi Therapeutics: Key Players
- Figure 8.1 RNAi Therapeutics Developers: Distribution by Year of Establishment
- Figure 8.2 RNAi Therapeutics Developers: Distribution by Company Size
- Figure 8.3 RNAi Therapeutics Developers: Distribution by Location of Headquarters
- Figure 8.4 RNAi Therapeutics Developers: Distribution by Location of Headquarters (Country-wise)
- Figure 8.5 RNAi Therapeutics Developers: Key Players
- Figure 8.6 RNAi Therapeutics Developers: Regional Landscape
- Figure 9.1 Company Competitiveness Analysis: Developers based in North America
- Figure 9.2 Company Competitiveness Analysis: Developers based in Europe
- Figure 9.3 Company Competitiveness Analysis: Developers based in Asia-Pacific
- Figure 10.1 Onpattro (Alnylam Pharmaceuticals): Timeline of Regulatory Approvals Across Regions
- Figure 10.2 Lipid Nanoparticles Delivery System: Mode of Action
- Figure 10.3 Givlaari (Alnylam Pharmaceuticals): Timeline of Regulatory Approvals Across Regions
- Figure 10.4 ESC-GalNAc Delivery System: Mode of Action
- Figure 10.5 Leqvio (Alnylam Pharmaceuticals): Timeline of Regulatory Approvals Across Regions
- Figure 12.1 RNAi Therapeutics for Oncological Disorders: Distribution by Target Indication and Phase of Development
- Figure 12.2 RNAi Therapeutics for Oncological Disorders: Distribution by Type of RNAi Molecule
- Figure 12.3 RNAi Therapeutics for Infectious Diseases: Distribution by Target Indication and Phase of Development
- Figure 12.4 RNAi Therapeutics for Infectious Diseases: Distribution by Type of RNAi Molecule
- Figure 12.5 RNAi Therapeutics for Metabolic Disorders: Distribution by Target Indication and Phase of Development
- Figure 12.6 RNAi Therapeutics for Metabolic Disorders: Distribution by Type of RNAi Molecule
- Figure 12.7 RNAi Therapeutics for Ophthalmic Diseases: Distribution by Target Indication and Phase of Development
- Figure 12.8 RNAi Therapeutics for Ophthalmic Diseases: Distribution by Type of RNAi Molecule
- Figure 12.9 RNAi Therapeutics for Genetic Disorders: Distribution by Target Indication and Phase of Development
- Figure 12.10 RNAi Therapeutics for Genetic Disorders: Distribution by Type of RNAi Molecule
- Figure 13.1 Clinical Trial Analysis: Methodology
- Figure 13.2 Clinical Trial Analysis: Cumulative Distribution by Trial Registration Year, Since 2014
- Figure 13.3 Clinical Trial Analysis: Distribution of Trials by Start Year and Type of Molecule, Since 2014
- Figure 13.4 Clinical Trial Analysis: Cumulative Distribution of Enrolled Patient Population by Study Start Year, Since 2014
- Figure 13.5 Clinical Trial Analysis: Distribution of Enrolled Patient Population by Trial Phase
- Figure 13.6 Clinical Trial Analysis: Distribution by Trial Recruitment Status and Phase of Development
- Figure 13.7 Clinical Trial Analysis: Distribution by Type of Sponsor / Collaborator
- Figure 13.8 Clinical Trial Analysis: Distribution by Type of RNAi Molecule and Trial Recruitment Status
- Figure 13.9 Clinical Trial Analysis: Distribution by Type of RNAi Molecule and Trial Registration Year
- Figure 13.10 Clinical Trial Analysis: Distribution by Type of RNAi Molecule and Phase of Development
- Figure 13.11 Clinical Trial Analysis: Distribution by Therapeutic Area
- Figure 13.12 Clinical Trial Analysis: Distribution by Therapeutic Area and Phase of Development
- Figure 13.13 Clinical Trial Analysis: Geographical Distribution of Clinical Trials
- Figure 13.14 Clinical Trial Analysis: Geographical Distribution of Clinical Trials by Trial Phase and Recruitment Status
- Figure 13.15 Clinical Trial Analysis: Geographical Distribution of Clinical Trials by Type of RNAi Molecule
- Figure 13.16 Clinical Trial Analysis: Geographical Distribution of Clinical Trials by Trial Phase and Type of RNAi Molecule
- Figure 13.17 Clinical Trial Analysis: Geographical Distribution of Clinical Trials by Trial Phase and Therapeutic Area
- Figure 13.18 Clinical Trial Analysis: Geographical Distribution of Clinical Trials by Trial Phase and Therapeutic Area
- Figure 13.19 Clinical Trial Analysis: Geographical Distribution of Enrolled Patient Population
- Figure 13.20 Clinical Trial Analysis: Geographical Distribution of Enrolled Patient Population by Trial Phase and Recruitment Status
- Figure 13.21 Clinical Trial Analysis: Geographical Distribution of Enrolled Patient Population by Type of RNAi Molecule
- Figure 13.22 Clinical Trial Analysis: Geographical Distribution of Enrolled Patient Population by Trial Phase and Type of RNAi Molecule
- Figure 13.23 Clinical Trial Analysis: Geographical Distribution of Enrolled Patient Population by Therapeutic Area
- Figure 13.24 Clinical Trial Analysis: Geographical Distribution of Enrolled Patient Population by Trial Phase and Therapeutic Area
- Figure 14.1 KOL Analysis: Distribution by Type of Organization
- Figure 14.2 KOL Analysis: Distribution by Qualification
- Figure 14.3 KOL Analysis: Distribution by Geographical Location
- Figure 14.4 Most Prominent Organizations: Distribution by Number of KOLs
- Figure 14.5 Scatter Plot: KOL Activeness v/s KOL Strength
- Figure 14.6 Most Prominent KOLs: Distribution by KOL Strength
- Figure 14.7 Most Prominent KOLs: Comparison of RA Score with Third-Party Score
- Figure 14.8 Linear Regression Analysis: Comparison of RA Score with Third-Party Score
- Figure 14.9 Most Prominent KOLs: KOL Activeness v/s KOL Strength
- Figure 15.1 Patent Analysis: Distribution by Type of Patent
- Figure 15.2 Patent Analysis: Cumulative Distribution by Publication Year, Since 2016
- Figure 15.3 Patent Analysis: Distribution by Patent Type and Publication Year
- Figure 15.4 Patent Analysis: Distribution by CPC Symbols
- Figure 15.5 Patent Analysis: Distribution by Type of Applicant
- Figure 15.6 Patent Analysis: Distribution by Geography
- Figure 15.7 Patent Analysis: North American Scenario
- Figure 15.8 Patent Analysis: European Scenario
- Figure 15.9 Patent Analysis: Asia-Pacific Scenario
- Figure 15.10 Patent Analysis: Emerging Focus Areas
- Figure 15.11 Leading Players (Industry): Distribution by Number of Patents
- Figure 15.12 Leading Players (Non-Industry): Distribution by Number of Patents
- Figure 15.13 Patent Analysis: Benchmarking by Patent Characteristics
- Figure 15.14 Patent Analysis (Leading Industry Players): Benchmarking by Patent Characteristics
- Figure 15.15 Patent Analysis: Distribution by Patent Age, Since 2016
- Figure 15.16 Patent Analysis: Categorizations based on Weighted Valuation Scores
- Figure 15.17 Patent Analysis: Patent Valuation
- Figure 16.1 Publication Analysis: Cumulative Year-wise Trend, Since 2016
- Figure 16.2 Publication Analysis: Distribution by Type of Publication
- Figure 16.3 Publication Analysis: Most Popular Keywords
- Figure 16.4 Most Popular Journals: Distribution by Number of Publications
- Figure 16.5 Most Popular Publishers: Distribution by Number of Publications
- Figure 16.6 Most Popular Copyright Holders: Distribution by Number of Publications
- Figure 16.7 Key Funding Institutes: Distribution by Number of Publications
- Figure 17.1 Partnerships: Cumulative Year-Wise Trend, Since 2014
- Figure 17.2 Partnerships: Distribution by Type of Partnership
- Figure 17.3 Partnerships: Year-wise Trend by Type of Partnership
- Figure 17.4 Partnerships: Distribution by Type of RNAi Molecule
- Figure 17.5 Partnerships: Distribution by Scale of Partnership
- Figure 17.6 Partnerships: Distribution by Therapeutic Area
- Figure 17.7 Most Active Players: Distribution by Number of Partnerships
- Figure 17.8 Partnerships: Local and International Agreements
- Figure 17.9 Partnerships: Intercontinental and Intracontinental Distribution
- Figure 18.1 Funding and Investment Analysis: Distribution by Type of Funding and Year of Establishment, Since 2014
- Figure 18.2 Funding and Investment Analysis: Cumulative Number of Instances by Year, Since 2014
- Figure 18.3 Funding and Investment Analysis: Cumulative Amount Invested, Since 2014 (USD Million)
- Figure 18.4 Funding and Investment Analysis: Distribution by Year, Type of Funding and Amount Invested, Since 2014
- Figure 18.5 Funding and Investment Analysis: Distribution of Instances by Type of Funding, Since 2014
- Figure 18.6 Funding and Investment Analysis: Distribution of the Total Amount Invested by Type of Funding, Since 2014 (USD Million)
- Figure 18.7 Funding and Investments: Distribution of Number of Instances by Year and Type of Funding
- Figure 18.8 Funding and Investments: Distribution by Amount Invested across Different Types of RNAi Therapeutics
- Figure 18.9 Funding and Investment Analysis: Distribution by Geography
- Figure 18.10 Funding and Investment Analysis: Regional Distribution of Funding Instances
- Figure 18.11 Most Active Players: Distribution by Number of Instances, Since 2014
- Figure 18.12 Most Active Players: Distribution by Amount Invested, Since 2014 (USD Million)
- Figure 18.13 Key Investors: Distribution by Number of Instances
- Figure 18.14 Funding and Investment Summary, Since 2014 (USD Million)
- Figure 19.1 Successful Drug Launch Strategy: ROOTS Framework
- Figure 19.2 Successful Drug Launch Strategy: Product Differentiation
- Figure 19.3 Commonly Adopted Commercialization Strategies based on Development Stage of the Product
- Figure 19.4 Harvey Ball Analysis: Commercialization Strategies Adopted by RNAi-Based Therapy Developers
- Figure 19.5 Approved RNAi Therapies: Snapshot of Promotional Activities on Product Websites
- Figure 19.6 Key Commercialization Strategies: Harvey Ball Analysis by Ease of Implementation, Value Addition and Current Adoption
- Figure 20.1 Circulating miRNA Biomarkers: Key Criteria
- Figure 20.2 Factors Determining Useful Cancer Screening
- Figure 20.3 Conventional Methods for Cancer Diagnosis
- Figure 21.1 RNAi Therapeutics: Types of Service Providers
- Figure 21.2 RNAi Therapeutic CROs: Distribution by Year of Establishment
- Figure 21.3 RNAi Therapeutics CROs: Distribution by Location of Headquarters
- Figure 21.4 RNAi Therapeutics CROs: Distribution by Company Size
- Figure 21.5 RNAi Therapeutics CMOs: Distribution by Year of Establishment
- Figure 21.6 RNAi Therapeutics CMOs: Distribution by Location of Headquarters
- Figure 21.7 RNAi Therapeutics CMOs: Distribution by Company Size
- Figure 21.8 RNAi Therapeutic Consumable Providers: Distribution by Year of Establishment
- Figure 21.9 RNAi Therapeutic Consumable Providers: Distribution by Location of Headquarters
- Figure 21.10 RNAi Therapeutic Consumable Providers: Distribution by Company Size
- Figure 22.1 Global Demand for RNAi Therapeutics, Historical Trends (since 2022) and Forecasted Estimates (till 2035) (in terms of Target Patient Population)
- Figure 22.2 Demand Analysis: Distribution by Type of Molecule (in terms of Target Patient Population)
- Figure 22.3 Demand Analysis: Distribution by Therapeutic Area (in terms of Target Patient Population)
- Figure 22.4 Demand Analysis: Distribution by Route of Administration (in terms of Target Patient Population)
- Figure 22.5 Demand Analysis: Distribution by Key Players (in terms of Target Patient Population)
- Figure 22.6 Demand Analysis: Distribution by Geography (in terms of Target Patient Population)
- Figure 23.1 Overall RNAi Therapeutics Market, Historical Trends (since 2022) and Forecasted Estimates (till 2035): Base Scenario (USD Billion)
- Figure 23.2 RNAi Therapeutics Market: Distribution by Type of RNAi Molecule (USD Million)
- Figure 23.3 RNAi Therapeutics Market: Distribution by Therapeutic Area (USD Billion)
- Figure 23.4 RNAi Therapeutics Market: Distribution by Route of Administration (USD Million)
- Figure 23.5 RNAi Therapeutics Market: Distribution by Share of Leading Players (USD Million)
- Figure 23.6 RNAi Therapeutics Market: Distribution by Geography
- Figure 23.7 Onpattro Sales Forecast (Till 2035): Base Scenario (USD Million)
- Figure 23.8 Givosiran Sales Forecast (Till 2035): Base Scenario (USD Million)
- Figure 23.9 Inclisiran Sales Forecast (Till 2035): Base Scenario (USD Million)
- Figure 23.10 Lumasiran Sales Forecast (Till 2035): Base Scenario (USD Million)
- Figure 23.11 Fitusiran Sales Forecast (Till 2035): Base Scenario (USD Million)
- Figure 23.12 Vutrisiran Sales Forecast (Till 2035): Base Scenario (USD Million)
- Figure 23.13 SYL 1001 Sales Forecast (Till 2035): Base Scenario (USD Million)
- Figure 23.14 Nedosiran Sales Forecast (Till 2035): Base Scenario (USD Million)
- Figure 24.1 RNAi Therapeutics: SWOT Analysis
- Figure 24.2 Comparison of SWOT Factors: Harvey Ball Analysis
Figure 26.1 Concluding Remarks: Market Overview
- Figure 26.2 Concluding Remarks: Competitive Landscape
- Figure 26.3 Concluding Remarks: Company Competitiveness Analysis
- Figure 26.4 Concluding Remarks: Technology Platforms and Delivery Systems
- Figure 26.5 Concluding Remarks: Technology Competitiveness Analysis
- Figure 26.6 Concluding Remarks: Clinical Trial Analysis
- Figure 26.7 Concluding Remarks: Key Opinion Leaders
- Figure 26.8 Concluding Remarks: Patent Analysis
- Figure 26.9 Concluding Remarks: Publication Analysis
- Figure 26.10 Concluding Remarks: Recent Partnerships
- Figure 26.11 Concluding Remarks: Funding and Investment Analysis
- Figure 26.12 Concluding Remarks: Key Commercialization Strategies
- Figure 26.13 Concluding Remarks: Demand Analysis
- Figure 26.14 Concluding Remarks: Market Sizing and Opportunity Analysis (1/2)
- Figure 26.15 Concluding Remarks: Market Sizing and Opportunity Analysis (2/2)

