PUBLISHER: Roots Analysis | PRODUCT CODE: 2161887

PUBLISHER: Roots Analysis | PRODUCT CODE: 2161887
CAR-T Cell Therapies Market (2nd Edition) - Trends and Forecast Till 2035
CAR-T CELL THERAPIES MARKET: OVERVIEW
The global CAR-T Cell Therapies market is estimated to grow from USD 7.7 billion in the current year to USD 15.6 billion by 2035, registering a CAGR of 8.1% during the forecast period.
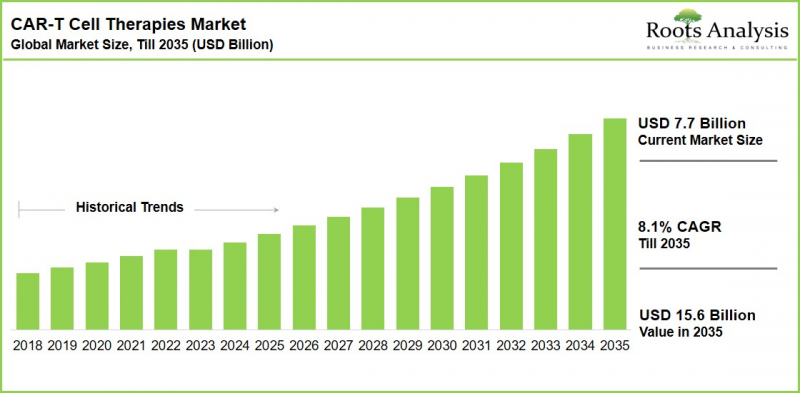
CAR-T Cell Therapies Market: Growth and Trends
Cancer drug development remains a major focus of pharmaceutical investment, with continued regulatory approvals and advances in immuno-oncology expanding the addressable treatment landscape. Within this market, CAR-T therapy has emerged as a leading cell therapy modality, leveraging genetically engineered immune cells to selectively recognize and eliminate cancer cells. Approved therapies have demonstrated the potential to deliver deep and durable responses, including complete remission, particularly in heavily pretreated patients.
The CAR-T development pipeline continues to expand, with nearly 1,000 clinical trials registered over the past eight years and more than 230 companies developing CAR-T candidates across oncology and other therapeutic areas. Six autologous CAR-T Cell Therapies have received FDA approval, covering indications including acute lymphoblastic leukemia, diffuse large B-cell lymphoma, follicular lymphoma, mantle cell lymphoma, and multiple myeloma. Ongoing label expansions are further widening patient eligibility and commercial opportunities. For instance, the FDA expanded the indication for axicabtagene ciloleucel (Yescarta) to include a rare, aggressive form of non-Hodgkin lymphoma that has progressed following standard treatment.
Regulatory changes are also supporting broader adoption and market access. The FDA removed Risk Evaluation and Mitigation Strategy (REMS) requirements for approved CD19 and BCMA-directed CAR-T Cell Therapies, reducing treatment-site certification requirements, eliminating mandatory tocilizumab stocking, and shortening certain post-infusion monitoring requirements. This regulatory shift is expected to facilitate adoption beyond major academic centers and support the expansion of CAR-T administration into community and regional treatment settings.
Overall, the combination of pipeline expansion, regulatory simplification, label extensions, and broader treatment access is strengthening the commercial outlook for CAR-T Cell Therapies and creating opportunities across cell manufacturing, clinical development, treatment delivery, and supporting infrastructure.
Growth Drivers: Strategic Enablers of Market Expansion
- Technological advancement in molecular research. Improvements in CAR construct design, gene transfer methods, and co-stimulatory domains are improving efficacy and expanding the addressable patient population.
- Rising demand for personalized cancer treatment. CAR-T's patient-specific, one-time treatment paradigm continues to attract strong physician and patient interest, particularly in relapsed/refractory hematologic malignancies.
- Expanding clinical trial activity and approvals. A steady cadence of new approvals and label expansions including into earlier lines of therapy is broadening the eligible patient base.
- Sustained investor funding. Continued venture and strategic capital inflow is supporting both autologous pipeline expansion and next-generation allogeneic ("off-the-shelf") platforms.
- Regulatory streamlining. Reduced REMS burden and evolving reimbursement frameworks are lowering the operational barrier to broader treatment-center adoption.
- Emerging indications beyond oncology. Early clinical and regulatory momentum in autoimmune and dermatologic disease with a first non-oncology CAR-T approval anticipated in the near term points to a meaningfully larger long-term addressable market.
Market Challenges: Barriers to Sustained Growth
- Manufacturing complexity and turnaround time. Autologous CAR-T products require patient-specific manufacturing, creating capacity constraints and multi-week vein-to-vein timelines that can be clinically limiting for rapidly progressing disease.
- Cold-chain and logistics sensitivity. Cryopreserved apheresis material and finished product must be transported under strict, validated temperature control between treatment centers and manufacturing sites - a significant point of operational risk.
- High treatment cost. Approved CAR-T Cell Therapies are priced between roughly USD 373,000 and USD 475,000 per patient, creating access and reimbursement challenges, particularly outside the US and Europe.
- Solid tumor limitations. Despite representing the large majority of cancer diagnoses, solid tumors remain largely unaddressed by approved CAR-T therapy due to the immunosuppressive tumor microenvironment, limited T-cell trafficking, antigen heterogeneity, and off-tumor toxicity risk.
- Site-of-care constraints. Even with reduced REMS requirements, CAR-T administration still requires specialized infrastructure for cytokine release syndrome and neurotoxicity management, limiting the number of qualified treatment centers.
- Competitive and regulatory risk. A crowded pipeline across CD19 and BCMA targets, combined with evolving regional regulatory pathways (US, EU, China), adds commercial and approval-timeline uncertainty for developers.
CAR-T Cell Therapies Market: Key Insights
- CAR-T Cell Therapies, with over 1,240 preclinical and clinical product candidates, represent one of the most active segments in the pharmaceutical domain.
- Close to 75% of therapy candidates in development are autologous in nature; CD19 and BCMA have emerged as the most popular target antigens.
- Extensive efforts are underway to improve CAR constructs across successive generations, including changes to the scFv binding domain and the gene delivery vectors used.
- Close to 200 companies claim the capabilities required to manufacture different types of cell therapies, offering services across multiple stages of product development.
- More than 970 clinical trials have been registered across geographies for CAR-T Cell Therapies over the past eight years.
- Over 375 scientists from leading universities are currently involved in CAR-T clinical development, with key opinion leaders concentrated primarily in the US and China.
- Investors have committed more than USD 32 billion across 370+ funding instances, reflecting sustained confidence in the segment.
- More than 11,900 patents related to CAR-T Cell Therapies have been filed or granted, underscoring the intensity of intellectual property activity in this field.
Recent Developments Signaling Market Momentum
- The FDA removed REMS requirements for all approved CD19- and BCMA-directed CAR-T Cell Therapies, easing site-certification and monitoring burdens and supporting wider treatment-center adoption.
- The FDA expanded the label for Yescarta (axicabtagene ciloleucel) to include patients with relapsed or refractory primary central nervous system lymphoma, a rare and aggressive form of non-Hodgkin lymphoma.
- The FDA granted IND clearance to KLN-1010, an in vivo gene therapy approach for relapsed/refractory multiple myeloma, following encouraging early clinical data part of a broader wave of next-generation, off-the-shelf CAR-T platform development.
- The first international patient was treated with a newly approved solid-tumor CAR-T therapy at a cancer center in China, an early but notable step toward addressing the solid tumor opportunity that has so far eluded approved CAR-T products.
- Clinical and regulatory momentum continued to build toward the field's first CAR-T approval outside oncology, with an autoimmune/dermatologic indication anticipated as a near-term milestone.
- Allogeneic ("off-the-shelf") CAR-T developers, including programs from multiple biotech innovators, continued reporting clinical readouts across oncology and autoimmune disease, aiming to eliminate the patient-specific manufacturing window that currently constrains capacity and access.
CAR-T Cell Therapies Market Segmentation
The market sizing and opportunity analysis is segmented across the following parameters:
By Target Indication
- Acute Lymphoblastic Leukemia
- Diffuse Large B-cell Lymphoma
- Follicular Lymphoma
- Large B-cell Lymphoma
- Mantle Cell Lymphoma
- Multiple Myeloma
- Others
By Target Antigen
- CD19
- BCMA
- CD20
- CD19 / CD22
- Others
By Key Geographical Region
- North America (US, Canada)
- Europe (Germany, France, Italy, Spain, UK, Rest of Europe)
- Asia-Pacific (Japan, India, China, Australia, South Korea, Rest of Asia-Pacific)
- Latin America
- Middle East and North Africa
- Rest of the World
By Key Drugs
- Yescarta
- Kymriah
- Abecma
- Breyanzi
- Carvykti
- Tecartus
- Others (including pipeline candidates)
CAR-T Cell Therapies Market: Key Segment Insights
Multiple Myeloma Holds Highest Share
Multiple myeloma currently holds the largest share of CAR-T cell therapy market. This highest share is supported by the high unmet need in relapsed or refractory disease, frequent disease recurrence, and limited treatment options after standard therapies. Further, the FDA has approved two BCMA-targeted CAR-T Cell Therapies for patients who have received first-lines of treatment, expanding the addressable patient population and strengthening the segment's commercial potential.
Large B-cell lymphoma is projected to register the highest growth during the forecast period, driven by its sizeable patient population, high relapse rates, and increasing adoption of CAR-T Cell Therapies in relapsed or refractory disease. Ongoing evaluation of CAR-T Cell Therapies in earlier treatment lines is expected to further expand patient eligibility and accelerate market adoption.
Across adjacent targeted therapy markets, HER2-targeting therapies address HER2-driven cancers through a range of modalities, including antibodies, antibody-drug conjugates, bispecific antibodies, and cellular therapies.
CD19-Targeted Therapies Maintain Market Leadership
CD19 accounted for the highest CAR-T cell therapy market share. This dominance is driven by extensive clinical validation across B-cell malignancies, including acute lymphoblastic leukemia, large B-cell lymphoma, follicular lymphoma, mantle cell lymphoma, and chronic lymphocytic leukemia. The commercial availability of multiple CD19-directed CAR-T Cell Therapies, including Kymriah, Yescarta, Breyanzi, and Aucatzyl, has further strengthened the segment's market position.
BCMA is projected to register the highest CAGR through 2035. This lucrative growth is due to the increasing adoption of BCMA-directed CAR-T Cell Therapies for multiple myeloma. Strong clinical outcomes, expansion into earlier treatment lines, and growing physician familiarity are supporting broader use of this target. Commercial momentum from Carvykti and Abecma is expected to further reinforce BCMA as a key growth opportunity within the CAR-T market.
North America Leads While Asia-Pacific Offers High-Growth Potential
North America currently represents the largest regional market, supported by its concentration of approved CAR-T Cell Therapies, specialized treatment centers, manufacturing capabilities, and established reimbursement infrastructure. Asia-Pacific is projected to register the fastest growth through 2035. Expanding domestic development pipelines, increasing treatment capacity, and evolving regulatory frameworks are expected to support broader regional adoption and create new opportunities for CAR-T developers and service providers.
Example Players in the CAR-T Cell Therapies Market
- Autolus
- bluebird bio
- Bristol Myers Squibb
- CARsgen Therapeutics
- Cellectis
- Gilead Sciences (Kite Pharma)
- Innovative Cellular Therapeutics
- Noile-Immune Biotech
- Novartis
- Shanghai GeneChem
- Sinobioway Cell Therapy
- Takara Bio
- Wellington Zhaotai Therapies
CAR-T CELL THERAPIES MARKET: RESEARCH COVERAGE
This CAR-T Cell Therapies market report provides:
- Market Forecast and Opportunity Analysis across target antigen, target indication, key geographical regions, sales forecast of drugs, and leading players
- Market Impact Analysis covering drivers, restraints, opportunities, and challenges
- Market Landscape assessment by developer type, phase of development, therapeutic area, target antigen, source of T-cells, route of administration, and company profile parameters
- Clinical Trial Analysis by registration year, enrollment, trial phase, sponsor type, and regional distribution
- CAR Construct Analysis by CAR generation, binding domain, viral vector, gene transfer method, and co-stimulatory domain
- Key Opinion Leader (KOL) Analysis of principal investigators active in CAR-T clinical research
- Company Profiles of leading and emerging CAR-T developers, including manufacturing capabilities and strategic investment activity
- Partnerships, Funding, and Patent Analysis covering deal activity, investment trends, and IP landscape
- Case Study: Cell Therapy Manufacturing comparing centralized and decentralized manufacturing models and contract manufacturing versus in-house capabilities
- Cost and Pricing Analysis of factors driving CAR-T therapy pricing and reimbursement considerations
KEY QUESTIONS ANSWERED IN THIS REPORT
- How many companies are currently engaged in the CAR-T Cell Therapies market?
- Which companies lead the CAR-T Cell Therapies market?
- What is the current and projected market size?
- Which region dominates, and which is growing fastest?
- What is driving growth in the CAR-T Cell Therapies market?
- What are the main challenges facing the market?
- What opportunities exist for distributors and logistics partners?
REASONS TO BUY THIS REPORT
- Comprehensive revenue projections for the overall CAR-T Cell Therapies market and its individual sub-segments, valuable to both established market leaders and emerging entrants.
- Competitive dynamics analysis enabling businesses to optimize market positioning and develop effective go-to-market strategies.
- A full view of drivers, barriers, opportunities, and challenges, empowering stakeholders to make data-driven decisions and capitalize on growth prospects.
- Detailed clinical trial, patent, and funding analysis providing an evidence-based view of where R&D and investor attention are concentrated.
- Company-level manufacturing and capability data, useful for distributors and logistics partners assessing where to focus cold-chain and access-support investment.
ADDITIONAL BENEFITS
- Complimentary PPT insights pack
- Complimentary Excel data packs for all analytical modules in the report
- 15% free content customization
- Detailed report walkthrough session with the research team
- Free updated report if the edition is 6-12 months old or older
TABLE OF CONTENTS
1. PREFACE
- 1.1. Introduction
- 1.2. Market Share Insights
- 1.3. Key Market Insights
- 1.4. Report Coverage
- 1.5. Key Questions Answered
- 1.6. Chapter Outlines
2. RESEARCH METHODOLOGY
- 2.1. Chapter Overview
- 2.2. Research Assumptions
- 2.2.1. Market Landscape and Market Trends
- 2.2.2. Market Forecast and Opportunity Analysis
- 2.2.3. Comparative Analysis
- 2.3. Database Building
- 2.3.1. Data Collection
- 2.3.2. Data Validation
- 2.3.3. Data Analysis
- 2.4. Project Methodology
- 2.4.1. Secondary Research
- 2.4.1.1. Annual Reports
- 2.4.1.2. Academic Research Papers
- 2.4.1.3. Company Websites
- 2.4.1.4. Investor Presentations
- 2.4.1.5. Regulatory Filings
- 2.4.1.6. White Papers
- 2.4.1.7. Industry Publications
- 2.4.1.8. Conferences and Seminars
- 2.4.1.9. Government Portals
- 2.4.1.10. Media and Press Releases
- 2.4.1.11. Newsletters
- 2.4.1.12. Industry Databases
- 2.4.1.13. Roots Proprietary Databases
- 2.4.1.14. Paid Databases and Sources
- 2.4.1.15. Social Media Portals
- 2.4.1.16. Other Secondary Sources
- 2.4.2. Primary Research
- 2.4.2.1. Types of Primary Research
- 2.4.2.1.1. Qualitative Research
- 2.4.2.1.2. Quantitative Research
- 2.4.2.1.3. Hybrid Approach
- 2.4.2.2. Advantages of Primary Research
- 2.4.2.3. Techniques for Primary Research
- 2.4.2.3.1. Interviews
- 2.4.2.3.2. Surveys
- 2.4.2.3.3. Focus Groups
- 2.4.2.3.4. Observational Research
- 2.4.2.3.5. Social Media Interactions
- 2.4.2.4. Key Opinion Leaders Considered in Primary Research
- 2.4.2.4.1. Company Executives (CXOs)
- 2.4.2.4.2. Board of Directors
- 2.4.2.4.3. Company Presidents and Vice Presidents
- 2.4.2.4.4. Research and Development Heads
- 2.4.2.4.5. Technical Experts
- 2.4.2.4.6. Subject Matter Experts
- 2.4.2.4.7. Scientists
- 2.4.2.4.8. Doctors and Other Healthcare Providers
- 2.4.2.5. Ethics and Integrity
- 2.4.2.5.1. Research Ethics
- 2.4.2.5.2. Data Integrity
- 2.4.2.1. Types of Primary Research
- 2.4.3. Analytical Tools and Databases
- 2.4.1. Secondary Research
- 2.5. Robust Quality Control
3. MARKET DYNAMICS
- 3.1. Chapter Overview
- 3.2. Forecast Methodology
- 3.2.1. Top-down Approach
- 3.2.2. Bottom-up Approach
- 3.2.3. Hybrid Approach
- 3.3. Market Assessment Framework
- 3.3.1. Total Addressable Market (TAM)
- 3.3.2. Serviceable Addressable Market (SAM)
- 3.3.3. Serviceable Obtainable Market (SOM)
- 3.3.4. Currently Acquired Market (CAM)
- 3.4. Forecasting Tools and Techniques
- 3.4.1. Qualitative Forecasting
- 3.4.2. Correlation
- 3.4.3. Regression
- 3.4.4. Extrapolation
- 3.4.5. Convergence
- 3.4.6. Sensitivity Analysis
- 3.4.7. Scenario Planning
- 3.4.8. Data Visualization
- 3.4.9. Time Series Analysis
- 3.4.10. Forecast Error Analysis
- 3.5. Key Considerations
- 3.5.1. Demographics
- 3.5.2. Government Regulations
- 3.5.3. Reimbursement Scenarios
- 3.5.4. Market Access
- 3.5.5. Supply Chain
- 3.5.6. Industry Consolidation
- 3.5.7. Pandemic / Unforeseen Disruptions Impact
- 3.6. Limitations
4. MACRO-ECONOMIC INDICATORS
- 4.1. Chapter Overview
- 4.2. Market Dynamics
- 4.2.1. Time Period
- 4.2.1.1. Historical Trends
- 4.2.1.2. Current and Forecasted Estimates
- 4.2.2. Currency Coverage
- 4.2.2.1. Major Currencies Affecting the Market
- 4.2.2.2. Factors Affecting Currency Fluctuations
- 4.2.2.3. Impact of Currency Fluctuations on the Industry
- 4.2.3. Foreign Currency Exchange Rate
- 4.2.3.1. Impact of Foreign Exchange Rate Volatility on the Market
- 4.2.3.2. Strategies for Mitigating Foreign Exchange Risk
- 4.2.4. Recession
- 4.2.4.1. Assessment of Current Economic Conditions and Potential Impact on the Market
- 4.2.4.2. Historical Analysis of Past Recessions and Lessons Learnt
- 4.2.5. Inflation
- 4.2.5.1. Measurement and Analysis of Inflationary Pressures in the Economy
- 4.2.5.2. Potential Impact of Inflation on the Market Evolution
- 4.2.6. Interest Rates
- 4.2.6.1. Interest Rates and Their Impact on the Market
- 4.2.6.2. Strategies for Managing Interest Rate Risk
- 4.2.7. Commodity Flow Analysis
- 4.2.7.1. Type of Commodity
- 4.2.7.2. Origins and Destinations
- 4.2.7.3. Values and Weights
- 4.2.7.4. Modes of Transportation
- 4.2.8. Global Trade Dynamics
- 4.2.8.1. Import Scenario
- 4.2.8.2. Export Scenario
- 4.2.8.3. Trade Policies
- 4.2.8.4. Strategies for Mitigating the Risks Associated with Trade Barriers
- 4.2.8.5. Impact of Trade Barriers on the Market
- 4.2.9. War Impact Analysis
- 4.2.9.1. Russian-Ukraine War
- 4.2.9.2. Israel-Hamas War
- 4.2.10. COVID Impact / Related Factors
- 4.2.10.1. Global Economic Impact
- 4.2.10.2. Industry-specific Impact
- 4.2.10.3. Government Response and Stimulus Measures
- 4.2.10.4. Future Outlook and Adaptation Strategies
- 4.2.11. Other Indicators
- 4.2.11.1. Fiscal Policy
- 4.2.11.2. Consumer Spending
- 4.2.11.3. Gross Domestic Product (GDP)
- 4.2.11.4. Employment
- 4.2.11.5. Taxes
- 4.2.11.6. Stock Market Performance
- 4.2.11.7. Cross-Border Dynamics
- 4.2.1. Time Period
- 4.3. Conclusion
5. EXECUTIVE SUMMARY
6. INTRODUCTION
- 6.1. Chapter Overview
- 6.2. Overview of T-cell Immunotherapies
- 6.2.1. Historical Evolution
- 6.2.2. Key Considerations for Developing T-cell Immunotherapies
- 6.2.3. Strategies Employed for the Redirection of T-cells
- 6.2.4. Manufacturing of Engineered T-cells
- 6.3. Chimeric Antigen Receptor T-cell (CAR-T) Therapy
- 6.3.1. Development History
- 6.3.2. Structure of CAR
- 6.3.2.1. Ectodomain
- 6.3.2.2. Transmembrane (TM) Domain
- 6.3.2.3. Endodomain
- 6.3.3. Development of CAR-T Cells
- 6.3.4. Universal CAR-T Cells
- 6.3.5. Route of Administration
- 6.3.6. Challenges Associated with CAR-T Cell Therapies
- 6.3.6.1. Competitive Risks
- 6.3.6.2. Clinical Risks
- 6.3.6.3. Regulatory Risks
- 6.3.6.4. Commercial Risks
- 6.4. Concluding Remarks
7. CAR-T CELL THERAPIES: MARKET LANDSCAPE
- 7.1. Chapter Overview
- 7.2. CAR-T Cell Therapies: Market Landscape
- 7.2.1. Analysis by Stage of Development
- 7.2.2. Analysis by Type of Therapy
- 7.2.3. Analysis by Target Antigen
- 7.2.4. Analysis by Target Indication
- 7.2.5. Analysis by Therapeutic Area
- 7.2.6. Analysis by Stage of Development and Therapeutic Area
- 7.2.7. Analysis by Source of T-cells
- 7.2.8. Analysis by Stage of Development and Source of T-cells
- 7.2.9. Analysis by Route of Administration
- 7.2.10. Analysis by Dosage Regimen
- 7.2.11. Analysis by Target Patient Population
- 7.2.12. Most Active Industry Players: Analysis by Number of Therapies
- 7.2.13. Most Active Non-Industry Players: Analysis by Number of Therapies
- 7.3. CAR-T Cell Therapies: Overall Developer Landscape
- 7.3.1. Analysis by Year of Establishment
- 7.3.2. Analysis by Company Size
- 7.3.3. Analysis by Location of Headquarters
8. KEY INSIGHTS
- 8.1. Chapter Overview
- 8.2. CAR-T Cell Therapies: Popular Target Antigens
- 8.2.1. Popular Targets for Hematological Malignancies
- 8.2.2. Popular Targets for Solid Tumors
- 8.3. CAR-T Therapies: CAR Construct Analysis
- 8.3.1. Analysis by Generation of CAR
- 8.3.2. Analysis by Type of scFv Antibody Used
- 8.3.3. Analysis by Type of Virus Used
- 8.3.4. Analysis by Type of Gene Transfer Method Used
- 8.3.5. Analysis by Type of Co-Stimulatory Domain
9. CLINICAL TRIAL ANALYSIS
- 9.1. Chapter Overview
- 9.2. Scope and Methodology
- 9.3. CAR-T Cell Therapies: Clinical Trial Analysis
- 9.3.1. Analysis by Trial Registration Year
- 9.3.2. Analysis of Enrolled Patient Population by Trial Registration Year
- 9.3.3. Analysis by Trial Phase
- 9.3.4. Analysis of Enrolled Patient Population by Trial Phase
- 9.3.5. Analysis by Trial Registration Year and Trial Phase
- 9.3.6. Analysis by Trial Status
- 9.3.7. Analysis by Patient Gender
- 9.3.8. Analysis by Therapeutic Area
- 9.3.9. Analysis by Study Design
- 9.3.10. Most Active Industry Players: Analysis by Number of Registered Trials
- 9.3.11. Most Active Non-Industry Players: Analysis by Number of Registered Trials
- 9.3.12. Analysis by Geography
10. KEY OPINION LEADERS
- 10.1. Chapter Overview
- 10.2. Assumptions and Key Parameters
- 10.3. Methodology
- 10.4. CAR-T Cell Therapies: Key Opinion Leaders
- 10.4.1. Analysis by Type of Organization
- 10.4.2. Analysis by Affiliated Organization
- 10.4.3. Analysis by Geographical Location of KOLs
- 10.4.4. KOL Activeness versus KOL Strength
- 10.4.5. Most Prominent KOLs: Analysis by RA score
- 10.4.6. Most Prominent KOLs: Comparison of RA Score and Third-Party Score
11. COMPANY PROFILES
- 11.1. Chapter Overview
- 11.2. Autolus
- 11.3. Bluebird Bio
- 11.4. Bristol Myers Squibb
- 11.5. CARsgen Therapeutics
- 11.6. Cellectis
- 11.7. Gilead Sciences
- 11.8. Innovative Cellular Therapeutics
- 11.9. Noile-Immune Biotech
- 11.10. Novartis
- 11.11. Sinobioway Cell Therapy
- 11.12. Takara Bio
- 11.13. Wellington Zhaotai Therapies
12. PARTNERSHIPS AND COLLABORATIONS
- 12.1. Chapter Overview
- 12.2. Partnership Models
- 12.3. CAR-T Cell Therapies: Partnerships and Collaborations
- 12.3.1. Analysis by Year of Partnership
- 12.3.2. Analysis by Type of Partnership
- 12.3.3. Analysis by Year and Type of Partnership
- 12.3.4. Analysis by Type of Partner
- 12.3.5. Most Popular Therapies: Analysis by Number of Partnerships
- 12.3.6. Most Active Industry Players: Analysis by Number of Partnerships
- 12.3.7. Most Active Non-Industry Players: Analysis by Number of Partnerships
- 12.3.8. Analysis by Geography
- 12.3.8.1. Intercontinental and Intracontinental Agreements
- 12.3.8.2. International and Local Agreements
13. FUNDING AND INVESTMENTS ANALYSIS
- 13.1. Chapter Overview
- 13.2. Types of Funding
- 13.3. CAR-T Cell Therapies: Funding and Investment Analysis
- 13.3.1. Analysis by Year of Funding
- 13.3.2. Analysis of Amount Invested
- 13.3.3. Analysis by Type of Funding
- 13.3.4. Analysis by Amount Invested and Type of Funding
- 13.3.5. Analysis of Amount Invested by Year and Type of Funding
- 13.3.6. Analysis by Type of Investor
- 13.3.7. Analysis by Geography
- 13.3.8. Most Active Players
- 13.3.9. Leading Investors: Analysis by Number of Funding Instances
14. PATENT ANALYSIS
- 14.1. Chapter Overview
- 14.2. Scope and Methodology
- 14.3. CAR-T Cell Therapies: Patent Analysis
- 14.3.1. Analysis by Patent Publication Year
- 14.3.2. Analysis by Patent Application Year
- 14.3.3. Analysis of Granted Patents and Patent Applications by Publication Year
- 14.3.4. Analysis by Patent Jurisdiction
- 14.3.5. Analysis by CPC Symbols
- 14.3.6. Analysis by Type of Applicant
- 14.3.7. Leading Industry Players: Analysis by Number of Patents
- 14.3.8. Leading Non-Industry Players: Analysis by Number of Patents
- 14.3.9. Leading Patent Assignees: Analysis by Number of Patents
- 14.4. Patent Benchmarking Analysis
- 14.4.1. Analysis by Patent Characteristics
- 14.5. Patent Valuation
- 14.6. Leading Patents by Number of Citations
15. CASE STUDY: CELL THERAPY MANUFACTURING
- 15.1. Chapter Overview
- 15.2. Overview of Cell Therapy Manufacturing
- 15.3. Cell Therapy Manufacturing Models
- 15.3.1. Centralized Manufacturing Model
- 15.3.2. Decentralized Manufacturing Model
- 15.4. Scalability of Cell Therapy Manufacturing Processes
- 15.4.1. Scale-Up
- 15.4.2. Scale-Out
- 15.5. Types of Cell Therapy Manufacturers
- 15.6. Key Challenges Related to Manufacturing of Cell Therapies
- 15.7. Key Considerations for Cell Therapy Manufacturing
- 15.7.1. Characterization
- 15.7.2. Cost of Goods
- 15.8. Automation of Cell Therapy Manufacturing Process
- 15.9. Cell Therapy Manufacturing Supply Chain
- 15.10. Comparison of Players Having In-house Capabilities and Contract Manufacturers
- 15.11. Regulatory Landscape
- 15.12. Future Perspectives
16. COST PRICE ANALYSIS
- 16.1. Chapter Overview
- 16.2. Factors Contributing to the High Price of Cell / Gene Therapies
- 16.3. Pricing Models for T-cell Immunotherapies
- 16.3.1. Based on Associated Costs
- 16.3.2. Based on Availability of Competing Products
- 16.3.3. Based on Patient Population
- 16.3.4. Based on Opinions of Industry Experts
- 16.4. Reimbursement related Considerations for T-cell Immunotherapies
- 16.4.1. Case Study: The National Institute for Health and Care Excellence (NICE) Appraisal of CAR-T Therapies
17. MARKET IMPACT ANALYSIS: DRIVERS, RESTRAINTS, OPPORTUNITIES AND CHALLENGES
- 17.1. Chapter Overview
- 17.2. Market Drivers
- 17.3. Market Restraints
- 17.4. Market Opportunities
- 17.5. Market Challenges
- 17.6. Conclusion
18. GLOBAL CAR-T CELL THERAPY MARKET
- 18.1. Chapter Overview
- 18.2. Key Assumptions and Methodology
- 18.3. Global CAR-T Cell Therapy Market, Historical Trends (since 2018) and Forecasted Estimates (till 2035)
- 18.4. Scenario Analysis
- 18.4.1. Conservative Scenario
- 18.4.2. Optimistic Scenario
- 18.5. Key Market Segmentations
19. CAR-T CELL THERAPY MARKET, BY PRODUCT
- 19.1. Chapter Overview
- 19.2. Key Assumptions and Methodology
- 19.3. CAR-T Cell Therapy Market: Distribution by Product
- 19.3.1. CAR-T Cell Therapy Market for Abecma: Forecasted Estimates (till 2035)
- 19.3.2. CAR-T Cell Therapy Market for Breyanzi: Forecasted Estimates (till 2035)
- 19.3.3. CAR-T Cell Therapy Market for Carvykti: Forecasted Estimates (till 2035)
- 19.3.4. CAR-T Cell Therapy Market for Kymriah: Forecasted Estimates (till 2035)
- 19.3.5. CAR-T Cell Therapy Market for Tecartus: Forecasted Estimates (till 2035)
- 19.3.6. CAR-T Cell Therapy Market for Yescarta: Forecasted Estimates (till 2035)
- 19.4. Data Triangulation and Validation
20. CAR-T CELL THERAPY MARKET, BY TYPE OF THERAPY
- 20.1. Chapter Overview
- 20.2. Key Assumptions and Methodology
- 20.3. CAR-T Cell Therapy Market: Distribution by Type of Therapy
- 20.3.1. CAR-T Cell Therapy Market for Autologous CAR-T Cell Therapy: Forecasted Estimates (till 2035)
- 20.3.2. CAR-T Cell Therapy Market for Allogeneic CAR-T Cell Therapy: Forecasted Estimates (till 2035)
- 20.4. Data Triangulation and Validation
21. CAR-T CELL THERAPY MARKET, BY TARGET ANTIGEN
- 21.1. Chapter Overview
- 21.2. Key Assumptions and Methodology
- 21.3. CAR-T Cell Therapy Market: Distribution by Target Antigen
- 21.3.1. CAR-T Cell Therapy Market for CD19: Forecasted Estimates (till 2035)
- 21.3.2. CAR-T Cell Therapy Market for BCMA: Forecasted Estimates (till 2035)
- 21.3.3. CAR-T Cell Therapy Market for CD20: Forecasted Estimates (till 2035)
- 21.3.4. CAR-T Cell Therapy Market for CD19/22: Forecasted Estimates (till 2035)
- 21.3.5. CAR-T Cell Therapy Market for Other Target Antigens: Forecasted Estimates (till 2035)
- 21.4. Data Triangulation and Validation
22. CAR-T CELL THERAPY MARKET, BY TARGET INDICATION
- 22.1. Chapter Overview
- 22.2. Key Assumptions and Methodology
- 22.3. CAR-T Cell Therapy Market: Distribution by Target Indication
- 22.3.1. CAR-T Cell Therapy Market for Multiple Myeloma: Forecasted Estimates (till 2035)
- 22.3.2. CAR-T Cell Therapy Market for Large B-cell Lymphoma: Forecasted Estimates (till 2035)
- 22.3.3. CAR-T Cell Therapy Market for Acute Lymphoblastic Leukemia: Forecasted Estimates (till 2035)
- 22.3.4. CAR-T Cell Therapy Market for Diffuse Large B-cell Lymphoma: Forecasted Estimates (till 2035)
- 22.3.5. CAR-T Cell Therapy Market for Follicular Lymphoma: Forecasted Estimates (till 2035)
- 22.3.6. CAR-T Cell Therapy Market for Mantle Cell Lymphoma: Forecasted Estimates (till 2035)
- 22.3.7. CAR-T Cell Therapy Market for Others: Forecasted Estimates (till 2035)
- 22.4. Data Triangulation and Validation
23. CAR-T CELL THERAPY MARKET: DISTRIBUTION BY GEOGRAPHICAL REGIONS
- 23.1. Chapter Overview
- 23.2. Key Assumptions and Methodology
- 23.3. CAR-T Cell Therapy Market: Distribution by Key Geographical Regions
- 23.3.1. CAR-T Cell Therapy Market in North America: Forecasted Estimates (till 2035)
- 23.3.2. CAR-T Cell Therapy Market in Europe: Forecasted Estimates (till 2035)
- 23.3.3. CAR-T Cell Therapy Market in Asia-Pacific: Forecasted Estimates (till 2035)
- 23.3.4. CAR-T Cell Therapy Market in Latin America: Forecasted Estimates (till 2035)
- 23.3.5. CAR-T Cell Therapy Market in Middle East and North Africa: Forecasted Estimates (till 2035)
- 23.3.6. CAR-T Cell Therapy Market in Rest of the World: Forecasted Estimates (till 2035)
- 23.4. Data Triangulation and Validation
24. CAR-T CELL THERAPY MARKET, SALES FORECAST OF DRUGS
- 24.1. Chapter Overview
- 24.2. Key Assumptions and Methodology
- 24.3. Commercialized CAR-T Cell Therapies: Sales Forecast
- 24.4. Clinical CAR-T Cell Therapies: Sales Forecast
- 24.5. Data Triangulation and Validation
25. CAR-T CELL THERAPY MARKET: SALES FORECAST OF LEADING PLAYERS
- 25.1. Chapter Overview
- 25.2. Key Assumptions and Methodology
- 25.3. CAR-T Cell Therapies: Leading Players
- 25.3.1. Gilead Sciences Sales Forecast
- 25.3.2. Bristol Myers Squibb Sales Forecast
- 25.3.3. Novartis Sales Forecast
- 25.3.4. Janssen Sales Forecast
- 25.3.5. JW Therapeutics Sales Forecast
- 25.4. Data Triangulation and Validation
26. PROMOTIONAL ANALYSIS
- 26.1. Chapter Overview
- 26.2. Channels Used for Promotional Campaigns
- 26.3. Summary of Product Website Analysis
- 26.4. Summary of Patient Support Services and Informative Downloads
- 26.5. Kymriah: Promotional Analysis
- 26.5.1. Drug Overview
- 26.5.2. Product Website Analysis
- 26.5.2.1. Message for Healthcare Professionals
- 26.5.2.2. Message for Patients
- 26.5.2.3. Informative Downloads
- 26.5.3. Patient Support Services
- 26.6. Yescarta: Promotional Analysis
- 26.6.1. Drug Overview
- 26.6.2. Product Website Analysis
- 26.6.2.1. Message for Healthcare Professionals
- 26.6.2.2. Message for Patients
- 26.6.2.3. Informative Downloads
- 26.6.3. Patient Support Services
- 26.7. Tecartus: Promotional Analysis
- 26.7.1. Drug Overview
- 26.7.2. Product Website Analysis
- 26.7.2.1. Message for Healthcare Professionals
- 26.7.2.2. Message for Patients
- 26.7.2.3. Informative Downloads
- 26.7.3. Patient Support Services
- 26.8. Breyanzi: Promotional Analysis
- 26.8.1. Drug Overview
- 26.8.2. Product Website Analysis
- 26.8.2.1. Message for Healthcare Professionals
- 26.8.2.2. Message for Patients
- 26.8.2.3. Informative Downloads
- 26.8.3. Patient Support Services
- 26.9. Abecma: Promotional Analysis
- 26.9.1. Drug Overview
- 26.9.2. Product Website Analysis
- 26.9.2.1. Message for Healthcare Professionals
- 26.9.2.2. Message for Patients
- 26.9.2.3. Informative Downloads
- 26.9.3. Patient Support Services
- 26.10. Carvykti: Promotional Analysis
- 26.10.1. Drug Overview
- 26.10.2. Product Website Analysis
- 26.10.2.1. Message for Healthcare Professionals
- 26.10.2.2. Message for Patients
- 26.10.2.3. Informative Downloads
- 26.10.3. Patient Support Services
27. EXECUTIVE INSIGHTS
28. CONCLUDING REMARKS
29. APPENDIX I: TABULATED DATA
30. APPENDIX II: LIST OF COMPANIES AND ORGANIZATIONS
31. APPENDIX III: LIST OF FUNDING AND INVESTMENTS
List of Figures
- Figure 2.1 Research Methodology: Research Assumptions
- Figure 2.2 Research Methodology: Project Methodology
- Figure 2.3 Research Methodology: Forecast Methodology
- Figure 2.4 Research Methodology: Robust Quality Control
- Figure 2.5 Research Methodology: Key Market Segmentations
- Figure 3.1 Lessons Learnt from Past Recessions
- Figure 5.1 Executive Summary: Market Landscape
- Figure 5.2 Executive Summary: Clinical Trial Analysis
- Figure 5.3 Executive Summary: Funding and Investments
- Figure 5.4 Executive Summary: Patent Analysis
- Figure 5.5 Executive Summary: Market Forecast and Opportunity Analysis
- Figure 6.1 Strategies Employed for the Redirection of T-Cells
- Figure 6.2 T-Cell Manufacturing: General Procedure
- Figure 6.3 Development History of CAR-T cells
- Figure 6.4 Structure of Chimeric Antigen Receptor
- Figure 6.5 Chimeric Antigen Receptors: Structural Variations across Different Generations
- Figure 6.6 CAR-T Cell Therapies: Development Process
- Figure 6.7 Challenges Associated with CAR-T-Cell Therapies
- Figure 7.1 CAR-T Cell Therapies: Distribution by Stage of Development
- Figure 7.2 CAR-T Cell Therapies: Distribution by Type of Therapy
- Figure 7.3 CAR-T Cell Therapies: Distribution by Target Antigen
- Figure 7.4 CAR-T Cell Therapies: Distribution by Target Indication
- Figure 7.5 CAR-T Cell Therapies: Distribution by Therapeutic Area
- Figure 7.6 CAR-T Cell Therapies: Distribution by Stage of Development and Therapeutic Area
- Figure 7.7 CAR-T Cell Therapies: Distribution by Source of T-cells
- Figure 7.8 CAR-T Cell Therapies: Distribution by Stage of Development and Source of T-cells
- Figure 7.9 CAR-T Cell Therapies: Distribution by Route of Administration
- Figure 7.10 CAR-T Cell Therapies: Distribution by Dosage Regimen
- Figure 7.11 CAR-T Cell Therapies: Distribution by Target Patient Population
- Figure 7.12 Most Active Industry Players: Analysis by Number of CAR-T Cell Therapies
- Figure 7.13 Most Active Non-Industry Players: Distribution by Number of CAR-T Cell Therapies
- Figure 7.14 CAR-T Cell Therapies Developers: Distribution by Year of Establishment
- Figure 7.15 CAR-T Cell Therapies Developers: Distribution by Company Size
- Figure 7.16 CAR-T Cell Therapies Developers: Distribution by Location of Headquarters (Region)
- Figure 7.17 CAR-T Cell Therapies Developers: Distribution by Location of Headquarters (Country)
- Figure 8.1 CAR-T Cell Therapies: Popular Targets in Hematological Malignancies
- Figure 8.2 CAR-T Cell Therapies: Popular Targets in Solid Tumors
- Figure 8.3 CAR-Construction: Distribution by Generation of CAR
- Figure 8.4 CAR-Construction: Distribution by Type of scFv Antibody
- Figure 8.5 CAR-Construction: Distribution by Type of Virus Used
- Figure 8.6 CAR-Construction: Distribution by Type of Gene Transfer Method Used
- Figure 8.7 CAR-Construction: Distribution by Type of Co-Stimulatory Domain
- Figure 9.1 Clinical Trial Analysis: Cumulative Year-wise Trend, Since 2017
- Figure 9.2 Clinical Trial Analysis: Year- wise Trend of Patients Enrolled by Trial Registration Year, Since 2017
- Figure 9.3 Clinical Trial Analysis: Distribution by Trial Phase
- Figure 9.4 Clinical Trial Analysis: Distribution of Number of Patients Enrolled by Trial Phase
- Figure 9.5 Clinical Trial Analysis: Distribution by Trial Registration Year and Trial Phase, Since 2017
- Figure 9.6 Clinical Trial Analysis: Distribution by Trial Status
- Figure 9.7 Clinical Trial Analysis: Distribution by Patient Gender
- Figure 9.8 Clinical Trial Analysis: Distribution by Therapeutic Area
- Figure 9.9 Clinical Trial Analysis: Distribution by Type of Trial Masking
- Figure 9.10 Clinical Trial Analysis: Distribution by Type of Intervention Model
- Figure 9.11 Clinical Trial Analysis: Distribution by Trial Purpose
- Figure 9.12 Clinical Trial Analysis: Distribution by Design Allocation
- Figure 9.13 Leading Industry Players: Distribution by Number of Registered Trials
- Figure 9.14 Leading Non-Industry Players: Distribution by Number of Registered Trials
- Figure 9.15 Clinical Trial Analysis: Distribution of Clinical Trials by Trial Status and Geography
- Figure 9.16 Clinical Trial Analysis: Distribution of Patients Enrolled by Trial Status and Geography
- Figure 10.1 KOL Analysis: Distribution by Type of Organization
- Figure 10.2 KOL Analysis: Distribution by Affiliated Organization
- Figure 10.3 KOL Analysis: Distribution by Qualification
- Figure 10.4 CAR-T Cell Therapies: Geographical Distribution of KOLs
- Figure 10.5 CAR-T Cell Therapies Scatter Plot: KOL Activeness versus KOL Strength
- Figure 10.6 Most Prominent KOLs: KOL Activeness versus KOL Strength
- Figure 10.7 Most Prominent KOLs: Distribution by RA Score
- Figure 10.8 Most Prominent KOLs: Comparison of RA Score with Third-Party Score
- Figure 12.1 Partnerships and Collaborations: Cumulative Year-wise Trend, Since 2015
- Figure 12.2 Partnerships and Collaborations: Distribution by Type of Partnership
- Figure 12.3 Partnerships and Collaborations: Distribution by Year and Type of Partnership
- Figure 12.4 Partnerships and Collaborations: Distribution by Type of Partner
- Figure 12.5 Most Popular Therapies: Distribution by Number of Partnerships
- Figure 12.6 Most Active Industry Players: Distribution by Number of Partnerships
- Figure 12.7 Most Active Non-Industry Players: Distribution by Number of Partnerships
- Figure 12.8 Partnerships and Collaborations: Distribution by Intracontinental and Intercontinental Agreements
- Figure 12.9 Partnerships and Collaborations: Distribution by Local and International Agreements
- Figure 13.1 Funding and Investment Analysis: Cumulative Year-wise Trend, Since 2014
- Figure 13.2 Funding and Investment Analysis: Distribution by Amount Invested, Since 2014 (USD Million)
- Figure 13.3 Funding and Investment Analysis: Distribution by Type of Funding
- Figure 13.4 Funding and Investment Analysis: Distribution by Amount Invested and Type of Funding (USD Million)
- Figure 13.5 Year-wise Distribution of Amount Invested by Type of Funding, Since 2018
- Figure 13.6 Funding and Investment Analysis: Distribution by Geography (Region)
- Figure 13.7 Funding and Investment Analysis: Distribution of Funding Instances by Geography (Country)
- Figure 13.8 Most Active Players: Distribution by Funding Instances
- Figure 13.9 Leading Investors: Distribution by Number of Funding Instances
- Figure 14.1 Patent Analysis: Distribution by Type of Patent
- Figure 14.2 Patent Analysis: Cumulative Year-wise Trend by Patent Publication Year, Since 2018
- Figure 14.3 Patent Analysis: Cumulative Year-wise Trend by Patent Application Year, Since 2017
- Figure 14.4 Patent Analysis: Year-wise Distribution of Granted Patents and Patent Applications, Since 2018
- Figure 14.5 Patent Analysis: Distribution by Patent Jurisdiction
- Figure 14.6 Patent Analysis: Distribution by CPC Symbols
- Figure 14.7 Patent Analysis: Cumulative Year-wise Distribution by Type of Applicant
- Figure 14.8 Leading Industry Players: Distribution by Number of Patents
- Figure 14.9 Leading Non-industry Players: Distribution by Number of Patents
- Figure 14.10 Leading Individual Assignees: Distribution by Number of Patents
- Figure 14.11 Patent Benchmarking Analysis: Distribution of Patent Characteristics (CPC Codes) by Leading Industry Players
- Figure 14.12 Patent Benchmarking Analysis: Distribution of Leading Industry Players by Patent Characteristics (CPC Codes)
- Figure 14.13 Patent Analysis: Distribution by Patent Age
- Figure 14.14 CAR-T Cell Therapy: Patent Valuation
- Figure 15.1 Steps for Manufacturing Cell Therapies
- Figure 15.2 Centralized Manufacturing: Process Model
- Figure 15.3 Decentralized Manufacturing: Process Model
- Figure 15.4 Cell Therapy Manufacturing: Types of Manufacturers
- Figure 15.5 Cell Therapy: Challenges and Drivers
- Figure 15.6 Cell Therapies: Potency as Critical Quality Attribute
- Figure 15.7 Cell Therapy Manufacturing: Supply Chain Model
- Figure 15.8 Cell Therapy Manufacturing: Supply Chain Risk Assessment Considerations
- Figure 16.1 Approved T-Cell Therapies: Pricing Model based on Patient Segment
- Figure 17.1 CAR-T Cell Therapies: Market Drivers
- Figure 17.2 CAR-T Cell Therapies: Market Restraints
- Figure 17.3 CAR-T Cell Therapies: Market Opportunities
- Figure 17.4 CAR-T Cell Therapies: Market Challenges
- Figure 18.1 Global CAR-T Cell Therapy Market, Historical Trends (since 2018) and Forecasted Estimates (till 2035) (USD Million)
- Figure 18.2 Global CAR-T Cell Therapy Market: Conservative Scenario, Forecasted Estimates (till 2035) (USD Million)
- Figure 18.3 Global CAR-T Cell Therapy Market: Optimistic Scenario, Forecasted Estimates (till 2035) (USD Million)
- Figure 19.1 CAR-T Cell Therapy Market: Distribution by Product
- Figure 19.2 CAR-T Cell Therapy Market for Abecma: Forecasted Estimates (till 2035)
- Figure 19.3 CAR-T Cell Therapy Market for Breyanzi: Forecasted Estimates (till 2035)
- Figure 19.4 CAR-T Cell Therapy Market for Carvykti: Forecasted Estimates (till 2035)
- Figure 19.5 CAR-T Cell Therapy Market for Kymriah: Forecasted Estimates (till 2035)
- Figure 19.6 CAR-T Cell Therapy Market for Tecartus: Forecasted Estimates (till 2035)
- Figure 19.7 CAR-T Cell Therapy Market for Yescarta: Forecasted Estimates (till 2035)
- Figure 20.1 CAR-T Cell Therapy Market: Distribution by Type of Therapy
- Figure 20.2 CAR-T Cell Therapy Market for Autologous CAR-T Cell Therapy: Forecasted Estimates (till 2035)
- Figure 20.3 CAR-T Cell Therapy Market for Allogeneic CAR-T Cell Therapy: Forecasted Estimates (till 2035)
- Figure 21.1 CAR-T Cell Therapy Market: Distribution by Target Antigen
- Figure 21.2 CAR-T Cell Therapy Market for CD19: Forecasted Estimates (till 2035) (USD Billion)
- Figure 21.3 CAR-T Cell Therapy Market for BCMA: Forecasted Estimates (till 2035) (USD Billion)
- Figure 21.4 CAR-T Cell Therapy Market for CD20: Forecasted Estimates (till 2035) (USD Billion)
- Figure 21.5 CAR-T Cell Therapy Market for CD19/22: Forecasted Estimates (till 2035) (USD Billion)
- Figure 21.6 CAR-T Cell Therapy Market for Other Target Antigens: Forecasted Estimates (till 2035) (USD Billion)
- Figure 22.1 CAR-T Cell Therapy Market: Distribution by Target Indication
- Figure 22.2 CAR-T Cell Therapy Market for Multiple Myeloma: Forecasted Estimates (till 2035) (USD Billion)
- Figure 22.3 CAR-T Cell Therapy Market for Large B-cell Lymphoma: Forecasted Estimates (till 2035) (USD Billion)
- Figure 22.4 CAR-T Cell Therapy Market for Acute Lymphoblastic Leukemia: Forecasted Estimates (till 2035) (USD Billion)
- Figure 22.5 CAR-T Cell Therapy Market for Diffuse Large B-cell Lymphoma: Forecasted Estimates (till 2035) (USD Billion)
- Figure 22.6 CAR-T Cell Therapy Market for Follicular Lymphoma: Forecasted Estimates (till 2035) (USD Billion)
- Figure 22.7 CAR-T Cell Therapy Market for Mantle Cell Lymphoma: Forecasted Estimates (till 2035) (USD Billion)
- Figure 22.8 CAR-T Cell Therapy Market for Others: Forecasted Estimates (till 2035) (USD Billion)
- Figure 23.1 CAR-T Cell Therapy Market: Distribution by Key Geographical Regions
- Figure 23.2 CAR-T Cell Therapy Market in North America: Forecasted Estimates (till 2035) (USD Billion)
- Figure 23.3 CAR-T Cell Therapy Market in Europe: Forecasted Estimates (till 2035) (USD Billion)
- Figure 23.4 CAR-T Cell Therapy Market in Asia-Pacific: Forecasted Estimates (till 2035) (USD Billion)
- Figure 23.5 CAR-T Cell Therapy Market in Latin America: Forecasted Estimates (till 2035) (USD Billion)
- Figure 23.6 CAR-T Cell Therapy Market in Middle East and North Africa: Forecasted Estimates (till 2035) (USD Billion)
- Figure 23.7 CAR-T Cell Therapy Market in Rest of the World: Forecasted Estimates (till 2035) (USD Billion)
- Figure 25.1 CAR-T Cell Therapy Market: Distribution by Key Players
- Figure 25.2 CAR-T Cell Therapy Market: Bristol Myers Squibb Sales Forecast, till 2035 (USD Million)
- Figure 25.3 CAR-T Cell Therapy Market: Janssen Sales Forecast, till 2035 (USD Million)
- Figure 25.4 CAR-T Cell Therapy Market: Gilead Sciences Sales Forecast, till 2035 (USD Million)
- Figure 25.5 CAR-T Cell Therapy Market: JW Therapeutics Sales Forecast, till 2035 (USD Million)
- Figure 25.6 CAR-T Cell Therapy Market: Novartis Sales Forecast, till 2035 (USD Million)
- Figure 26.1 Channels Used for Promotional Campaigns
- Figure 26.2 Promotional / Marketing Strategy: Product Website Analysis
- Figure 26.3 Product Website Analysis: Kymriah, Messages for Healthcare Professionals
- Figure 26.4 Product Website Analysis: Kymriah, Messages for Patients
- Figure 26.5 Product Website Analysis: Kymriah, Patient Support Program
- Figure 26.6 Product Website Analysis: Yescarta, Messages for Healthcare Professionals
- Figure 26.7 Product Website Analysis: Yescarta, Messages for Patients
- Figure 26.8 Product Website Analysis: Yescarta, Kite Konnect
- Figure 26.9 Product Website Analysis: Yescarta, Platform for Referral Patient Treatment and Connecting with Treatment Center
- Figure 26.10 Product Website Analysis: Tecartus, Messages for Healthcare Professionals
- Figure 26.11 Product Website Analysis: Tecartus, Messages for Patients
- Figure 26.12 Product Website Analysis: Tecartus, Kite Konnect
- Figure 26.13 Product Website Analysis: Breyanzi, Messages for Healthcare Professional
- Figure 26.14 Product Website Analysis: Breyanzi, Messages for Patients
- Figure 26.15 Product Website Analysis: Breyanzi, Cell Therapy 360
- Figure 26.16 Product Website Analysis: Abecma, Messages for Healthcare Professional
- Figure 26.17 Product Website Analysis: Abecma, Messages for Patients
- Figure 26.18 Product Website Analysis: Abecma, Cell Therapy 360
- Figure 26.19 Product Website Analysis: Carvykti, Messages for Healthcare Professional
- Figure 26.20 Product Website Analysis: Carvykti, Messages for Patients
- Figure 26.21 Product Website Analysis: Carvykti, MyCARVYKTI
- Figure 28.1 Concluding Remarks: Market Landscape
- Figure 28.2 Concluding Remarks: Clinical Trial Analysis
- Figure 28.3 Concluding Remarks: Funding and Investment Analysis
- Figure 28.4 Concluding Remarks: Patent Analysis
- Figure 28.5 Concluding Remarks: Market Sizing and Opportunity Analysis

