
PUBLISHER: Allied Market Research | PRODUCT CODE: 1344264

PUBLISHER: Allied Market Research | PRODUCT CODE: 1344264
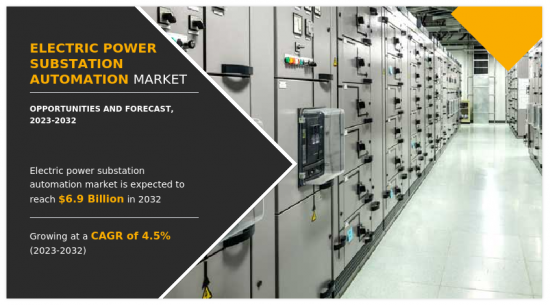
Electric Power Substation Automation Market By Offering, By Type, By Component : Global Opportunity Analysis and Industry Forecast, 2023-2032
According to a new report published by Allied Market Research, titled, "Electric Power Substation Automation Market," The electric power substation automation market was valued at $4.4 billion in 2022, and is estimated to reach $6.9 billion by 2032, growing at a CAGR of 4.5% from 2023 to 2032.
One important application of Electric Power Substation Automation is the improvement of grid reliability and operational efficiency. By deploying automation technologies, utilities can monitor and control various substation components, such as circuit breakers, transformers, and meters, in real-time. This allows for efficient detection of faults, rapid response to incidents, and effective power flow management. Automation also enables utilities to optimize the operation of substations, balance loads, and improve the overall reliability of the power grid.
Another significant application is the integration of renewable energy sources. With the increasing adoption of solar, wind, and other renewable energy technologies, substations play a crucial role in integrating these intermittent energy sources into the grid. Automation allows for real-time monitoring of renewable energy generation, effective management of power flow, and synchronization with the grid. This enables the smooth integration and optimal utilization of renewable energy resources, contributing to the transition to a more sustainable and clean energy system.
Moreover, Electric Power Substation Automation finds importance in the industrial sector. Substations equipped with automation technologies enable efficient monitoring of power usage, predictive maintenance of equipment, and the ability to detect and respond to faults promptly. This is particularly relevant in industries such as manufacturing, mining, and oil and gas, where a stable and uninterrupted power supply is essential for smooth operations.
The electric power substation automation market analysis is anticipated to expand significantly during the forecast period owing to grid modernization initiatives, and increase in demand for electricity globally. Additionally, during the forecast period, the electric power substation automation market is anticipated to benefit regional grid expansion. On the contrary, the high initial investment, and complexity of integration is the restraint for electric power substation automation market growth during the forecast period.
The electric power substation automation market is segmented on the basis of offering, type, component, and region. On the basis of offering, the market is bifurcated into software, hardware, and services. In 2022, the hardware segment dominated the market, in terms of revenue, and it is expected to acquire major market share till 2032. On the basis of type, the market is segregated into transmission substation, and distribution substation. The distribution substation segment acquired the largest share in 2022 and is expected to grow at a significant CAGR from 2023 to 2032. On the basis of component, the market is segregated into intelligent electronic devices (IEDS), programmable logic controller (PLC), supervisory control and data acquisition (SCADA), and others. The intelligent electronic devices (IEDS) segment acquired the largest share in 2022 and is expected to grow at a significant CAGR from 2023 to 2032.
Region-wise, the Electric Power Substation Automation Market trends are analyzed across North America (the U.S., Canada, and Mexico), Europe (UK, Germany, France, and rest of Europe), Asia-Pacific (China, Japan, India, South Korea, and rest of Asia-Pacific), and LAMEA (Latin America, Middle East, and Africa). Competitive analysis and profiles of the major global electric power substation automation market players that have been provided in the report include ABB Ltd, Cisco, Eaton, Hitachi Energy Ltd., Honeywell International Inc., Itron Inc., NovaTech, LLC., Rockwell Automation, Schneider Electric, and Siemens. The key strategies adopted by the major players of the electric power substation automation market are product launch, product development, partnership, investment, acquisition, contract, branding, and expansion
Key Benefits For Stakeholders
- This report provides a quantitative analysis of the market segments, current trends, estimations, and dynamics of the electric power substation automation market analysis from 2022 to 2032 to identify the prevailing electric power substation automation market opportunities.
- The market research is offered along with information related to key drivers, restraints, and opportunities.
- Porter's five forces analysis highlights the potency of buyers and suppliers to enable stakeholders make profit-oriented business decisions and strengthen their supplier-buyer network.
- In-depth analysis of the electric power substation automation market segmentation assists to determine the prevailing market opportunities.
- Major countries in each region are mapped according to their revenue contribution to the global market.
- Market player positioning facilitates benchmarking and provides a clear understanding of the present position of the market players.
- The report includes the analysis of the regional as well as global electric power substation automation market trends, key players, market segments, application areas, and market growth strategies.
Key Market Segments
By Offering
- Software
- Hardware
- Services
By Type
- Transmission Substation
- Distribution Substation
By Component
- Intelligent Electronic Devices (IEDs)
- Programmable logic controller (PLC)
- Supervisory Control and Data Acquisition (SCADA)
- Others
By Region
- North America
- U.S.
- Canada
- Mexico
- Europe
- UK
- Germany
- France
- Rest of Europe
- Asia-Pacific
- China
- Japan
- India
- South Korea
- Rest of Asia-Pacific
- LAMEA
- Latin America
- Middle East
- Africa
Key Market Players:
- ABB Ltd.
- Cisco
- Eaton Corporation
- Hitachi, Ltd.
- Honeywell International Inc.
- Itron, Inc.
- NovaTech, LLC
- Rockwell Automation Inc.
- Schneider Electric SE.
- Siemens
TABLE OF CONTENTS
CHAPTER 1: INTRODUCTION
- 1.1. Report description
- 1.2. Key market segments
- 1.3. Key benefits to the stakeholders
- 1.4. Research Methodology
- 1.4.1. Primary research
- 1.4.2. Secondary research
- 1.4.3. Analyst tools and models
CHAPTER 2: EXECUTIVE SUMMARY
- 2.1. CXO Perspective
CHAPTER 3: MARKET OVERVIEW
- 3.1. Market definition and scope
- 3.2. Key findings
- 3.2.1. Top impacting factors
- 3.2.2. Top investment pockets
- 3.3. Porter's five forces analysis
- 3.3.1. Bargaining power of suppliers
- 3.3.2. Bargaining power of buyers
- 3.3.3. Threat of substitutes
- 3.3.4. Threat of new entrants
- 3.3.5. Intensity of rivalry
- 3.4. Market dynamics
- 3.4.1. Drivers
- 3.4.1.1. Grid modernization initiatives
- 3.4.1.2. Increase in demand for electricity throughout the world
- 3.4.1. Drivers
- 3.4.2. Restraints
- 3.4.2.1. High initial investment
- 3.4.2.2. Complexity of Integration
- 3.4.3. Opportunities
- 3.4.3.1. Regional grid expansion
- 3.5. COVID-19 Impact Analysis on the market
CHAPTER 4: ELECTRIC POWER SUBSTATION AUTOMATION MARKET, BY OFFERING
- 4.1. Overview
- 4.1.1. Market size and forecast
- 4.2. Software
- 4.2.1. Key market trends, growth factors and opportunities
- 4.2.2. Market size and forecast, by region
- 4.2.3. Market share analysis by country
- 4.3. Hardware
- 4.3.1. Key market trends, growth factors and opportunities
- 4.3.2. Market size and forecast, by region
- 4.3.3. Market share analysis by country
- 4.4. Services
- 4.4.1. Key market trends, growth factors and opportunities
- 4.4.2. Market size and forecast, by region
- 4.4.3. Market share analysis by country
CHAPTER 5: ELECTRIC POWER SUBSTATION AUTOMATION MARKET, BY TYPE
- 5.1. Overview
- 5.1.1. Market size and forecast
- 5.2. Transmission Substation
- 5.2.1. Key market trends, growth factors and opportunities
- 5.2.2. Market size and forecast, by region
- 5.2.3. Market share analysis by country
- 5.3. Distribution Substation
- 5.3.1. Key market trends, growth factors and opportunities
- 5.3.2. Market size and forecast, by region
- 5.3.3. Market share analysis by country
CHAPTER 6: ELECTRIC POWER SUBSTATION AUTOMATION MARKET, BY COMPONENT
- 6.1. Overview
- 6.1.1. Market size and forecast
- 6.2. Intelligent Electronic Devices (IEDs)
- 6.2.1. Key market trends, growth factors and opportunities
- 6.2.2. Market size and forecast, by region
- 6.2.3. Market share analysis by country
- 6.3. Programmable logic controller (PLC)
- 6.3.1. Key market trends, growth factors and opportunities
- 6.3.2. Market size and forecast, by region
- 6.3.3. Market share analysis by country
- 6.4. Supervisory Control and Data Acquisition (SCADA)
- 6.4.1. Key market trends, growth factors and opportunities
- 6.4.2. Market size and forecast, by region
- 6.4.3. Market share analysis by country
- 6.5. Others
- 6.5.1. Key market trends, growth factors and opportunities
- 6.5.2. Market size and forecast, by region
- 6.5.3. Market share analysis by country
CHAPTER 7: ELECTRIC POWER SUBSTATION AUTOMATION MARKET, BY REGION
- 7.1. Overview
- 7.1.1. Market size and forecast By Region
- 7.2. North America
- 7.2.1. Key trends and opportunities
- 7.2.2. Market size and forecast, by Offering
- 7.2.3. Market size and forecast, by Type
- 7.2.4. Market size and forecast, by Component
- 7.2.5. Market size and forecast, by country
- 7.2.5.1. U.S.
- 7.2.5.1.1. Key market trends, growth factors and opportunities
- 7.2.5.1.2. Market size and forecast, by Offering
- 7.2.5.1.3. Market size and forecast, by Type
- 7.2.5.1.4. Market size and forecast, by Component
- 7.2.5.2. Canada
- 7.2.5.2.1. Key market trends, growth factors and opportunities
- 7.2.5.2.2. Market size and forecast, by Offering
- 7.2.5.2.3. Market size and forecast, by Type
- 7.2.5.2.4. Market size and forecast, by Component
- 7.2.5.3. Mexico
- 7.2.5.3.1. Key market trends, growth factors and opportunities
- 7.2.5.3.2. Market size and forecast, by Offering
- 7.2.5.3.3. Market size and forecast, by Type
- 7.2.5.3.4. Market size and forecast, by Component
- 7.3. Europe
- 7.3.1. Key trends and opportunities
- 7.3.2. Market size and forecast, by Offering
- 7.3.3. Market size and forecast, by Type
- 7.3.4. Market size and forecast, by Component
- 7.3.5. Market size and forecast, by country
- 7.3.5.1. UK
- 7.3.5.1.1. Key market trends, growth factors and opportunities
- 7.3.5.1.2. Market size and forecast, by Offering
- 7.3.5.1.3. Market size and forecast, by Type
- 7.3.5.1.4. Market size and forecast, by Component
- 7.3.5.2. Germany
- 7.3.5.2.1. Key market trends, growth factors and opportunities
- 7.3.5.2.2. Market size and forecast, by Offering
- 7.3.5.2.3. Market size and forecast, by Type
- 7.3.5.2.4. Market size and forecast, by Component
- 7.3.5.3. France
- 7.3.5.3.1. Key market trends, growth factors and opportunities
- 7.3.5.3.2. Market size and forecast, by Offering
- 7.3.5.3.3. Market size and forecast, by Type
- 7.3.5.3.4. Market size and forecast, by Component
- 7.3.5.4. Rest of Europe
- 7.3.5.4.1. Key market trends, growth factors and opportunities
- 7.3.5.4.2. Market size and forecast, by Offering
- 7.3.5.4.3. Market size and forecast, by Type
- 7.3.5.4.4. Market size and forecast, by Component
- 7.4. Asia-Pacific
- 7.4.1. Key trends and opportunities
- 7.4.2. Market size and forecast, by Offering
- 7.4.3. Market size and forecast, by Type
- 7.4.4. Market size and forecast, by Component
- 7.4.5. Market size and forecast, by country
- 7.4.5.1. China
- 7.4.5.1.1. Key market trends, growth factors and opportunities
- 7.4.5.1.2. Market size and forecast, by Offering
- 7.4.5.1.3. Market size and forecast, by Type
- 7.4.5.1.4. Market size and forecast, by Component
- 7.4.5.2. Japan
- 7.4.5.2.1. Key market trends, growth factors and opportunities
- 7.4.5.2.2. Market size and forecast, by Offering
- 7.4.5.2.3. Market size and forecast, by Type
- 7.4.5.2.4. Market size and forecast, by Component
- 7.4.5.3. India
- 7.4.5.3.1. Key market trends, growth factors and opportunities
- 7.4.5.3.2. Market size and forecast, by Offering
- 7.4.5.3.3. Market size and forecast, by Type
- 7.4.5.3.4. Market size and forecast, by Component
- 7.4.5.4. South Korea
- 7.4.5.4.1. Key market trends, growth factors and opportunities
- 7.4.5.4.2. Market size and forecast, by Offering
- 7.4.5.4.3. Market size and forecast, by Type
- 7.4.5.4.4. Market size and forecast, by Component
- 7.4.5.5. Rest of Asia-Pacific
- 7.4.5.5.1. Key market trends, growth factors and opportunities
- 7.4.5.5.2. Market size and forecast, by Offering
- 7.4.5.5.3. Market size and forecast, by Type
- 7.4.5.5.4. Market size and forecast, by Component
- 7.5. LAMEA
- 7.5.1. Key trends and opportunities
- 7.5.2. Market size and forecast, by Offering
- 7.5.3. Market size and forecast, by Type
- 7.5.4. Market size and forecast, by Component
- 7.5.5. Market size and forecast, by country
- 7.5.5.1. Latin America
- 7.5.5.1.1. Key market trends, growth factors and opportunities
- 7.5.5.1.2. Market size and forecast, by Offering
- 7.5.5.1.3. Market size and forecast, by Type
- 7.5.5.1.4. Market size and forecast, by Component
- 7.5.5.2. Middle East
- 7.5.5.2.1. Key market trends, growth factors and opportunities
- 7.5.5.2.2. Market size and forecast, by Offering
- 7.5.5.2.3. Market size and forecast, by Type
- 7.5.5.2.4. Market size and forecast, by Component
- 7.5.5.3. Africa
- 7.5.5.3.1. Key market trends, growth factors and opportunities
- 7.5.5.3.2. Market size and forecast, by Offering
- 7.5.5.3.3. Market size and forecast, by Type
- 7.5.5.3.4. Market size and forecast, by Component
CHAPTER 8: COMPETITIVE LANDSCAPE
- 8.1. Introduction
- 8.2. Top winning strategies
- 8.3. Product Mapping of Top 10 Player
- 8.4. Competitive Dashboard
- 8.5. Competitive Heatmap
- 8.6. Top player positioning, 2022
CHAPTER 9: COMPANY PROFILES
- 9.1. ABB Ltd.
- 9.1.1. Company overview
- 9.1.2. Key Executives
- 9.1.3. Company snapshot
- 9.1.4. Operating business segments
- 9.1.5. Product portfolio
- 9.1.6. Business performance
- 9.1.7. Key strategic moves and developments
- 9.2. Cisco
- 9.2.1. Company overview
- 9.2.2. Key Executives
- 9.2.3. Company snapshot
- 9.2.4. Operating business segments
- 9.2.5. Product portfolio
- 9.2.6. Business performance
- 9.3. Eaton Corporation
- 9.3.1. Company overview
- 9.3.2. Key Executives
- 9.3.3. Company snapshot
- 9.3.4. Operating business segments
- 9.3.5. Product portfolio
- 9.3.6. Business performance
- 9.3.7. Key strategic moves and developments
- 9.4. Hitachi, Ltd.
- 9.4.1. Company overview
- 9.4.2. Key Executives
- 9.4.3. Company snapshot
- 9.4.4. Operating business segments
- 9.4.5. Product portfolio
- 9.4.6. Business performance
- 9.4.7. Key strategic moves and developments
- 9.5. Honeywell International Inc.
- 9.5.1. Company overview
- 9.5.2. Key Executives
- 9.5.3. Company snapshot
- 9.5.4. Operating business segments
- 9.5.5. Product portfolio
- 9.5.6. Business performance
- 9.5.7. Key strategic moves and developments
- 9.6. Itron, Inc.
- 9.6.1. Company overview
- 9.6.2. Key Executives
- 9.6.3. Company snapshot
- 9.6.4. Operating business segments
- 9.6.5. Product portfolio
- 9.6.6. Business performance
- 9.6.7. Key strategic moves and developments
- 9.7. NovaTech, LLC
- 9.7.1. Company overview
- 9.7.2. Key Executives
- 9.7.3. Company snapshot
- 9.7.4. Operating business segments
- 9.7.5. Product portfolio
- 9.7.6. Business performance
- 9.7.7. Key strategic moves and developments
- 9.8. Rockwell Automation Inc.
- 9.8.1. Company overview
- 9.8.2. Key Executives
- 9.8.3. Company snapshot
- 9.8.4. Operating business segments
- 9.8.5. Product portfolio
- 9.8.6. Business performance
- 9.8.7. Key strategic moves and developments
- 9.9. Schneider Electric SE.
- 9.9.1. Company overview
- 9.9.2. Key Executives
- 9.9.3. Company snapshot
- 9.9.4. Operating business segments
- 9.9.5. Product portfolio
- 9.9.6. Business performance
- 9.9.7. Key strategic moves and developments
- 9.10. Siemens
- 9.10.1. Company overview
- 9.10.2. Key Executives
- 9.10.3. Company snapshot
- 9.10.4. Operating business segments
- 9.10.5. Product portfolio
- 9.10.6. Business performance
LIST OF TABLES
- TABLE 01. GLOBAL ELECTRIC POWER SUBSTATION AUTOMATION MARKET, BY OFFERING, 2022-2032 ($MILLION)
- TABLE 02. ELECTRIC POWER SUBSTATION AUTOMATION MARKET FOR SOFTWARE, BY REGION, 2022-2032 ($MILLION)
- TABLE 03. ELECTRIC POWER SUBSTATION AUTOMATION MARKET FOR HARDWARE, BY REGION, 2022-2032 ($MILLION)
- TABLE 04. ELECTRIC POWER SUBSTATION AUTOMATION MARKET FOR SERVICES, BY REGION, 2022-2032 ($MILLION)
- TABLE 05. GLOBAL ELECTRIC POWER SUBSTATION AUTOMATION MARKET, BY TYPE, 2022-2032 ($MILLION)
- TABLE 06. ELECTRIC POWER SUBSTATION AUTOMATION MARKET FOR TRANSMISSION SUBSTATION, BY REGION, 2022-2032 ($MILLION)
- TABLE 07. ELECTRIC POWER SUBSTATION AUTOMATION MARKET FOR DISTRIBUTION SUBSTATION, BY REGION, 2022-2032 ($MILLION)
- TABLE 08. GLOBAL ELECTRIC POWER SUBSTATION AUTOMATION MARKET, BY COMPONENT, 2022-2032 ($MILLION)
- TABLE 09. ELECTRIC POWER SUBSTATION AUTOMATION MARKET FOR INTELLIGENT ELECTRONIC DEVICES (IEDS), BY REGION, 2022-2032 ($MILLION)
- TABLE 10. ELECTRIC POWER SUBSTATION AUTOMATION MARKET FOR PROGRAMMABLE LOGIC CONTROLLER (PLC), BY REGION, 2022-2032 ($MILLION)
- TABLE 11. ELECTRIC POWER SUBSTATION AUTOMATION MARKET FOR SUPERVISORY CONTROL AND DATA ACQUISITION (SCADA), BY REGION, 2022-2032 ($MILLION)
- TABLE 12. ELECTRIC POWER SUBSTATION AUTOMATION MARKET FOR OTHERS, BY REGION, 2022-2032 ($MILLION)
- TABLE 13. ELECTRIC POWER SUBSTATION AUTOMATION MARKET, BY REGION, 2022-2032 ($MILLION)
- TABLE 14. NORTH AMERICA ELECTRIC POWER SUBSTATION AUTOMATION MARKET, BY OFFERING, 2022-2032 ($MILLION)
- TABLE 15. NORTH AMERICA ELECTRIC POWER SUBSTATION AUTOMATION MARKET, BY TYPE, 2022-2032 ($MILLION)
- TABLE 16. NORTH AMERICA ELECTRIC POWER SUBSTATION AUTOMATION MARKET, BY COMPONENT, 2022-2032 ($MILLION)
- TABLE 17. NORTH AMERICA ELECTRIC POWER SUBSTATION AUTOMATION MARKET, BY COUNTRY, 2022-2032 ($MILLION)
- TABLE 18. U.S. ELECTRIC POWER SUBSTATION AUTOMATION MARKET, BY OFFERING, 2022-2032 ($MILLION)
- TABLE 19. U.S. ELECTRIC POWER SUBSTATION AUTOMATION MARKET, BY TYPE, 2022-2032 ($MILLION)
- TABLE 20. U.S. ELECTRIC POWER SUBSTATION AUTOMATION MARKET, BY COMPONENT, 2022-2032 ($MILLION)
- TABLE 21. CANADA ELECTRIC POWER SUBSTATION AUTOMATION MARKET, BY OFFERING, 2022-2032 ($MILLION)
- TABLE 22. CANADA ELECTRIC POWER SUBSTATION AUTOMATION MARKET, BY TYPE, 2022-2032 ($MILLION)
- TABLE 23. CANADA ELECTRIC POWER SUBSTATION AUTOMATION MARKET, BY COMPONENT, 2022-2032 ($MILLION)
- TABLE 24. MEXICO ELECTRIC POWER SUBSTATION AUTOMATION MARKET, BY OFFERING, 2022-2032 ($MILLION)
- TABLE 25. MEXICO ELECTRIC POWER SUBSTATION AUTOMATION MARKET, BY TYPE, 2022-2032 ($MILLION)
- TABLE 26. MEXICO ELECTRIC POWER SUBSTATION AUTOMATION MARKET, BY COMPONENT, 2022-2032 ($MILLION)
- TABLE 27. EUROPE ELECTRIC POWER SUBSTATION AUTOMATION MARKET, BY OFFERING, 2022-2032 ($MILLION)
- TABLE 28. EUROPE ELECTRIC POWER SUBSTATION AUTOMATION MARKET, BY TYPE, 2022-2032 ($MILLION)
- TABLE 29. EUROPE ELECTRIC POWER SUBSTATION AUTOMATION MARKET, BY COMPONENT, 2022-2032 ($MILLION)
- TABLE 30. EUROPE ELECTRIC POWER SUBSTATION AUTOMATION MARKET, BY COUNTRY, 2022-2032 ($MILLION)
- TABLE 31. UK ELECTRIC POWER SUBSTATION AUTOMATION MARKET, BY OFFERING, 2022-2032 ($MILLION)
- TABLE 32. UK ELECTRIC POWER SUBSTATION AUTOMATION MARKET, BY TYPE, 2022-2032 ($MILLION)
- TABLE 33. UK ELECTRIC POWER SUBSTATION AUTOMATION MARKET, BY COMPONENT, 2022-2032 ($MILLION)
- TABLE 34. GERMANY ELECTRIC POWER SUBSTATION AUTOMATION MARKET, BY OFFERING, 2022-2032 ($MILLION)
- TABLE 35. GERMANY ELECTRIC POWER SUBSTATION AUTOMATION MARKET, BY TYPE, 2022-2032 ($MILLION)
- TABLE 36. GERMANY ELECTRIC POWER SUBSTATION AUTOMATION MARKET, BY COMPONENT, 2022-2032 ($MILLION)
- TABLE 37. FRANCE ELECTRIC POWER SUBSTATION AUTOMATION MARKET, BY OFFERING, 2022-2032 ($MILLION)
- TABLE 38. FRANCE ELECTRIC POWER SUBSTATION AUTOMATION MARKET, BY TYPE, 2022-2032 ($MILLION)
- TABLE 39. FRANCE ELECTRIC POWER SUBSTATION AUTOMATION MARKET, BY COMPONENT, 2022-2032 ($MILLION)
- TABLE 40. REST OF EUROPE ELECTRIC POWER SUBSTATION AUTOMATION MARKET, BY OFFERING, 2022-2032 ($MILLION)
- TABLE 41. REST OF EUROPE ELECTRIC POWER SUBSTATION AUTOMATION MARKET, BY TYPE, 2022-2032 ($MILLION)
- TABLE 42. REST OF EUROPE ELECTRIC POWER SUBSTATION AUTOMATION MARKET, BY COMPONENT, 2022-2032 ($MILLION)
- TABLE 43. ASIA-PACIFIC ELECTRIC POWER SUBSTATION AUTOMATION MARKET, BY OFFERING, 2022-2032 ($MILLION)
- TABLE 44. ASIA-PACIFIC ELECTRIC POWER SUBSTATION AUTOMATION MARKET, BY TYPE, 2022-2032 ($MILLION)
- TABLE 45. ASIA-PACIFIC ELECTRIC POWER SUBSTATION AUTOMATION MARKET, BY COMPONENT, 2022-2032 ($MILLION)
- TABLE 46. ASIA-PACIFIC ELECTRIC POWER SUBSTATION AUTOMATION MARKET, BY COUNTRY, 2022-2032 ($MILLION)
- TABLE 47. CHINA ELECTRIC POWER SUBSTATION AUTOMATION MARKET, BY OFFERING, 2022-2032 ($MILLION)
- TABLE 48. CHINA ELECTRIC POWER SUBSTATION AUTOMATION MARKET, BY TYPE, 2022-2032 ($MILLION)
- TABLE 49. CHINA ELECTRIC POWER SUBSTATION AUTOMATION MARKET, BY COMPONENT, 2022-2032 ($MILLION)
- TABLE 50. JAPAN ELECTRIC POWER SUBSTATION AUTOMATION MARKET, BY OFFERING, 2022-2032 ($MILLION)
- TABLE 51. JAPAN ELECTRIC POWER SUBSTATION AUTOMATION MARKET, BY TYPE, 2022-2032 ($MILLION)
- TABLE 52. JAPAN ELECTRIC POWER SUBSTATION AUTOMATION MARKET, BY COMPONENT, 2022-2032 ($MILLION)
- TABLE 53. INDIA ELECTRIC POWER SUBSTATION AUTOMATION MARKET, BY OFFERING, 2022-2032 ($MILLION)
- TABLE 54. INDIA ELECTRIC POWER SUBSTATION AUTOMATION MARKET, BY TYPE, 2022-2032 ($MILLION)
- TABLE 55. INDIA ELECTRIC POWER SUBSTATION AUTOMATION MARKET, BY COMPONENT, 2022-2032 ($MILLION)
- TABLE 56. SOUTH KOREA ELECTRIC POWER SUBSTATION AUTOMATION MARKET, BY OFFERING, 2022-2032 ($MILLION)
- TABLE 57. SOUTH KOREA ELECTRIC POWER SUBSTATION AUTOMATION MARKET, BY TYPE, 2022-2032 ($MILLION)
- TABLE 58. SOUTH KOREA ELECTRIC POWER SUBSTATION AUTOMATION MARKET, BY COMPONENT, 2022-2032 ($MILLION)
- TABLE 59. REST OF ASIA-PACIFIC ELECTRIC POWER SUBSTATION AUTOMATION MARKET, BY OFFERING, 2022-2032 ($MILLION)
- TABLE 60. REST OF ASIA-PACIFIC ELECTRIC POWER SUBSTATION AUTOMATION MARKET, BY TYPE, 2022-2032 ($MILLION)
- TABLE 61. REST OF ASIA-PACIFIC ELECTRIC POWER SUBSTATION AUTOMATION MARKET, BY COMPONENT, 2022-2032 ($MILLION)
- TABLE 62. LAMEA ELECTRIC POWER SUBSTATION AUTOMATION MARKET, BY OFFERING, 2022-2032 ($MILLION)
- TABLE 63. LAMEA ELECTRIC POWER SUBSTATION AUTOMATION MARKET, BY TYPE, 2022-2032 ($MILLION)
- TABLE 64. LAMEA ELECTRIC POWER SUBSTATION AUTOMATION MARKET, BY COMPONENT, 2022-2032 ($MILLION)
- TABLE 65. LAMEA ELECTRIC POWER SUBSTATION AUTOMATION MARKET, BY COUNTRY, 2022-2032 ($MILLION)
- TABLE 66. LATIN AMERICA ELECTRIC POWER SUBSTATION AUTOMATION MARKET, BY OFFERING, 2022-2032 ($MILLION)
- TABLE 67. LATIN AMERICA ELECTRIC POWER SUBSTATION AUTOMATION MARKET, BY TYPE, 2022-2032 ($MILLION)
- TABLE 68. LATIN AMERICA ELECTRIC POWER SUBSTATION AUTOMATION MARKET, BY COMPONENT, 2022-2032 ($MILLION)
- TABLE 69. MIDDLE EAST ELECTRIC POWER SUBSTATION AUTOMATION MARKET, BY OFFERING, 2022-2032 ($MILLION)
- TABLE 70. MIDDLE EAST ELECTRIC POWER SUBSTATION AUTOMATION MARKET, BY TYPE, 2022-2032 ($MILLION)
- TABLE 71. MIDDLE EAST ELECTRIC POWER SUBSTATION AUTOMATION MARKET, BY COMPONENT, 2022-2032 ($MILLION)
- TABLE 72. AFRICA ELECTRIC POWER SUBSTATION AUTOMATION MARKET, BY OFFERING, 2022-2032 ($MILLION)
- TABLE 73. AFRICA ELECTRIC POWER SUBSTATION AUTOMATION MARKET, BY TYPE, 2022-2032 ($MILLION)
- TABLE 74. AFRICA ELECTRIC POWER SUBSTATION AUTOMATION MARKET, BY COMPONENT, 2022-2032 ($MILLION)
- TABLE 75. ABB LTD.: KEY EXECUTIVES
- TABLE 76. ABB LTD.: COMPANY SNAPSHOT
- TABLE 77. ABB LTD.: PRODUCT SEGMENTS
- TABLE 78. ABB LTD.: PRODUCT PORTFOLIO
- TABLE 79. ABB LTD.: KEY STRATERGIES
- TABLE 80. CISCO: KEY EXECUTIVES
- TABLE 81. CISCO: COMPANY SNAPSHOT
- TABLE 82. CISCO: SERVICE SEGMENTS
- TABLE 83. CISCO: PRODUCT PORTFOLIO
- TABLE 84. EATON CORPORATION: KEY EXECUTIVES
- TABLE 85. EATON CORPORATION: COMPANY SNAPSHOT
- TABLE 86. EATON CORPORATION: PRODUCT SEGMENTS
- TABLE 87. EATON CORPORATION: PRODUCT PORTFOLIO
- TABLE 88. EATON CORPORATION: KEY STRATERGIES
- TABLE 89. HITACHI, LTD.: KEY EXECUTIVES
- TABLE 90. HITACHI, LTD.: COMPANY SNAPSHOT
- TABLE 91. HITACHI, LTD.: SERVICE SEGMENTS
- TABLE 92. HITACHI, LTD.: PRODUCT PORTFOLIO
- TABLE 93. HITACHI, LTD.: KEY STRATERGIES
- TABLE 94. HONEYWELL INTERNATIONAL INC.: KEY EXECUTIVES
- TABLE 95. HONEYWELL INTERNATIONAL INC.: COMPANY SNAPSHOT
- TABLE 96. HONEYWELL INTERNATIONAL INC.: PRODUCT SEGMENTS
- TABLE 97. HONEYWELL INTERNATIONAL INC.: PRODUCT PORTFOLIO
- TABLE 98. HONEYWELL INTERNATIONAL INC.: KEY STRATERGIES
- TABLE 99. ITRON, INC.: KEY EXECUTIVES
- TABLE 100. ITRON, INC.: COMPANY SNAPSHOT
- TABLE 101. ITRON, INC.: PRODUCT SEGMENTS
- TABLE 102. ITRON, INC.: PRODUCT PORTFOLIO
- TABLE 103. ITRON, INC.: KEY STRATERGIES
- TABLE 104. NOVATECH, LLC: KEY EXECUTIVES
- TABLE 105. NOVATECH, LLC: COMPANY SNAPSHOT
- TABLE 106. NOVATECH, LLC: PRODUCT SEGMENTS
- TABLE 107. NOVATECH, LLC: PRODUCT PORTFOLIO
- TABLE 108. NOVATECH, LLC: KEY STRATERGIES
- TABLE 109. ROCKWELL AUTOMATION INC.: KEY EXECUTIVES
- TABLE 110. ROCKWELL AUTOMATION INC.: COMPANY SNAPSHOT
- TABLE 111. ROCKWELL AUTOMATION INC.: SERVICE SEGMENTS
- TABLE 112. ROCKWELL AUTOMATION INC.: PRODUCT PORTFOLIO
- TABLE 113. ROCKWELL AUTOMATION INC.: KEY STRATERGIES
- TABLE 114. SCHNEIDER ELECTRIC SE.: KEY EXECUTIVES
- TABLE 115. SCHNEIDER ELECTRIC SE.: COMPANY SNAPSHOT
- TABLE 116. SCHNEIDER ELECTRIC SE.: PRODUCT SEGMENTS
- TABLE 117. SCHNEIDER ELECTRIC SE.: PRODUCT PORTFOLIO
- TABLE 118. SCHNEIDER ELECTRIC SE.: KEY STRATERGIES
- TABLE 119. SIEMENS: KEY EXECUTIVES
- TABLE 120. SIEMENS: COMPANY SNAPSHOT
- TABLE 121. SIEMENS: PRODUCT SEGMENTS
- TABLE 122. SIEMENS: PRODUCT PORTFOLIO
LIST OF FIGURES
- FIGURE 01. ELECTRIC POWER SUBSTATION AUTOMATION MARKET, 2022-2032
- FIGURE 02. SEGMENTATION OF ELECTRIC POWER SUBSTATION AUTOMATION MARKET, 2022-2032
- FIGURE 03. TOP INVESTMENT POCKETS IN ELECTRIC POWER SUBSTATION AUTOMATION MARKET (2023-2032)
- FIGURE 04. LOW TO HIGH BARGAINING POWER OF SUPPLIERS
- FIGURE 05. LOW TO HIGH BARGAINING POWER OF BUYERS
- FIGURE 06. LOW TO HIGH THREAT OF SUBSTITUTES
- FIGURE 07. LOW TO HIGH THREAT OF NEW ENTRANTS
- FIGURE 08. LOW TO HIGH INTENSITY OF RIVALRY
- FIGURE 09. DRIVERS, RESTRAINTS AND OPPORTUNITIES: GLOBALELECTRIC POWER SUBSTATION AUTOMATION MARKET
- FIGURE 10. ELECTRIC POWER SUBSTATION AUTOMATION MARKET, BY OFFERING, 2022(%)
- FIGURE 11. COMPARATIVE SHARE ANALYSIS OF ELECTRIC POWER SUBSTATION AUTOMATION MARKET FOR SOFTWARE, BY COUNTRY 2022 AND 2032(%)
- FIGURE 12. COMPARATIVE SHARE ANALYSIS OF ELECTRIC POWER SUBSTATION AUTOMATION MARKET FOR HARDWARE, BY COUNTRY 2022 AND 2032(%)
- FIGURE 13. COMPARATIVE SHARE ANALYSIS OF ELECTRIC POWER SUBSTATION AUTOMATION MARKET FOR SERVICES, BY COUNTRY 2022 AND 2032(%)
- FIGURE 14. ELECTRIC POWER SUBSTATION AUTOMATION MARKET, BY TYPE, 2022(%)
- FIGURE 15. COMPARATIVE SHARE ANALYSIS OF ELECTRIC POWER SUBSTATION AUTOMATION MARKET FOR TRANSMISSION SUBSTATION, BY COUNTRY 2022 AND 2032(%)
- FIGURE 16. COMPARATIVE SHARE ANALYSIS OF ELECTRIC POWER SUBSTATION AUTOMATION MARKET FOR DISTRIBUTION SUBSTATION, BY COUNTRY 2022 AND 2032(%)
- FIGURE 17. ELECTRIC POWER SUBSTATION AUTOMATION MARKET, BY COMPONENT, 2022(%)
- FIGURE 18. COMPARATIVE SHARE ANALYSIS OF ELECTRIC POWER SUBSTATION AUTOMATION MARKET FOR INTELLIGENT ELECTRONIC DEVICES (IEDS), BY COUNTRY 2022 AND 2032(%)
- FIGURE 19. COMPARATIVE SHARE ANALYSIS OF ELECTRIC POWER SUBSTATION AUTOMATION MARKET FOR PROGRAMMABLE LOGIC CONTROLLER (PLC), BY COUNTRY 2022 AND 2032(%)
- FIGURE 20. COMPARATIVE SHARE ANALYSIS OF ELECTRIC POWER SUBSTATION AUTOMATION MARKET FOR SUPERVISORY CONTROL AND DATA ACQUISITION (SCADA), BY COUNTRY 2022 AND 2032(%)
- FIGURE 21. COMPARATIVE SHARE ANALYSIS OF ELECTRIC POWER SUBSTATION AUTOMATION MARKET FOR OTHERS, BY COUNTRY 2022 AND 2032(%)
- FIGURE 22. ELECTRIC POWER SUBSTATION AUTOMATION MARKET BY REGION, 2022
- FIGURE 23. U.S. ELECTRIC POWER SUBSTATION AUTOMATION MARKET, 2022-2032 ($MILLION)
- FIGURE 24. CANADA ELECTRIC POWER SUBSTATION AUTOMATION MARKET, 2022-2032 ($MILLION)
- FIGURE 25. MEXICO ELECTRIC POWER SUBSTATION AUTOMATION MARKET, 2022-2032 ($MILLION)
- FIGURE 26. UK ELECTRIC POWER SUBSTATION AUTOMATION MARKET, 2022-2032 ($MILLION)
- FIGURE 27. GERMANY ELECTRIC POWER SUBSTATION AUTOMATION MARKET, 2022-2032 ($MILLION)
- FIGURE 28. FRANCE ELECTRIC POWER SUBSTATION AUTOMATION MARKET, 2022-2032 ($MILLION)
- FIGURE 29. REST OF EUROPE ELECTRIC POWER SUBSTATION AUTOMATION MARKET, 2022-2032 ($MILLION)
- FIGURE 30. CHINA ELECTRIC POWER SUBSTATION AUTOMATION MARKET, 2022-2032 ($MILLION)
- FIGURE 31. JAPAN ELECTRIC POWER SUBSTATION AUTOMATION MARKET, 2022-2032 ($MILLION)
- FIGURE 32. INDIA ELECTRIC POWER SUBSTATION AUTOMATION MARKET, 2022-2032 ($MILLION)
- FIGURE 33. SOUTH KOREA ELECTRIC POWER SUBSTATION AUTOMATION MARKET, 2022-2032 ($MILLION)
- FIGURE 34. REST OF ASIA-PACIFIC ELECTRIC POWER SUBSTATION AUTOMATION MARKET, 2022-2032 ($MILLION)
- FIGURE 35. LATIN AMERICA ELECTRIC POWER SUBSTATION AUTOMATION MARKET, 2022-2032 ($MILLION)
- FIGURE 36. MIDDLE EAST ELECTRIC POWER SUBSTATION AUTOMATION MARKET, 2022-2032 ($MILLION)
- FIGURE 37. AFRICA ELECTRIC POWER SUBSTATION AUTOMATION MARKET, 2022-2032 ($MILLION)
- FIGURE 38. TOP WINNING STRATEGIES, BY YEAR
- FIGURE 39. TOP WINNING STRATEGIES, BY DEVELOPMENT
- FIGURE 40. TOP WINNING STRATEGIES, BY COMPANY
- FIGURE 41. PRODUCT MAPPING OF TOP 10 PLAYERS
- FIGURE 42. COMPETITIVE DASHBOARD
- FIGURE 43. COMPETITIVE HEATMAP: ELECTRIC POWER SUBSTATION AUTOMATION MARKET
- FIGURE 44. TOP PLAYER POSITIONING, 2022
- FIGURE 45. ABB LTD.: NET REVENUE, 2020-2022 ($MILLION)
- FIGURE 46. ABB LTD.: RESEARCH & DEVELOPMENT EXPENDITURE, 2020-2022 ($MILLION)
- FIGURE 47. ABB LTD.: REVENUE SHARE BY REGION, 2022 (%)
- FIGURE 48. ABB LTD.: REVENUE SHARE BY SEGMENT, 2022 (%)
- FIGURE 49. CISCO: NET REVENUE, 2020-2022 ($MILLION)
- FIGURE 50. CISCO: RESEARCH & DEVELOPMENT EXPENDITURE, 2020-2022 ($MILLION)
- FIGURE 51. CISCO: REVENUE SHARE BY REGION, 2022 (%)
- FIGURE 52. EATON CORPORATION: NET SALES, 2020-2022 ($MILLION)
- FIGURE 53. EATON CORPORATION: RESEARCH & DEVELOPMENT EXPENDITURE, 2020-2022 ($MILLION)
- FIGURE 54. EATON CORPORATION: REVENUE SHARE BY REGION, 2021 (%)
- FIGURE 55. EATON CORPORATION: REVENUE SHARE BY SEGMENT, 2021 (%)
- FIGURE 56. HITACHI, LTD.: NET REVENUE, 2020-2022 ($MILLION)
- FIGURE 57. HITACHI, LTD.: REVENUE SHARE BY SEGMENT, 2022 (%)
- FIGURE 58. HITACHI, LTD.: REVENUE SHARE BY REGION, 2022 (%)
- FIGURE 59. HONEYWELL INTERNATIONAL INC.: NET REVENUE, 2020-2022 ($MILLION)
- FIGURE 60. HONEYWELL INTERNATIONAL INC.: RESEARCH & DEVELOPMENT EXPENDITURE, 2020-2022 ($MILLION)
- FIGURE 61. HONEYWELL INTERNATIONAL INC.: REVENUE SHARE BY SEGMENT, 2022 (%)
- FIGURE 62. HONEYWELL INTERNATIONAL INC.: REVENUE SHARE BY REGION, 2022 (%)
- FIGURE 63. ITRON, INC.: NET REVENUE, 2020-2022 ($MILLION)
- FIGURE 64. ITRON, INC.: RESEARCH & DEVELOPMENT EXPENDITURE, 2020-2022 ($MILLION)
- FIGURE 65. ITRON, INC.: GROSS PROFIT, 2020-2022 ($MILLION)
- FIGURE 66. ITRON, INC.: REVENUE SHARE BY SEGMENT, 2022 (%)
- FIGURE 67. ITRON, INC.: REVENUE SHARE BY REGION, 2022 (%)
- FIGURE 68. NOVATECH, LLC: NET REVENUE, 2020-2022 ($MILLION)
- FIGURE 69. NOVATECH, LLC: REVENUE SHARE BY SEGMENT, 2022 (%)
- FIGURE 70. NOVATECH, LLC: REVENUE SHARE BY REGION, 2022 (%)
- FIGURE 71. ROCKWELL AUTOMATION INC.: NET SALES, 2020-2022 ($MILLION)
- FIGURE 72. ROCKWELL AUTOMATION INC.: REVENUE SHARE BY SEGMENT, 2022 (%)
- FIGURE 73. ROCKWELL AUTOMATION INC.: REVENUE SHARE BY REGION, 2022 (%)
- FIGURE 74. SCHNEIDER ELECTRIC SE.: NET REVENUE, 2020-2022 ($MILLION)
- FIGURE 75. SCHNEIDER ELECTRIC SE.: RESEARCH & DEVELOPMENT EXPENDITURE, 2020-2022 ($MILLION)
- FIGURE 76. SCHNEIDER ELECTRIC SE.: REVENUE SHARE BY SEGMENT, 2022 (%)
- FIGURE 77. SCHNEIDER ELECTRIC SE.: REVENUE SHARE BY REGION, 2022 (%)
- FIGURE 78. SIEMENS: NET REVENUE, 2020-2022 ($MILLION)
- FIGURE 79. SIEMENS: REVENUE SHARE BY SEGMENT, 2022 (%)
- FIGURE 80. SIEMENS: REVENUE SHARE BY REGION, 2022 (%)

