
PUBLISHER: Global Market Insights Inc. | PRODUCT CODE: 1766290

PUBLISHER: Global Market Insights Inc. | PRODUCT CODE: 1766290
Microinverter Market Opportunity, Growth Drivers, Industry Trend Analysis, and Forecast 2025 - 2034
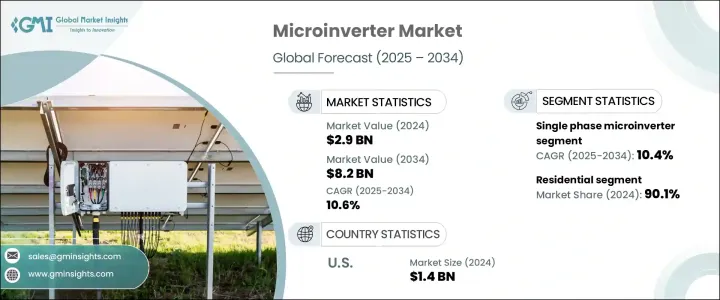
The Global Microinverter Market was valued at USD 2.9 billion in 2024 and is estimated to grow at a CAGR of 10.6% to reach USD 8.2 billion by 2034. The rising popularity of plug-and-play solar systems is significantly contributing to market expansion. These systems are easy to install, require little maintenance, and offer more flexibility, making them highly attractive for residential users and DIY solar enthusiasts. As more consumers prefer streamlined solar setups, demand for embedded microinverter technology continues to rise. The increasing need for resilient energy solutions and fast power restoration in outage-prone areas further fuels the adoption of microinverters. Their ability to keep systems partially operational during faults enhances overall grid reliability. Shifts toward smart distributed energy systems also bolster their uptake.
The growing focus on safety, efficiency, and real-time solar energy management is accelerating the integration of module-level power electronics. Microinverters support this trend by offering real-time system diagnostics, faster shutdown capabilities, and higher energy yields. These benefits are particularly vital as regulatory safety standards continue to evolve. The sustained momentum in the residential photovoltaic sector plays a pivotal role in driving market penetration and long-term growth prospects for microinverter solutions.
| Market Scope | |
|---|---|
| Start Year | 2024 |
| Forecast Year | 2025-2034 |
| Start Value | $2.9 Billion |
| Forecast Value | $8.2 Billion |
| CAGR | 10.6% |
The three-phase segment in the microinverter market is forecasted to generate USD 800 million by 2034. This growth is driven by expanding commercial and industrial solar deployments that demand greater power handling and reliable energy distribution across all three phases. Rising investments in large-scale solar projects, coupled with an increasing focus on balanced load distribution and advanced grid compatibility, are expected to support the adoption of three-phase systems. Enhanced fault detection and smarter grid communication technologies will also boost the segment's appeal in industrial applications.
In 2024, the residential segment accounted for a 90.1% share. The surge in demand for highly efficient, user-friendly home solar energy solutions is at the heart of this dominance. As homeowners prioritize system simplicity and safety, microinverters are becoming an integral part of residential solar installations. Their minimal maintenance requirements and improved performance further position them as a preferred choice.
Europe Microinverter Market is expected to register a CAGR of 12.4% through 2034, driven by consistent investment in decentralized solar energy infrastructure and a strong push for carbon neutrality. Supportive grid modernization efforts and policies such as net metering continue to foster the growth of microinverter installations across the region. The increasing focus on energy independence, especially in residential sectors, is projected to enhance product adoption and regional market share.
Major participants in the Global Microinverter Industry include Yotta Energy, Growatt New Energy, SMA Solar Technology, APSystems, Darfon Electronics, Chisageess, Fimer Group, AEconversion, Envertech, Sugrow, Deye Inverter Technology, Shenzhen Sako Solar, LeadSolar Energy, Northern Electric Power Technology, Enphase Energy, TSUNESS, Chilicon Power, Hoymiles, Sparq System, and NingBo Deye Inverter Technology. To strengthen their competitive standing, leading companies in the microinverter space are investing heavily in R&D to develop compact, highly efficient, and grid-compliant inverter technologies. Manufacturers are rolling out microinverters with enhanced real-time monitoring, faster shutdown features, and higher power handling to meet evolving residential and commercial needs. Strategic alliances with solar panel producers and installation providers enable wider distribution and product bundling. Market players are also expanding into emerging regions where rooftop solar deployment is rising. Some focus on vertical integration to reduce manufacturing costs and gain better control over supply chains.
Table of Contents
Chapter 1 Methodology & Scope
- 1.1 Research design
- 1.2 Base estimates & calculations
- 1.3 Forecast calculation
- 1.4 Primary research & validation
- 1.4.1 Primary sources
- 1.4.2 Data mining sources
- 1.5 Market definitions
Chapter 2 Executive Summary
- 2.1 Industry synopsis, 2021 - 2034
Chapter 3 Industry Insights
- 3.1 Industry ecosystem
- 3.2 Regulatory landscape
- 3.3 Industry impact forces
- 3.3.1 Growth drivers
- 3.3.2 Industry pitfalls & challenges
- 3.4 Growth potential analysis
- 3.5 Porter's analysis
- 3.5.1 Bargaining power of suppliers
- 3.5.2 Bargaining power of buyers
- 3.5.3 Threat of new entrants
- 3.5.4 Threat of substitutes
- 3.6 PESTEL analysis
Chapter 4 Competitive landscape, 2024
- 4.1 Introduction
- 4.2 Company market share
- 4.3 Strategic dashboard
- 4.4 Strategic initiative
- 4.5 Competitive benchmarking
- 4.6 Innovation & sustainability landscape
Chapter 5 Market Size and Forecast, By Phase, 2021 - 2034 (USD Million & MW)
- 5.1 Key trends
- 5.2 Single phase
- 5.3 Three phase
Chapter 6 Market Size and Forecast, By Connectivity, 2021 - 2034 (USD Million & MW)
- 6.1 Key trends
- 6.2 Stand alone
- 6.3 On grid
Chapter 7 Market Size and Forecast, By Application, 2021 - 2034 (USD Million & MW)
- 7.1 Key trends
- 7.2 Residential
- 7.3 Commercial
Chapter 8 Market Size and Forecast, By Region, 2021 - 2034 (USD Million & MW)
- 8.1 Key trends
- 8.2 North America
- 8.2.1 U.S.
- 8.2.2 Canada
- 8.3 Europe
- 8.3.1 Germany
- 8.3.2 Italy
- 8.3.3 Poland
- 8.3.4 Netherlands
- 8.3.5 Austria
- 8.3.6 UK
- 8.3.7 France
- 8.3.8 Spain
- 8.3.9 Belgium
- 8.4 Asia Pacific
- 8.4.1 China
- 8.4.2 Japan
- 8.4.3 India
- 8.4.4 South Korea
- 8.4.5 Australia
- 8.5 Middle East & Africa
- 8.5.1 Israel
- 8.5.2 Saudi Arabia
- 8.5.3 UAE
- 8.5.4 South Africa
- 8.5.5 Egypt
- 8.5.6 Nigeria
- 8.6 Latin America
- 8.6.1 Brazil
- 8.6.2 Chile
- 8.6.3 Mexico
Chapter 9 Company Profiles
- 9.1 AEconversion
- 9.2 APSystems
- 9.3 Chilicon Power
- 9.4 Chisageess
- 9.5 Darfon Electronics
- 9.6 Deye Inverter Technology
- 9.7 Dongguan Maywah
- 9.8 Enphase Energy
- 9.9 Fimer Group
- 9.10 Growatt New Energy
- 9.11 Hoymiles
- 9.12 Envertech
- 9.13 LeadSolar Energy
- 9.14 NingBo Deye Inverter Technology
- 9.15 Northern Electric Power Technology
- 9.16 Sensata Technologies
- 9.17 Shenzhen Sako Solar
- 9.18 SMA Solar Technology
- 9.19 Sparq System
- 9.20 Sugrow
- 9.21 TSUNESS
- 9.22 Yotta Energy

