
PUBLISHER: Global Market Insights Inc. | PRODUCT CODE: 1698533

PUBLISHER: Global Market Insights Inc. | PRODUCT CODE: 1698533
Glycerol Market Opportunity, Growth Drivers, Industry Trend Analysis, and Forecast 2025-2034
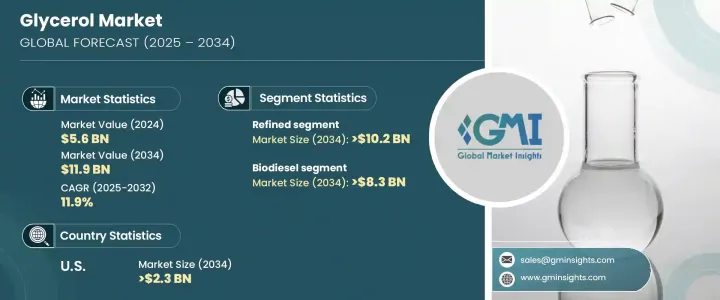
The Global Glycerol Market was valued at USD 5.6 billion in 2024 and is projected to grow at a CAGR of over 11.9% from 2025 to 2034. The demand for glycerol is rising due to its role in personal care, pharmaceuticals, food and beverages, and biofuels. Its emollient, lubricating, and moisturizing properties make it a key ingredient in skincare, haircare, and oral care products. Consumers are increasingly shifting toward natural and organic cosmetics, fueling demand for plant- and animal-based glycerol.
The importance of glycerol has expanded as industries embrace sustainability and bio-based solutions. It is a byproduct of biodiesel production, aligning with the global push for renewable energy. Governments worldwide are supporting green chemistry initiatives, creating opportunities for investment in glycerol derived from renewable sources. Industries focused on sustainability stand to benefit from policies that promote environmentally friendly production methods, fostering long-term returns while contributing to economic and ecological benefits.
| Market Scope | |
|---|---|
| Start Year | 2024 |
| Forecast Year | 2025-2034 |
| Start Value | $5.6 Billion |
| Forecast Value | $11.9 Billion |
| CAGR | 11.9% |
Refined glycerol accounted for over USD 4.6 billion in 2024 and is expected to surpass USD 10.2 billion by 2034. This variant is essential in pharmaceuticals, food processing, and cosmetics. While crude glycerol has industrial applications, its lower economic value stems from the need for extensive purification. Despite this, demand for glycerol-based fuels is increasing as biodiesel production expands, supporting the development of bio-based chemicals, antifreeze, plastics, and solvents.
The biodiesel sector is a major contributor to glycerol production, with its market share reaching approximately 69.8% in 2024. By 2034, glycerol from biodiesel is expected to generate over USD 8.3 billion in revenue. The rising reliance on renewable energy sources and efforts to minimize carbon footprints drive the biodiesel industry's growth. Higher glycerol yields from biodiesel manufacturing reduce costs while ensuring a stable supply for pharmaceuticals, cosmetics, and food applications.
Glycerol derived from fatty acids plays a crucial role in producing lubricants, surfactants, and esters. Its versatility supports various chemical and industrial applications. Additionally, glycerol is a key component in the formulation of emulsifying agents, detergents, and plasticizers. Fatty alcohol-based glycerol is gaining traction due to the growing demand for environmentally friendly alternatives.
One of the earliest industries to utilize glycerol is soap and cleansing product manufacturing. Its humectant and moisturizing properties make it indispensable in personal care formulations. The shift toward sustainable and natural ingredients has further amplified its relevance.
In the United States, the glycerol market exceeded USD 1 billion in 2024 and is anticipated to surpass USD 2.3 billion by 2034. Expanding applications across food, pharmaceuticals, personal care, and biofuels are driving market growth. The increasing adoption of bio-based chemicals and nontraditional glycerol derivatives, such as glycerol esters, is reshaping industrial processes. The preference for natural and organic ingredients in the cosmetics sector further strengthens the market's outlook.
Table of Contents
Chapter 1 Methodology & Scope
- 1.1 Market scope & definition
- 1.2 Base estimates & calculations
- 1.3 Forecast calculation
- 1.4 Data sources
- 1.4.1 Primary
- 1.4.2 Secondary
- 1.4.2.1 Paid sources
- 1.4.2.2 Public sources
Chapter 2 Executive Summary
- 2.1 Industry synopsis, 2021-2034
Chapter 3 Industry Insights
- 3.1 Industry ecosystem analysis
- 3.1.1 Factor affecting the value chain
- 3.1.2 Profit margin analysis
- 3.1.3 Disruptions
- 3.1.4 Future outlook
- 3.1.5 Manufacturers
- 3.1.6 Distributors
- 3.2 Supplier landscape
- 3.3 Profit margin analysis
- 3.4 Key news & initiatives
- 3.5 Regulatory landscape
- 3.6 Impact forces
- 3.7 Industry impact forces
- 3.7.1 Growth drivers
- 3.7.1.1 Increasing demand in personal care and cosmetics
- 3.7.1.2 Rising demand in food and beverage industry
- 3.7.1.3 Expanding applications in industrial processes
- 3.7.2 Market challenges
- 3.7.2.1 Fluctuations in raw material costs
- 3.7.2.2 Potential substitution threats from alternative ingredients
- 3.7.1 Growth drivers
- 3.8 Regulations & market impact
- 3.9 Porter's analysis
- 3.10 PESTEL analysis
Chapter 4 Competitive Landscape, 2024
- 4.1 Introduction
- 4.2 Company market share analysis
- 4.3 Competitive positioning matrix
- 4.4 Strategic outlook matrix
Chapter 5 Market Size and Forecast, By Product Type, 2021-2034 (USD Billion) (Kilo Tons)
- 5.1 Key trends
- 5.2 Crude
- 5.3 Refined
Chapter 6 Market Size and Forecast, By Source, 2021-2034 (USD Billion) (Kilo Tons)
- 6.1 Key trends
- 6.2 Biodiesel
- 6.3 Fatty acids
- 6.4 Fatty alcohols
- 6.5 Soap industry
Chapter 7 Market Size and Forecast, By Application, 2021-2034 (USD Billion) (Kilo Tons)
- 7.1 Key trends
- 7.2 Personal care
- 7.3 Pharmaceuticals
- 7.4 Alkyd resins
- 7.5 Foods & beverages
- 7.6 Polyether polyols
- 7.7 Tobacco humectants
- 7.8 Others
Chapter 8 Market Size and Forecast, By Downstream Application, 2021-2034 (USD Billion) (Kilo Tons)
- 8.1 Key trends
- 8.2 Propylene glycol
- 8.3 Epichlorohydrin
- 8.4 Acrylic acid
- 8.5 1,3-Propanediol
- 8.6 Acrylonitrile
Chapter 9 Market Size and Forecast, By Region, 2021-2034 (USD Billion) (Kilo Tons)
- 9.1 Key trends
- 9.2 North America
- 9.2.1 U.S.
- 9.2.2 Canada
- 9.3 Europe
- 9.3.1 UK
- 9.3.2 Germany
- 9.3.3 France
- 9.3.4 Italy
- 9.3.5 Spain
- 9.3.6 Russia
- 9.4 Asia Pacific
- 9.4.1 China
- 9.4.2 India
- 9.4.3 Japan
- 9.4.4 South Korea
- 9.4.5 Australia
- 9.5 Latin America
- 9.5.1 Brazil
- 9.5.2 Mexico
- 9.6 MEA
- 9.6.1 South Africa
- 9.6.2 Saudi Arabia
- 9.6.3 UAE
Chapter 10 Company Profiles
- 10.1 Aemetis, Inc.
- 10.2 ADM
- 10.3 BASF SE
- 10.4 COCOCHEM
- 10.5 Dow
- 10.6 Emery Oleochemicals
- 10.7 Godrej Industries Limited
- 10.8 Kao Corporation
- 10.9 KLK OLEO
- 10.10 Monarch Chemicals Ltd
- 10.11 Oleon NV
- 10.12 Procter & Gamble
- 10.13 Wilmar International Ltd.

