
PUBLISHER: Global Market Insights Inc. | PRODUCT CODE: 1913411

PUBLISHER: Global Market Insights Inc. | PRODUCT CODE: 1913411
Animal Feed Protein Ingredients Market Opportunity, Growth Drivers, Industry Trend Analysis, and Forecast 2026 - 2035
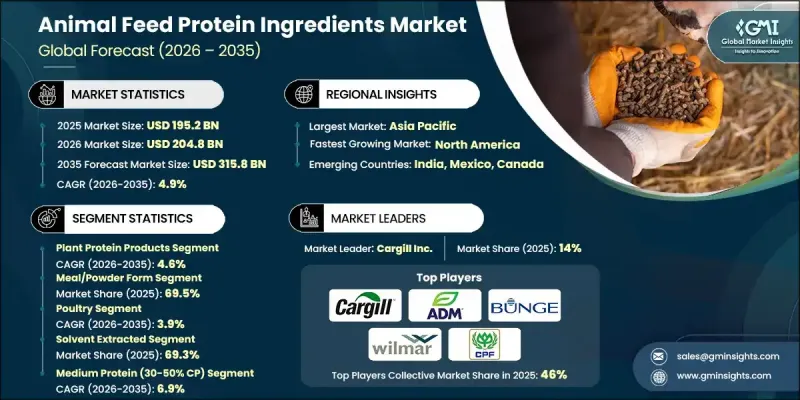
The Global Animal Feed Protein Ingredients Market was valued at USD 195.2 billion in 2025 and is estimated to grow at a CAGR of 4.9% to reach USD 315.8 billion by 2035.
The market is fueled by rising demand for feed efficiency, animal health, and high-quality protein content in meat, dairy, and seafood production. Animal feed protein ingredients, including plant proteins, insect proteins, and functional additives, enhance digestibility and nutrient absorption, supporting both productivity and sustainability. Global environmental regulations and the push for low-carbon production methods are shaping the industry toward more sustainable practices. Regional dynamics vary, with Asia-Pacific driving growth due to expanding livestock and aquaculture sectors, Europe focusing on traceability and sustainability, and North America emphasizing specialty blends for animal performance and health. Companies adopting circular economy principles and integrated production models to optimize resources and reduce waste are positioned for long-term competitive advantage. The market is evolving with increasing interest in innovative, responsibly sourced protein solutions.
| Market Scope | |
|---|---|
| Start Year | 2025 |
| Forecast Year | 2026-2035 |
| Start Value | $195.2 Billion |
| Forecast Value | $315.8 Billion |
| CAGR | 4.9% |
The plant protein products segment held 71.2% share in 2025 and is expected to grow at a CAGR of 4.6% through 2035. Plant-based proteins, sourced from soy, canola, and other crops, remain cost-effective and sustainable options for supplying balanced amino acids to livestock and aquaculture, aligning with global goals for resource efficiency and environmental responsibility.
By physical form, the meal and powder segment held a 69.5% share in 2025 and is forecast to grow at a CAGR of 4.7% during 2026-2035. These forms are preferred for their versatility, ease of blending into compound feeds, uniform nutrient distribution, and compatibility with automated feeding systems. Dry forms such as pellets and extrudates are gaining attention for controlled nutrient release, improved feed efficiency, and reduced wastage in intensive farming and aquaculture applications.
Europe Animal Feed Protein Ingredients Market accounted for USD 33.9 billion in 2025 and is expected to show strong growth throughout the forecast period. Stringent quality standards and responsible sourcing regulations are driving innovation in protein blends that meet environmental and nutritional goals. Germany contributes significantly due to its advanced livestock industry and progressive feed policies.
Key players operating in the Animal Feed Protein Ingredients Market include Cargill Inc., Archer Daniels Midland Company (ADM), Bunge Limited, Wilmar International Limited, Charoen Pokphand Foods PCL, Evonik Industries AG, DSM-Firmenich, Nutreco N.V., TASA (Tecnologica de Alimentos S.A.), Copeinca (Cooke Aquaculture), De Heus Animal Nutrition, Alltech Inc., Protix B.V., InnovaFeed, and Calysta Inc. Companies in the Animal Feed Protein Ingredients Market are adopting strategies to strengthen their presence and competitive positioning. They are investing in R&D to develop innovative protein blends and functional additives that improve animal performance while supporting sustainability. Expansion into emerging markets with growing livestock and aquaculture industries is a priority. Firms are enhancing processing technologies and product quality to meet regulatory standards and consumer demands. Collaborations, mergers, and acquisitions are being used to consolidate supply chains and access new distribution channels.
Table of Contents
Chapter 1 Methodology & Scope
- 1.1 Market scope and definition
- 1.2 Research design
- 1.2.1 Research approach
- 1.2.2 Data collection methods
- 1.3 Data mining sources
- 1.3.1 Global
- 1.3.2 Regional/Country
- 1.4 Base estimates and calculations
- 1.4.1 Base year calculation
- 1.4.2 Key trends for market estimation
- 1.5 Primary research and validation
- 1.5.1 Primary sources
- 1.6 Forecast model
- 1.7 Research assumptions and limitations
Chapter 2 Executive Summary
- 2.1 Industry 360° synopsis
- 2.2 Key market trends
- 2.2.1 Regional
- 2.2.2 Product type
- 2.2.3 Physical form
- 2.2.4 Livestock
- 2.2.5 Production/processing method
- 2.2.6 Protein content
- 2.3 TAM Analysis, 2025-2035
- 2.4 CXO perspectives: Strategic imperatives
- 2.4.1 Executive decision points
- 2.4.2 Critical success factors
- 2.5 Future Outlook and Strategic Recommendations
Chapter 3 Industry Insights
- 3.1 Industry ecosystem analysis
- 3.1.1 Supplier landscape
- 3.1.2 Profit margin
- 3.1.3 Value addition at each stage
- 3.1.4 Factor affecting the value chain
- 3.1.5 Disruptions
- 3.2 Industry impact forces
- 3.2.1 Growth drivers
- 3.2.1.1 Growing global meat & dairy consumption
- 3.2.1.2 Expansion of aquaculture industry
- 3.2.1.3 Rising pet ownership & premium pet food demand
- 3.2.2 Industry pitfalls and challenges
- 3.2.2.1 Volatile raw material prices
- 3.2.2.2 Environmental & sustainability concerns
- 3.2.3 Market opportunities
- 3.2.3.1 Insect protein market emergence
- 3.2.3.2 Microbial & fermentation protein growth
- 3.2.1 Growth drivers
- 3.3 Growth potential analysis
- 3.4 Regulatory landscape
- 3.4.1 North America
- 3.4.2 Europe
- 3.4.3 Asia Pacific
- 3.4.4 Latin America
- 3.4.5 Middle East & Africa
- 3.5 Porter's analysis
- 3.6 PESTEL analysis
- 3.7 Price trends
- 3.7.1 By region
- 3.7.2 By product type
- 3.8 Future market trends
- 3.9 Technology and Innovation landscape
- 3.9.1 Current technological trends
- 3.9.2 Emerging technologies
- 3.10 Patent Landscape
- 3.11 Trade statistics (HS code)
( Note: the trade statistics will be provided for key countries only)
- 3.11.1 Major importing countries
- 3.11.2 Major exporting countries
- 3.12 Sustainability and environmental aspects
- 3.12.1 Sustainable practices
- 3.12.2 Waste reduction strategies
- 3.12.3 Energy efficiency in production
- 3.12.4 Eco-friendly initiatives
- 3.13 Carbon footprint consideration
Chapter 4 Competitive Landscape, 2025
- 4.1 Introduction
- 4.2 Company market share analysis
- 4.2.1 By region
- 4.2.1.1 North America
- 4.2.1.2 Europe
- 4.2.1.3 Asia Pacific
- 4.2.1.4 LATAM
- 4.2.1.5 MEA
- 4.2.1 By region
- 4.3 Company matrix analysis
- 4.4 Competitive analysis of major market players
- 4.5 Competitive positioning matrix
- 4.6 Key developments
- 4.6.1 Mergers & acquisitions
- 4.6.2 Partnerships & collaborations
- 4.6.3 New Product Launches
- 4.6.4 Expansion Plans
Chapter 5 Market Estimates and Forecast, By Product Type, 2022-2035 (USD Billion) (Kilo Tons)
- 5.1 Key trends
- 5.2 Plant protein products
- 5.2.1 Oilseed meals
- 5.2.2 Soy protein concentrate & isolate
- 5.2.3 Pulse proteins (pea, lupin, fava bean)
- 5.2.4 Corn protein (gluten meal, gluten feed)
- 5.2.5 Wheat protein products
- 5.2.6 Potato protein
- 5.2.7 Other plant proteins (alfalfa, rice)
- 5.3 Animal protein products (ABP)
- 5.3.1 Meat & bone meal
- 5.3.2 Meat meal
- 5.3.3 Blood meal
- 5.3.4 Feather meal
- 5.3.5 Poultry meal
- 5.3.6 Dairy proteins (casein, milk protein, lactalbumin)
- 5.4 Marine protein products
- 5.4.1 Fishmeal (white fish, dark fish)
- 5.4.2 Fish protein concentrate
- 5.4.3 Fish solubles
- 5.4.4 Crustacean proteins (shrimp, crab, shellfish)
- 5.4.5 Mollusk proteins (squid, clam)
- 5.5 Microbial & fermentation proteins
- 5.5.1 Dried fermentation biomass
- 5.5.2 Yeast proteins (primary, brewers, torula)
- 5.5.3 Yeast culture
- 5.5.4 Algae proteins
- 5.6 Insect proteins
- 5.6.1 Black soldier fly larvae
- 5.6.2 Cricket meal
- 5.6.3 Mealworm meal
- 5.7 Others
Chapter 6 Market Estimates and Forecast, By Physical Form, 2022-2035 (USD Billion) (Kilo Tons)
- 6.1 Key trends
- 6.2 Meal/Powder Form
- 6.3 Cake Form
- 6.4 Pellet/Extruded Form
- 6.5 Liquid/Condensed Form
- 6.6 Mash Form
Chapter 7 Market Estimates and Forecast, By Livestock, 2022-2035 (USD Billion) (Kilo Tons)
- 7.1 Key trends
- 7.2 Poultry
- 7.2.1 Broiler
- 7.2.2 Layer
- 7.2.3 Turkey
- 7.2.4 Others (duck, geese)
- 7.3 Swine
- 7.3.1 Starter
- 7.3.2 Grower
- 7.3.3 Finisher
- 7.3.4 Sow
- 7.4 Cattle (ruminants)
- 7.4.1 Dairy cattle
- 7.4.2 Beef cattle
- 7.4.3 Calf/veal
- 7.4.4 Others (buffalo, bison)
- 7.5 Aquaculture
- 7.5.1 Salmon
- 7.5.2 Trout
- 7.5.3 Shrimp
- 7.5.4 Carp
- 7.5.5 Tilapia
- 7.5.6 Catfish (channel, yellow)
- 7.5.7 Marine fish (seabass, pomfret, snakehead, herring, eel)
- 7.5.8 Others (turtle, crab, mollusks)
- 7.6 Petfood
- 7.6.1 Dogs
- 7.6.2 Cats
- 7.6.3 Birds
- 7.6.4 Fish (ornamental)
- 7.6.5 Small mammals
- 7.7 Equine
- 7.8 Other livestock (sheep, goats, rabbits)
Chapter 8 Market Estimates and Forecast, By Production/Processing Method, 2022-2035 (USD Billion) (Kilo Tons)
- 8.1 Key trends
- 8.2 Rendered Products
- 8.3 Solvent Extracted
- 8.4 Mechanically Extracted/Expeller Pressed
- 8.5 Fermentation-Derived
- 8.6 Hydrolyzed
- 8.7 Concentrated/Isolated
Chapter 9 Market Estimates and Forecast, By Protein Content, 2022-2035 (USD Billion) (Kilo Tons)
- 9.1 Key trends
- 9.2 High Protein (>50% Crude Protein)
- 9.3 Medium Protein (30-50% CP)
- 9.4 Low-Medium Protein (20-30% CP)
Chapter 10 Market Estimates and Forecast, By Region, 2022-2035 (USD Billion) (Kilo Tons)
- 10.1 Key trends
- 10.2 North America
- 10.2.1 U.S.
- 10.2.2 Canada
- 10.3 Europe
- 10.3.1 Germany
- 10.3.2 UK
- 10.3.3 France
- 10.3.4 Spain
- 10.3.5 Italy
- 10.3.6 Rest of Europe
- 10.4 Asia Pacific
- 10.4.1 China
- 10.4.2 India
- 10.4.3 Japan
- 10.4.4 Australia
- 10.4.5 South Korea
- 10.4.6 Rest of Asia Pacific
- 10.5 Latin America
- 10.5.1 Brazil
- 10.5.2 Mexico
- 10.5.3 Argentina
- 10.5.4 Rest of Latin America
- 10.6 Middle East and Africa
- 10.6.1 Saudi Arabia
- 10.6.2 South Africa
- 10.6.3 UAE
- 10.6.4 Rest of Middle East and Africa
Chapter 11 Company Profiles
- 11.1 Cargill Inc.
- 11.2 Archer Daniels Midland Company (ADM)
- 11.3 Bunge Limited
- 11.4 Wilmar International Limited
- 11.5 Charoen Pokphand Foods PCL
- 11.6 Evonik Industries AG
- 11.7 DSM-Firmenich
- 11.8 Nutreco N.V.
- 11.9 TASA (Tecnologica de Alimentos S.A.)
- 11.10 Copeinca (Cooke Aquaculture)
- 11.11 De Heus Animal Nutrition
- 11.12 Alltech Inc.
- 11.13 Protix B.V.
- 11.14 InnovaFeed
- 11.15 Calysta Inc.

