
PUBLISHER: Global Market Insights Inc. | PRODUCT CODE: 1822617

PUBLISHER: Global Market Insights Inc. | PRODUCT CODE: 1822617
Biofertilizers Market Opportunity, Growth Drivers, Industry Trend Analysis, and Forecast 2025 - 2034
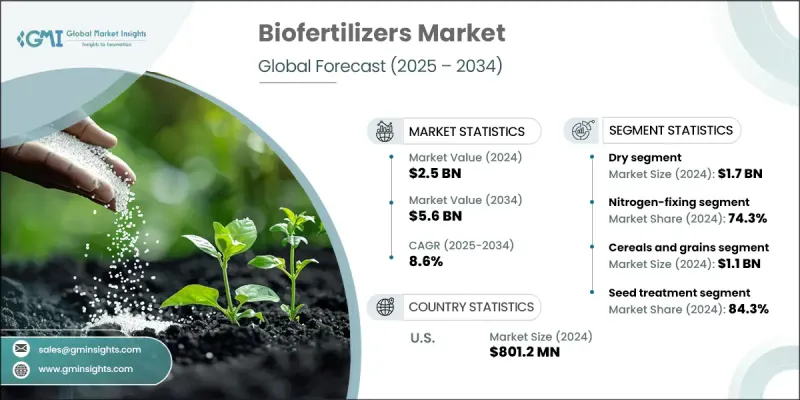
The Global Biofertilizers Market was valued at USD 2.5 billion in 2024 and is estimated to grow at a CAGR of 8.6% to reach USD 5.6 billion by 2034 owing to a wider awareness of sustainable agricultural practices. Biofertilizers offer benefits such as reduced soil degradation and minimized chemical runoff. The shift among farmers toward organic and eco-friendly farming is motivated by consumer preference for organic produce and stricter regulatory frameworks promoting sustainable agriculture. According to a report by the Organic Trade Association, organic food sales in the United States reached $63 billion in 2023. Advancements in biotechnology and microbial research also contribute to the market revenues. Innovations in microbial strains and formulation techniques have enhanced the efficacy and application of biofertilizers, making them more appealing across various agricultural applications.
For instance, a study published in the Journal of Applied Microbiology in 2023 highlighted that new microbial formulations improved crop yields by 15%. This technological progress is leading to the development of new and improved biofertilizer products that offer better nutrient efficiency and compatibility with various crops. The search for a viable solution for enhancing soil fertility and crop productivity is pushing the industry growth. The overall biofertilizers industry is classified based on product, crop, form, application, and region. The potash-mobilizing segment is gaining traction due to its ability to enhance soil fertility and optimize nutrient use efficiency. These biofertilizers are designed to unlock potassium in the soil, making it more available to plants, which is crucial for promoting robust plant growth and improving crop yields. By leveraging specialized microorganisms, such as potassium-solubilizing bacteria and fungi, these biofertilizers effectively convert potassium from insoluble forms into accessible nutrients. As agricultural practices shift towards sustainable and efficient nutrient management solutions, the potash-mobilizing segment is expected to see increased adoption.
| Market Scope | |
|---|---|
| Start Year | 2024 |
| Forecast Year | 2025-2034 |
| Start Value | $2.5 Billion |
| Forecast Value | $5.6 Billion |
| CAGR | 8.6% |
The soil treatment application segment will hold a notable market share by 2032, as farmers seek more effective ways to enhance soil health and fertility. By enriching the soil with beneficial microorganisms, such as bacteria and fungi, soil treatment biofertilizers help in the degradation of organic matter, suppression of soil-borne diseases, and enhancement of soil aeration and water retention. The increasing emphasis on sustainable agriculture and soil conservation practices is driving the demand for these biofertilizers, as they offer a natural and eco-friendly alternative to chemical soil amendments, leading to improved crop productivity and long-term soil health. Asia Pacific biofertilizers market is experiencing rapid growth, driven by the thriving agriculture sector and wider adoption of sustainable farming practices. The increasing product adoption is fueled by the need to address soil degradation, reduce dependency on chemical fertilizers, and enhance food security amidst rising population pressures. Government initiatives and subsidies promoting organic farming, coupled with advancements in biofertilizer technologies, are further accelerating the market growth in Asia Pacific.
Table of Contents
Chapter 1 Methodology
- 1.1 Market scope and definition
- 1.2 Research design
- 1.2.1 Research approach
- 1.2.2 Data collection methods
- 1.3 Data mining sources
- 1.3.1 Global
- 1.3.2 Regional/Country
- 1.4 Base estimates and calculations
- 1.4.1 Base year calculation
- 1.4.2 Key trends for market estimation
- 1.5 Primary research and validation
- 1.5.1 Primary sources
- 1.6 Forecast model
- 1.7 Research assumptions and limitations
Chapter 2 Executive Summary
- 2.1 Industry 3600 synopsis
- 2.2 Key market trends
- 2.2.1 Regional
- 2.2.2 Form
- 2.2.3 Product
- 2.2.4 Crop
- 2.2.5 Application
- 2.3 TAM Analysis, 2025-2034
- 2.4 CXO perspectives: Strategic imperatives
- 2.4.1 Executive decision points
- 2.4.2 Critical success factors
- 2.5 Future Outlook and strategic recommendations
Chapter 3 Industry Insights
- 3.1 Industry ecosystem analysis
- 3.1.1 Supplier Landscape
- 3.1.2 Profit Margin
- 3.1.3 Value addition at each stage
- 3.1.4 Factor affecting the value chain
- 3.1.5 Disruptions
- 3.2 Industry impact forces
- 3.2.1 Growth drivers
- 3.2.2 Industry pitfalls and challenges
- 3.2.3 Market opportunities
- 3.3 Growth potential analysis
- 3.4 Regulatory landscape
- 3.4.1 North America
- 3.4.2 Europe
- 3.4.3 Asia Pacific
- 3.4.4 Latin America
- 3.4.5 Middle East & Africa
- 3.5 Porter's analysis
- 3.6 PESTEL analysis
- 3.7 Price trends
- 3.7.1 By region
- 3.7.2 By product
- 3.8 Future market trends
- 3.9 Technology and innovation landscape
- 3.9.1 Current technological trends
- 3.9.2 Emerging technologies
- 3.10 Patent landscape
- 3.11 Trade statistics (HS code) (Note: the trade statistics will be provided for key countries only)
- 3.11.1 Major importing countries
- 3.11.2 Major exporting countries
- 3.12 Sustainability and environmental aspects
- 3.12.1 Sustainable practices
- 3.12.2 Waste reduction strategies
- 3.12.3 Energy efficiency in production
- 3.12.4 Eco-friendly initiatives
Chapter 4 Competitive Landscape, 2024
- 4.1 Introduction
- 4.2 Company market share analysis
- 4.2.1 By region
- 4.2.1.1 North America
- 4.2.1.2 Europe
- 4.2.1.3 Asia Pacific
- 4.2.1.4 LATAM
- 4.2.1.5 MEA
- 4.2.1 By region
- 4.3 Company matrix analysis
- 4.4 Competitive analysis of major market players
- 4.5 Competitive positioning matrix
- 4.6 Key developments
- 4.6.1 Mergers & acquisitions
- 4.6.2 Partnerships & collaborations
- 4.6.3 New product launches
- 4.6.4 Expansion plans
Chapter 5 Market Estimates & Forecast, By Form, 2021-2034 (USD Billion) (Kilo Tons)
- 5.1 Key trend
- 5.2 Dry
- 5.3 Liquid
Chapter 6 Market Estimates & Forecast, By Product, 2021-2034 (USD Billion) (Kilo Tons)
- 6.1 Key trend
- 6.2 Nitrogen-fixing
- 6.3 Phosphate-solubilizing
- 6.4 Potash-mobilizing
- 6.5 Others
Chapter 7 Market Estimates & Forecast, By Crop, 2021-2034 (USD Billion) (Kilo Tons)
- 7.1 Key trends
- 7.2 Cereals & grains
- 7.3 Pulses & oil seeds
- 7.4 Fruits & vegetables
- 7.5 Others
Chapter 8 Market Estimates & Forecast, By Application, 2021-2034 (USD Billion) (Kilo Tons)
- 8.1 Key trend
- 8.2 Seed treatment
- 8.3 Soil treatment
- 8.4 Others
Chapter 9 Market Estimates & Forecast, By Region, 2021-2034 (USD Billion) (Kilo Tons)
- 9.1 Key trends
- 9.2 North America
- 9.2.1 U.S.
- 9.2.2 Canada
- 9.3 Europe
- 9.3.1 Germany
- 9.3.2 UK
- 9.3.3 France
- 9.3.4 Italy
- 9.3.5 Spain
- 9.3.6 Rest of Europe
- 9.4 Asia Pacific
- 9.4.1 China
- 9.4.2 India
- 9.4.3 Japan
- 9.4.4 Australia
- 9.4.5 South Korea
- 9.4.6 Rest of Asia Pacific
- 9.5 Latin America
- 9.5.1 Brazil
- 9.5.2 Mexico
- 9.5.3 Argentina
- 9.5.4 Rest of Latin America
- 9.6 Middle East & Africa
- 9.6.1 Saudi Arabia
- 9.6.2 South Africa
- 9.6.3 UAE
- 9.6.4 Rest of Middle East & Africa
Chapter 10 Company Profiles
- 10.1 Agri Life
- 10.2 Ajay Bio-Tech
- 10.3 Cairochem
- 10.4 Chema Industries
- 10.5 CBF China Bio-Fertilizer AG
- 10.6 Gujarat State Fertilizers & Chemicals
- 10.7 Jay Enterprises
- 10.8 Koppert
- 10.9 Lallemand
- 10.10 Madras Fertilizers
- 10.11 Peptech Biosciences
- 10.12 Symborg
- 10.13 Rizobacter Argentina SA

