
PUBLISHER: Global Market Insights Inc. | PRODUCT CODE: 1666699

PUBLISHER: Global Market Insights Inc. | PRODUCT CODE: 1666699
Wind Turbine Market Opportunity, Growth Drivers, Industry Trend Analysis, and Forecast 2025 - 2034
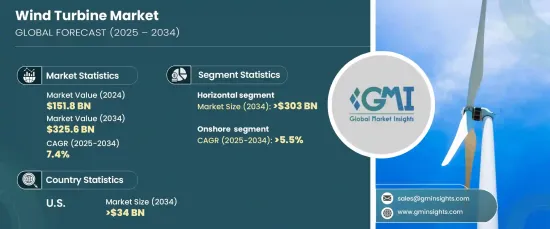
The Global Wind Turbine Market was valued at USD 151.8 billion in 2024 and is projected to grow at a CAGR of 7.4% from 2025 to 2034. Wind turbines are essential devices that convert the kinetic energy of wind into mechanical energy, which is then used to generate electricity. This renewable energy source is crucial in reducing reliance on fossil fuels and addressing the challenges of climate change.
The increasing integration of wind energy with storage solutions and the rising focus on sustainability by corporations are key drivers of market growth. Wind energy is becoming a cornerstone of global decarbonization strategies as countries implement ambitious renewable energy targets. Developers are prioritizing environmentally sustainable wind projects, adopting certifications and best practices to promote eco-friendly construction and operations, further boosting the adoption of wind turbines.
| Market Scope | |
|---|---|
| Start Year | 2024 |
| Forecast Year | 2025-2034 |
| Start Value | $151.8 Billion |
| Forecast Value | $325.6 Billion |
| CAGR | 7.4% |
By axis type, horizontal axis wind turbines (HAWTs) are expected to dominate, with USD 303 billion by 2034. Their efficiency, scalability, and adaptability across various applications contribute to this growth. Advancements in blade materials, aerodynamics, and structural designs have significantly enhanced their performance, making them the preferred choice, especially for offshore wind farms that capture stronger, more consistent winds.
Onshore installations are set to grow at a CAGR of 5.5% through 2034. This growth is supported by technological innovations, economic feasibility, and increasing government initiatives promoting renewable energy adoption. Manufacturers focus on developing larger turbines with higher capacity factors, enabling more power generation with fewer units and lowering installation costs per megawatt. Repowering existing wind farms with modern, efficient turbines is also extending their productive lifespan and boosting energy output.
U.S. wind turbine market is anticipated to generate USD 34 billion by 2034, driven by technological advancements, improved logistics, and innovative business strategies. The integration of wind energy with storage systems and the growing demand for renewable solutions to combat climate change fuel the market's expansion. Supportive policies, including tax incentives, feed-in tariffs, renewable energy targets, and declining wind energy costs, stimulate growth.
Overall, the wind turbine market is poised for robust growth, with technological advancement, supportive regulatory frameworks, and increasing global emphasis on sustainability driving its expansion. The sector is set to play a pivotal role in the transition to cleaner and more sustainable energy systems worldwide.
Table of Contents
Chapter 1 Methodology & Scope
- 1.1 Research design
- 1.2 Base estimates & calculations
- 1.3 Forecast model
- 1.4 Primary research & validation
- 1.4.1 Primary sources
- 1.4.2 Data mining sources
- 1.5 Market definitions
Chapter 2 Executive Summary
- 2.1 Industry synopsis, 2021 – 2034
Chapter 3 Industry Insights
- 3.1 Industry ecosystem
- 3.2 Regulatory landscape
- 3.3 Industry impact forces
- 3.3.1 Growth drivers
- 3.3.2 Industry pitfalls & challenges
- 3.4 Growth potential analysis
- 3.5 Porter's analysis
- 3.5.1 Bargaining power of suppliers
- 3.5.2 Bargaining power of buyers
- 3.5.3 Threat of new entrants
- 3.5.4 Threat of substitutes
- 3.6 PESTEL analysis
Chapter 4 Competitive landscape, 2024
- 4.1 Introduction
- 4.2 Strategic dashboard
- 4.3 Innovation & technology landscape
Chapter 5 Market Size and Forecast, By Axis, 2021 – 2034 (USD Million & MW)
- 5.1 Key trends
- 5.2 Horizontal (HAWTs)
- 5.2.1 Up-wind
- 5.2.2 Down-wind
- 5.3 Vertical (VAWTs)
Chapter 6 Market Size and Forecast, By Installation, 2021 – 2034 (USD Million & MW)
- 6.1 Key trends
- 6.2 Onshore
- 6.3 Offshore
Chapter 7 Market Size and Forecast, By Connectivity, 2021 – 2034 (USD Million & MW)
- 7.1 Key trends
- 7.2 Grid connected
- 7.3 Stand alone
Chapter 8 Market Size and Forecast, By Rating, 2021 – 2034 (USD Million & MW)
- 8.1 Key trends
- 8.2 < 100 kW
- 8.3 100 kW to 250 kW
- 8.4 > 250 kW to 500 kW
- 8.5 > 500 kW to 1 MW
- 8.6 1 MW to 2 MW
- 8.7 > 2 MW
Chapter 9 Market Size and Forecast, By Application, 2021 – 2034 (USD Million & MW)
- 9.1 Key trends
- 9.2 Residential
- 9.3 Commercial & industrial
- 9.4 Utility
Chapter 10 Market Size and Forecast, By Region, 2021 – 2034 (USD Million & MW)
- 10.1 Key trends
- 10.2 North America
- 10.2.1 U.S.
- 10.2.2 Canada
- 10.2.3 Mexico
- 10.3 Europe
- 10.3.1 Germany
- 10.3.2 Spain
- 10.3.3 UK
- 10.3.4 France
- 10.3.5 Italy
- 10.3.6 Sweden
- 10.4 Asia Pacific
- 10.4.1 China
- 10.4.2 Japan
- 10.4.3 South Korea
- 10.4.4 India
- 10.4.5 Australia
- 10.5 Middle East & Africa
- 10.5.1 South Africa
- 10.5.2 Egypt
- 10.6 Latin America
- 10.6.1 Brazil
- 10.6.2 Chile
- 10.6.3 Argentina
Chapter 11 Company Profiles
- 11.1 Envision group
- 11.2 Enercon
- 11.3 General Electric
- 11.4 Goldwind
- 11.5 Mingyang Smart Energy Group Co., Ltd.
- 11.6 Nordex
- 11.7 Siemens Gamesa Renewable Energy
- 11.8 Suzlon Energy
- 11.9 Senvion
- 11.10 Vestas
- 11.11 Zhejiang Windey Co., Ltd.

