
PUBLISHER: Global Market Insights Inc. | PRODUCT CODE: 1755345

PUBLISHER: Global Market Insights Inc. | PRODUCT CODE: 1755345
Hydrogen Generation Market Opportunity, Growth Drivers, Industry Trend Analysis, and Forecast 2025 - 2034
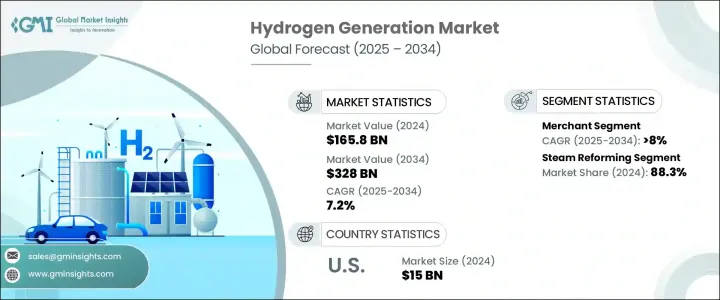
The Global Hydrogen Generation Market was valued at USD 165.8 billion in 2024 and is estimated to grow at a CAGR of 7.2% to reach USD 328 billion by 2034, driven by the increasing demand for low-carbon industrial fuels and a shift from traditional fossil-based feedstocks to cleaner alternatives. Additionally, the ongoing focus on decarbonizing sectors like ammonia production, refining, and synthetic fuel manufacturing will significantly boost the adoption of low-carbon hydrogen. The growing popularity of hydrogen fuel cell vehicles (FCVs), including buses, trucks, and ships, alongside the expansion of hydrogen refueling stations, will further stimulate market growth.
The rising application of hydrogen in industries such as steel production, chemical manufacturing, and refining, aimed at reducing carbon emissions, will also play a crucial role in driving the market. Financial incentives, grants, and subsidies for developing hydrogen infrastructure and technologies enhance the market outlook. However, tariffs imposed on imported hydrogen production equipment and components may affect growth, raising capital expenditures for developers and potentially delaying project timelines. The hydrogen generation market is divided into segments such as steam reforming, electrolysis, and others, with steam reforming holding the largest share due to its cost-effectiveness and established infrastructure.
| Market Scope | |
|---|---|
| Start Year | 2024 |
| Forecast Year | 2025-2034 |
| Start Value | $165.8 Billion |
| Forecast Value | $328 Billion |
| CAGR | 7.2% |
The steam reforming segment in the hydrogen generation market held 88.3% share in 2024. This is largely due to its cost-effective production capabilities and the well-established infrastructure that supports its widespread use. Steam reforming has long been the preferred method for hydrogen production, especially within industries like refining and petrochemicals, where it plays a crucial role in generating the hydrogen needed for various processes.
The captive segment is expected to reach USD 268 billion by 2034 and will benefit from increasing investments in on-site hydrogen generation for industrial and commercial use. This shift is aimed at mitigating supply chain risks and improving energy security. The growing use of green hydrogen technologies for in-house consumption, particularly in the refining and chemical industries, will further stimulate market expansion. Additionally, policy incentives encouraging the integration of clean energy will support the ongoing adoption of hydrogen across various sectors.
United States Hydrogen Generation Market was valued at USD 15 billion in 2024, driven by the increasing role of hydrogen in both power generation and the transportation sector. The demand for hydrogen-based solutions is driven by the desire to improve grid flexibility, reduce dependence on fossil fuels, and support the transition to clean energy. Hydrogen is increasingly a key player in decarbonizing heavy industries and transportation, including freight and buses. Public and private sector initiatives to decarbonize the economy are further propelling the adoption of hydrogen technologies, which is expected to lead to significant market growth in the years ahead.
Key players in the Global Hydrogen Generation Market include Linde, Air Products and Chemicals, Air Liquide, McPhy Energy, and Plug Power, among others. These companies are employing various strategies to strengthen their market position, including investments in research and development to enhance the efficiency and sustainability of hydrogen production technologies. Many companies are expanding their product offerings by integrating renewable hydrogen solutions and forming strategic partnerships with other industry players to build hydrogen infrastructure.
Table of Contents
Chapter 1 Methodology & Scope
- 1.1 Research design
- 1.2 Base estimates & calculations
- 1.3 Forecast calculation
- 1.4 Primary research & validation
- 1.4.1 Primary sources
- 1.4.2 Data mining sources
- 1.5 Market definitions
Chapter 2 Executive Summary
- 2.1 Industry synopsis, 2021 – 2034
Chapter 3 Industry Insights
- 3.1 Industry ecosystem
- 3.2 Trump administration tariff analysis
- 3.2.1 Impact on trade
- 3.2.1.1 Trade volume disruptions
- 3.2.1.2 Retaliatory measures
- 3.2.2 Impact on the industry
- 3.2.2.1 Supply-side impact (raw materials)
- 3.2.2.1.1 Price volatility in key materials
- 3.2.2.1.2 Supply chain restructuring
- 3.2.2.1.3 Production cost implications
- 3.2.2.2 Demand-side impact (selling price)
- 3.2.2.2.1 Price transmission to end markets
- 3.2.2.2.2 Market share dynamics
- 3.2.2.2.3 Consumer response patterns
- 3.2.2.1 Supply-side impact (raw materials)
- 3.2.3 Key companies impacted
- 3.2.4 Strategic industry responses
- 3.2.4.1 Supply chain reconfiguration
- 3.2.4.2 Pricing and product strategies
- 3.2.4.3 Policy engagement
- 3.2.5 Outlook and future considerations
- 3.2.1 Impact on trade
- 3.3 Regulatory landscape
- 3.4 Industry impact forces
- 3.4.1 Growth drivers
- 3.4.2 Industry pitfalls & challenges
- 3.5 Growth potential analysis
- 3.6 Porter's analysis
- 3.6.1 Bargaining power of suppliers
- 3.6.2 Bargaining power of buyers
- 3.6.3 Threat of new entrants
- 3.6.4 Threat of substitutes
- 3.7 PESTEL analysis
Chapter 4 Competitive landscape, 2024
- 4.1 Introduction
- 4.2 Company market share
- 4.3 Strategic initiative
- 4.4 Competitive benchmarking
- 4.5 Strategic dashboard
- 4.6 Innovation & sustainability landscape
Chapter 5 Market Size and Forecast, By Delivery Mode, 2021 - 2034 (USD Billion)
- 5.1 Key trends
- 5.2 Captive
- 5.3 Merchant
Chapter 6 Market Size and Forecast, By Application, 2021 - 2034 (USD Billion)
- 6.1 Key trends
- 6.2 Petroleum refinery
- 6.3 Chemical
- 6.4 Metal
- 6.5 Others
Chapter 7 Market Size and Forecast, By Process, 2021 - 2034 (USD Billion)
- 7.1 Key trends
- 7.2 Steam reformer
- 7.3 Electrolysis
- 7.4 Others
Chapter 8 Market Size and Forecast, By Region, 2021 - 2034 (USD Billion)
- 8.1 Key trends
- 8.2 North America
- 8.2.1 U.S.
- 8.2.2 Canada
- 8.2.3 Mexico
- 8.3 Europe
- 8.3.1 Germany
- 8.3.2 France
- 8.3.3 UK
- 8.3.4 Italy
- 8.3.5 Netherlands
- 8.3.6 Russia
- 8.4 Asia Pacific
- 8.4.1 China
- 8.4.2 India
- 8.4.3 Japan
- 8.5 Middle East & Africa
- 8.5.1 Saudi Arabia
- 8.5.2 Iran
- 8.5.3 UAE
- 8.5.4 South Africa
- 8.6 Latin America
- 8.6.1 Brazil
- 8.6.2 Argentina
- 8.6.3 Chile
Chapter 9 Company Profiles
- 9.1 Air Liquide
- 9.2 Air Products and Chemicals
- 9.3 Ballard Power Systems
- 9.4 Ally Hi-Tech
- 9.5 Claind
- 9.6 Engie
- 9.7 Caloric
- 9.8 HyGear
- 9.9 Iwatani Corporation
- 9.10 Linde
- 9.11 Mahler
- 9.12 Messer
- 9.13 McPhy Energy
- 9.14 Nel ASA
- 9.15 Nuvera Fuel Cells
- 9.16 Plug Power
- 9.17 Resonac Holdings Corporation
- 9.18 Taiyo Nippon Sanso Corporation
- 9.19 Teledyne Technologies Incorporated
- 9.20 Xebec Adsorption

