
PUBLISHER: Global Market Insights Inc. | PRODUCT CODE: 1666582

PUBLISHER: Global Market Insights Inc. | PRODUCT CODE: 1666582
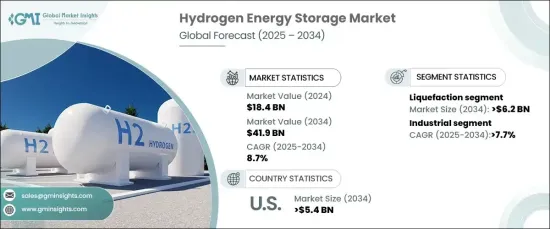
Hydrogen Energy Storage Market Opportunity, Growth Drivers, Industry Trend Analysis, and Forecast 2025 - 2034
The Global Hydrogen Energy Storage Market, valued at USD 18.4 billion in 2024, is poised for substantial growth, with an anticipated CAGR of 8.7% from 2025 to 2034. This growth is largely fueled by the rising adoption of renewable energy sources such as solar and wind, which are inherently variable and can create challenges in maintaining grid stability. Hydrogen energy storage offers an effective solution by capturing excess renewable energy and converting it into electricity during periods of low generation, ensuring a reliable energy supply.
Advancements in hydrogen storage technologies are transforming the market landscape. Compressed and cryogenic liquid hydrogen storage methods are becoming increasingly popular due to their efficiency and scalability. In addition, material-based storage options, including metal hydrides and liquid organic hydrogen carriers, provide safer and more space-efficient solutions for various applications. Emerging technologies such as solid-state and ammonia-based hydrogen storage systems are also under active development, further diversifying the industry. These innovations address critical challenges related to storage density, transportation, and efficiency, strengthening hydrogen's role as a viable energy carrier.
| Market Scope | |
|---|---|
| Start Year | 2024 |
| Forecast Year | 2025-2034 |
| Start Value | $18.4 Billion |
| Forecast Value | $41.9 Billion |
| CAGR | 8.7% |
In terms of storage methods, the liquefaction segment is expected to witness significant growth, reaching USD 6.2 billion by 2034. Its appeal lies in its ability to store hydrogen in a compact form with high energy density, making it suitable for large-scale applications. This method supports the increasing demand for clean energy carriers as global decarbonization efforts intensify. Expanding investments in hydrogen infrastructure further drive the adoption of liquefaction technologies.
On the application front, the industrial sector is projected to grow at a CAGR of over 7.7% during the forecast period. Industries are increasingly focusing on integrating hydrogen storage systems to enhance energy efficiency and reduce emissions. Hydrogen serves as a critical component in various industrial processes, aligning with global climate goals and supporting the transition toward sustainable energy solutions.
The U.S. hydrogen energy storage market is forecast to exceed USD 5.4 billion by 2034, driven by strategic investments in renewable energy and decarbonization initiatives. The nation's commitment to achieving net-zero emissions by 2050 has accelerated the development of hydrogen production and storage systems. The emphasis on green hydrogen, derived from renewable energy sources, highlights its pivotal role in the country's energy transition strategy.
Table of Contents
Chapter 1 Methodology & Scope
- 1.1 Market definitions
- 1.2 Base estimates & calculations
- 1.3 Forecast calculation
- 1.4 Data sources
- 1.4.1 Primary
- 1.4.2 Secondary
- 1.4.2.1 Paid
- 1.4.2.2 Public
Chapter 2 Executive Summary
- 2.1 Industry synopsis, 2021 – 2034
Chapter 3 Industry Insights
- 3.1 Industry ecosystem analysis
- 3.2 Regulatory landscape
- 3.3 Industry impact forces
- 3.3.1 Growth drivers
- 3.3.2 Industry pitfalls & challenges
- 3.4 Growth potential analysis
- 3.5 Porter's analysis
- 3.5.1 Bargaining power of suppliers
- 3.5.2 Bargaining power of buyers
- 3.5.3 Threat of new entrants
- 3.5.4 Threat of substitutes
- 3.6 PESTEL analysis
Chapter 4 Competitive landscape, 2024
- 4.1 Strategic dashboard
- 4.2 Innovation & sustainability landscape
Chapter 5 Market Size and Forecast, By Method, 2021 – 2034 (USD Million)
- 5.1 Key trends
- 5.2 Compression
- 5.3 Liquefaction
- 5.4 Material-based
Chapter 6 Market Size and Forecast, By Application, 2021 – 2034 (USD Million)
- 6.1 Key trends
- 6.2 Industrial
- 6.3 Transportation
- 6.4 Stationary
- 6.5 Others
Chapter 7 Market Size and Forecast, By Region, 2021 – 2034 (USD Million)
- 7.1 Key trends
- 7.2 North America
- 7.2.1 U.S.
- 7.2.2 Canada
- 7.2.3 Mexico
- 7.3 Europe
- 7.3.1 Germany
- 7.3.2 UK
- 7.3.3 France
- 7.3.4 Italy
- 7.3.5 Netherlands
- 7.3.6 Russia
- 7.4 Asia Pacific
- 7.4.1 China
- 7.4.2 India
- 7.4.3 Japan
- 7.5 Rest of World
Chapter 8 Company Profiles
- 8.1 Air Liquide
- 8.2 Air Products
- 8.3 Cockerill Jingli Hydrogen
- 8.4 Engie
- 8.5 FuelCell Energy
- 8.6 GKN Hydrogen
- 8.7 Gravitricity
- 8.8 Hydrogen in Motion
- 8.9 ITM Power
- 8.10 Linde
- 8.11 McPhy Energy
- 8.12 Nel
- 8.13 SSE

