
PUBLISHER: Global Market Insights Inc. | PRODUCT CODE: 1716650

PUBLISHER: Global Market Insights Inc. | PRODUCT CODE: 1716650
Wipes Market Opportunity, Growth Drivers, Industry Trend Analysis, and Forecast 2025 - 2034
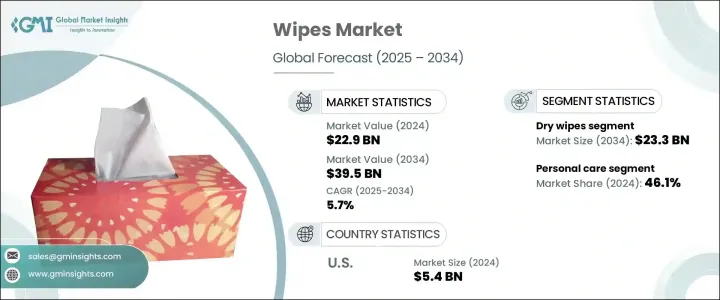
The Global Wipes Market was valued at USD 22.9 billion in 2024 and is projected to grow at a CAGR of 5.7% between 2025 and 2034. The demand for hygiene and sanitation products has skyrocketed in recent years, primarily fueled by increased health awareness and evolving consumer lifestyles. The COVID-19 pandemic significantly accelerated this trend, triggering widespread adoption of disinfectant wipes for personal and surface hygiene. As people continue prioritizing cleanliness, wipes have become an essential part of daily routines, used in homes, workplaces, healthcare facilities, and public spaces. Consumers now expect multi-functional, high-quality wipes that cater to both convenience and effectiveness.
The market is experiencing notable growth due to a surge in demand for sustainable and skin-friendly formulations. Brands are responding with eco-conscious innovations, such as biodegradable materials and chemical-free options, appealing to the rising number of environmentally aware buyers. Additionally, advancements in manufacturing technologies have improved the durability and efficiency of wipes, making them indispensable across multiple industries. The expanding e-commerce landscape is also playing a crucial role in market expansion, with online platforms making wipes more accessible to a global audience.
| Market Scope | |
|---|---|
| Start Year | 2024 |
| Forecast Year | 2025-2034 |
| Start Value | $22.9 Billion |
| Forecast Value | $39.5 Billion |
| CAGR | 5.7% |
The wipes industry is categorized into wet wipes and dry wipes. In 2024, the dry wipes segment accounted for USD 13.6 billion in revenue. The increasing preference for dry wipes stems from their versatility and practicality, eliminating the need for multiple cleaning products. They are widely utilized in medical environments for patient care, surface sanitation, and equipment cleaning. Households are also embracing dry wipes as an all-in-one solution for quick and effective cleaning. As the demand for non-toxic and fragrance-free options rises, manufacturers are introducing hypoallergenic and dermatologically tested variants to cater to sensitive users.
By application, the wipes market is segmented into personal care, household and home cleaning, and industrial wipes. Personal care wipes dominated the market in 2024, holding a 46.1% share. The segment continues to thrive as urban consumers with busy lifestyles seek convenient hygiene solutions. Facial wipes, baby wipes, and body wipes are particularly popular, with brands incorporating organic and natural ingredients to align with growing consumer preference for skin-friendly and non-irritating products. Enhanced product formulations with added vitamins and moisturizing agents further drive adoption, reinforcing wipes as an integral part of daily skincare routines.
The U.S. wipes market was valued at USD 5.4 billion in 2024 and is anticipated to grow at a CAGR of 6% through 2034. Major players in the U.S. are leveraging product innovation and sustainable business strategies to maintain a competitive edge. Eco-friendly solutions, such as biodegradable packaging and plant-based fibers, are gaining traction, appealing to environmentally conscious buyers. With increasing awareness of chemical exposure, brands are focusing on organic and hypoallergenic ingredients, ensuring safety and effectiveness. The shift toward premium, dermatologically tested wipes is shaping the market landscape, reinforcing the importance of innovation in driving long-term growth.
Table of Contents
Chapter 1 Methodology & Scope
- 1.1 Market scope & definitions
- 1.2 Base estimates & calculations
- 1.3 Forecast calculations
- 1.4 Data sources
- 1.4.1 Primary
- 1.4.2 Secondary
- 1.4.2.1 Paid sources
- 1.4.2.2 Public sources
Chapter 2 Executive Summary
- 2.1 Industry 3600 synopsis, 2021-2034
Chapter 3 Industry Insights
- 3.1 Industry ecosystem analysis
- 3.1.1 Factor affecting the value chain
- 3.1.2 Profit margin analysis
- 3.1.3 Disruptions
- 3.1.4 Future outlook
- 3.1.5 Manufacturers
- 3.1.6 Distributors
- 3.2 Supplier landscape
- 3.3 Profit margin analysis
- 3.4 Raw material analysis
- 3.5 Key news & initiatives
- 3.6 Regulatory landscape
- 3.7 Impact forces
- 3.7.1 Growth drivers
- 3.7.1.1 Rapid urbanization and lifestyle changes
- 3.7.1.2 Growing hospitality sector
- 3.7.1.3 Increasing consumer awareness on hygiene
- 3.7.1.4 Increasing disposable income
- 3.7.2 Industry pitfalls & challenges
- 3.7.2.1 Market saturation and intense competition
- 3.7.2.2 Fluctuating raw material prices
- 3.7.1 Growth drivers
- 3.8 Growth potential analysis
- 3.9 Porter's analysis
- 3.10 PESTEL analysis
Chapter 4 Competitive Landscape, 2024
- 4.1 Introduction
- 4.2 Company market share analysis
- 4.3 Competitive positioning matrix
- 4.4 Strategic outlook matrix
Chapter 5 Market Estimates & Forecast, By Type, 2021 - 2034 (USD Billion) (Million Units)
- 5.1 Key trends
- 5.2 Wet wipes
- 5.3 Dry wipes
Chapter 6 Market Estimates & Forecast, By Application, 2021 - 2034 (USD Billion) (Million Units)
- 6.1 Key trends
- 6.2 Personal care
- 6.2.1 Baby wipes
- 6.2.2 Cleansing wipes
- 6.2.3 Personal hygiene
- 6.2.4 Pet care wipes
- 6.3 Household and home cleaning
- 6.3.1 Kitchen wipes
- 6.3.2 Bathroom wipes
- 6.3.3 Food service wipes
- 6.4 Industrial wipes
Chapter 7 Market Estimates & Forecast, By Material, 2021 - 2034 (USD Billion) (Million Units)
- 7.1 Key trends
- 7.2 Cotton
- 7.3 Polyester
- 7.4 Viscose
- 7.5 Others
Chapter 8 Market Estimates & Forecast, By Usability, 2021 - 2034 (USD Billion) (Million Units)
- 8.1 Key trends
- 8.2 Disposable
- 8.3 Reusable
Chapter 9 Market Estimates & Forecast, By Price Range, 2021 - 2034 (USD Billion) (Million Units)
- 9.1 Key trends
- 9.2 Low
- 9.3 Mid
- 9.4 High
Chapter 10 Market Estimates & Forecast, By Distribution Channel, 2021 - 2034 (USD Billion) (Million Units)
- 10.1 Key trends
- 10.2 Online
- 10.2.1 E-commerce websites
- 10.2.2 Company-owned websites
- 10.3 Offline
- 10.3.1 Hypermarkets and supermarkets
- 10.3.2 Pharmaceutical and drug store
- 10.3.3 Other retail stores
Chapter 11 Market Estimates & Forecast, By Region, 2021 - 2034 (USD Billion) (Million Units)
- 11.1 Key trends
- 11.2 North America
- 11.2.1 U.S.
- 11.2.2 Canada
- 11.3 Europe
- 11.3.1 UK
- 11.3.2 Germany
- 11.3.3 France
- 11.3.4 Italy
- 11.3.5 Spain
- 11.3.6 Russia
- 11.4 Asia Pacific
- 11.4.1 China
- 11.4.2 India
- 11.4.3 Japan
- 11.4.4 South Korea
- 11.4.5 Australia
- 11.5 Latin America
- 11.5.1 Brazil
- 11.5.2 Mexico
- 11.6 MEA
- 11.6.1 South Africa
- 11.6.2 Saudi Arabia
- 11.6.3 UAE
Chapter 12 Company Profiles
- 12.1 3M
- 12.2 BASF SE
- 12.3 Bayer AG
- 12.4 Johnson & Johnson
- 12.5 Kimberly-Clark Corporation
- 12.6 Procter & Gamble
- 12.7 Reckitt Benckiser Group plc
- 12.8 Suominen Corporation
- 12.9 The Clorox Company
- 12.10 Unilever

