
PUBLISHER: Global Market Insights Inc. | PRODUCT CODE: 1666650

PUBLISHER: Global Market Insights Inc. | PRODUCT CODE: 1666650
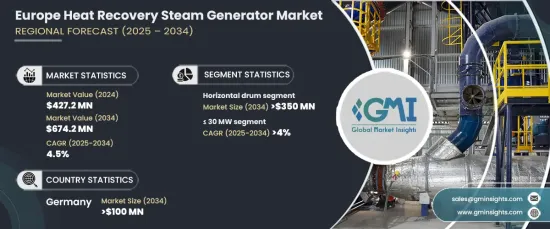
Europe Heat Recovery Steam Generator Market Opportunity, Growth Drivers, Industry Trend Analysis, and Forecast 2025 - 2034
Europe Heat Recovery Steam Generator Market, valued at USD 427.2 million in 2024, is expected to grow at a CAGR of 4.5% from 2025 to 2034. A key driver for this market growth is the increasing demand for energy alongside a shift towards integrating renewable energy sources. Furthermore, strict energy efficiency regulations and the growing need to reduce carbon emissions are influencing the adoption of HRSG systems across industries. Efforts to enhance the performance and efficiency of HRSGs through advanced technologies such as better coatings, materials, and control systems are expected to drive product adoption. The market is also supported by rising electricity costs, declining installation costs for HRSG systems, and an increasing focus on sustainability. As industrialization accelerates and governments implement initiatives to boost energy efficiency, the HRSG market is poised for significant growth.
The HRSG is a sophisticated pressure vessel with several heat exchangers, including boilers, superheaters, and economizers. The systems are becoming more popular in a variety of industrial applications due to the need for improved energy recovery, as well as the rising electricity costs. Environmental regulations pushing industries to improve their energy efficiency are also contributing to the growing adoption of HRSGs. Additionally, rapid industrial growth and increasing energy demand across the region further support the expanding market. The ongoing technological advancements in HRSG systems are helping to make these systems more efficient and cost-effective, thus broadening their applicability.
| Market Scope | |
|---|---|
| Start Year | 2024 |
| Forecast Year | 2025-2034 |
| Start Value | $427.2 million |
| Forecast Value | $674.2 million |
| CAGR | 4.5% |
The horizontal drum HRSG segment is projected to reach over USD 350 million by 2034. These systems are favored for their lower initial capital costs and ease of integration with existing infrastructure. With their horizontal exhaust fans and vertically arranged heat exchanger tube bundles, they naturally circulate water and steam mixtures through the evaporator tubes. The expansion of combined cycle power plants and continuous technological advancements are expected to propel the growth of this segment. In addition, HRSG units with a capacity of <= 30 MW are expected to grow at a CAGR of over 4% until 2034. These units are commonly used in small-scale generation plants and for heating in commercial spaces, especially in colder climates. Their rising popularity is driven by the increasing demand for microgas turbines and the growing adoption of cogeneration systems.
Germany's HRSG market is anticipated to exceed USD 100 million by 2034 as the country continues to prioritize energy efficiency and renewable energy adoption. Government regulations focusing on reducing dependence on coal-based power generation and increasing energy demand are key factors shaping the market. Germany is also investing in expanding cogeneration technologies to meet future energy goals. Despite the country's aggressive renewable energy targets, its continued reliance on fossil fuels highlights the challenges and opportunities in the energy sector, providing a unique environment for HRSG market growth.
Table of Contents
Chapter 1 Methodology & Scope
- 1.1 Market definitions
- 1.2 Base estimates & calculations
- 1.3 Forecast calculation
- 1.4 Data sources
- 1.4.1 Primary
- 1.4.2 Secondary
- 1.4.2.1 Paid
- 1.4.2.2 Public
Chapter 2 Industry Insights
- 2.1 Industry ecosystem analysis
- 2.2 Regulatory landscape
- 2.3 Industry impact forces
- 2.3.1 Growth drivers
- 2.3.2 Industry pitfalls & challenges
- 2.4 Growth potential analysis
- 2.5 Porter's analysis
- 2.5.1 Bargaining power of suppliers
- 2.5.2 Bargaining power of buyers
- 2.5.3 Threat of new entrants
- 2.5.4 Threat of substitutes
- 2.6 PESTEL analysis
Chapter 3 Competitive Landscape, 2024
- 3.1 Introduction
- 3.2 Strategic dashboard
- 3.3 Innovation & sustainability landscape
Chapter 4 Market Size and Forecast, By Design, 2021 – 2034 (USD Million)
- 4.1 Key trends
- 4.2 Horizontal drum
- 4.3 Vertical drum
Chapter 5 Market Size and Forecast, By Rated Power, 2021 – 2034 (USD Million)
- 5.1 Key trends
- 5.2 ≤ 30 MW
- 5.3 ≥ 30 - 50 MW
- 5.4 ≥ 50 - 100 MW
- 5.5 ≥ 100 - 200 MW
- 5.6 ≥ 200 MW
Chapter 6 Market Size and Forecast, By Mode of Operation, 2021 – 2034 (USD Million)
- 6.1 Key trends
- 6.2 Cogeneration
- 6.3 Combined cycle
Chapter 7 Market Size and Forecast, By Application, 2021 – 2034 (USD Million)
- 7.1 Key trends
- 7.2 Utilities
- 7.3 Commercial
- 7.4 Chemicals
- 7.5 Refineries
- 7.6 Pulp & paper
- 7.7 Others
Chapter 8 Market Size and Forecast, By Country, 2021 – 2034 (USD Million)
- 8.1 Key trends
- 8.2 UK
- 8.3 France
- 8.4 Russia
- 8.5 Germany
- 8.6 Italy
Chapter 9 Company Profiles
- 9.1 Babcock & Wilcox
- 9.2 Boustead International Heaters
- 9.3 CF Struthers
- 9.4 CIC Group
- 9.5 Clyde Bergemann
- 9.6 Clayton Industries
- 9.7 GE Vernova
- 9.8 Harris Pye
- 9.9 John Cockerill
- 9.10 John Wood Group
- 9.11 Kawasaki Heavy Industries
- 9.12 Mitsubishi Heavy Industries
- 9.13 NEM
- 9.14 Siemens Energy
- 9.15 Sofinter
- 9.16 Thermax

