
PUBLISHER: Global Market Insights Inc. | PRODUCT CODE: 1666555

PUBLISHER: Global Market Insights Inc. | PRODUCT CODE: 1666555
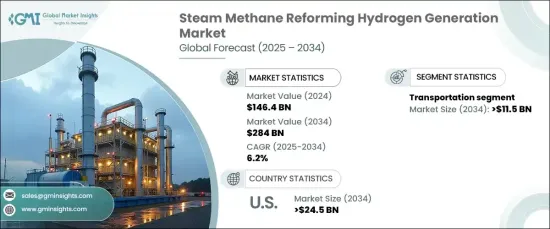
Steam Methane Reforming Hydrogen Generation Market Opportunity, Growth Drivers, Industry Trend Analysis, and Forecast 2025 - 2034
The Global Steam Methane Reforming Hydrogen Generation Market reached USD 146.4 billion in 2024 and is projected to grow at a CAGR of 6.2% between 2025 -2034. SMR technology involves heating methane from natural gas with steam and a catalyst to produce a mixture of carbon monoxide and hydrogen widely used in organic synthesis and energy applications.
Rising crude oil consumption in developing economies and investments in refining infrastructure are creating substantial opportunities for hydrogen producers. Policies promoting cleaner fuel adoption and significant investments in refining are transforming the industry landscape. Regulatory frameworks and incentive programs aimed at reducing sulfur content in fuels, such as gasoline and diesel, are driving the demand for SMR hydrogen generation technologies.
| Market Scope | |
|---|---|
| Start Year | 2024 |
| Forecast Year | 2025-2034 |
| Start Value | $146.4 Billion |
| Forecast Value | $284 Billion |
| CAGR | 6.2% |
The market is segmented by application into power generation, petroleum refining, chemical transportation, industrial energy, and others. The transportation sector is expected to generate USD 11.5 billion through 2034. Growing efforts to decarbonize transportation have led to the development of hydrogen-powered technologies. Major industry players are focusing on expanding hydrogen infrastructure and promoting its adoption in vehicles. Factors such as access to affordable electricity, renewable energy integration, and hydro resources are expected to strengthen hydrogen's role in energy trade, with significant growth opportunities in European and Asian markets.
United States steam methane reforming hydrogen generation market is projected to reach USD 24.5 billion by 2034. The robust outlook for the refining industry, coupled with government initiatives to establish new industrial facilities in sectors like chemicals, automotive, and power, is anticipated to drive product demand. Hydrogen is increasingly being utilized for energy storage, leveraging cost-effective production from abundant renewable and natural resources. Additionally, international collaborations focusing on green hydrogen research and development are expected to further bolster market expansion.
The market growth is further supported by technological advancement aimed at improving the efficiency and sustainability of hydrogen production processes. As governments and industries worldwide prioritize carbon-neutral energy solutions, steam methane reforming continues to play a pivotal role in meeting global hydrogen demand. Its scalability, cost-efficiency, and compatibility with current infrastructure make it a cornerstone of the evolving hydrogen economy.
Table of Contents
Chapter 1 Methodology & Scope
- 1.1 Research Design
- 1.2 Base estimates & calculations
- 1.3 Forecast model
- 1.4 Primary research & validation
- 1.4.1 Primary sources
- 1.4.2 Data mining sources
- 1.5 Market Definitions
Chapter 2 Executive Summary
- 2.1 Industry synopsis, 2021 – 2034
Chapter 3 Industry Insights
- 3.1 Industry ecosystem
- 3.2 Regulatory landscape
- 3.3 Industry impact forces
- 3.3.1 Growth drivers
- 3.3.2 Industry pitfalls & challenges
- 3.4 Growth potential analysis
- 3.5 Porter's analysis
- 3.5.1 Bargaining power of suppliers
- 3.5.2 Bargaining power of buyers
- 3.5.3 Threat of new entrants
- 3.5.4 Threat of substitutes
- 3.6 PESTEL analysis
Chapter 4 Competitive landscape, 2024
- 4.1 Introduction
- 4.2 Strategic dashboard
- 4.3 Innovation & technology landscape
Chapter 5 Market Size and Forecast, By Application, 2021 – 2034 (USD Billion)
- 5.1 Key trends
- 5.2 Petroleum refining
- 5.3 Chemical
- 5.4 Transportation
- 5.5 Power generation
- 5.6 Industry energy
- 5.7 Others
Chapter 6 Market Size and Forecast, By Region, 2021 – 2034 (USD Billion)
- 6.1 Key trends
- 6.2 North America
- 6.2.1 U.S.
- 6.2.2 Canada
- 6.2.3 Mexico
- 6.3 Europe
- 6.3.1 Germany
- 6.3.2 UK
- 6.3.3 France
- 6.3.4 Italy
- 6.3.5 Netherlands
- 6.3.6 Russia
- 6.4 Asia Pacific
- 6.4.1 China
- 6.4.2 Japan
- 6.4.3 India
- 6.5 Middle East & Africa
- 6.5.1 Saudi Arabia
- 6.5.2 Iran
- 6.5.3 UAE
- 6.5.4 South Africa
- 6.6 Latin America
- 6.6.1 Brazil
- 6.6.2 Argentina
- 6.6.3 Chile
Chapter 7 Company Profiles
- 7.1 ALLY HI-TECH CO., LTD.
- 7.2 Air Liquide
- 7.3 Air Products & Chemicals, Inc.
- 7.4 CALORIC
- 7.5 HyGear
- 7.6 HyGear
- 7.7 Linde plc
- 7.8 Mahler AGS GmbH
- 7.9 Messer
- 7.10 NUVERA FUEL CELLS, LLC
- 7.11 Plug Power Inc.
- 7.12 TAIYYON NIPPON SANSO CORPORATION
- 7.13 Topsoe

