
PUBLISHER: Global Market Insights Inc. | PRODUCT CODE: 1721604

PUBLISHER: Global Market Insights Inc. | PRODUCT CODE: 1721604
AGM Battery Market Opportunity, Growth Drivers, Industry Trend Analysis, and Forecast 2025 - 2034
The Global AGM Battery Market was valued at USD 16 billion in 2024 and is estimated to grow at a CAGR of 2.8% to reach USD 21.1 billion by 2034. This market expansion is primarily driven by the increasing adoption of electric and hybrid vehicles, which demand advanced battery technologies to enhance performance. As automotive manufacturers focus on improving fuel efficiency and reducing emissions, AGM batteries have emerged as a key component in these efforts. They are especially crucial for supporting start-stop systems, which help vehicles cut down on fuel consumption by automatically shutting off and restarting engines during idle periods. This contribution to vehicle efficiency and sustainability is driving the popularity of AGM batteries across both automotive and industrial sectors. The growing investment in energy storage systems and environmentally friendly transportation solutions is further accelerating market growth.
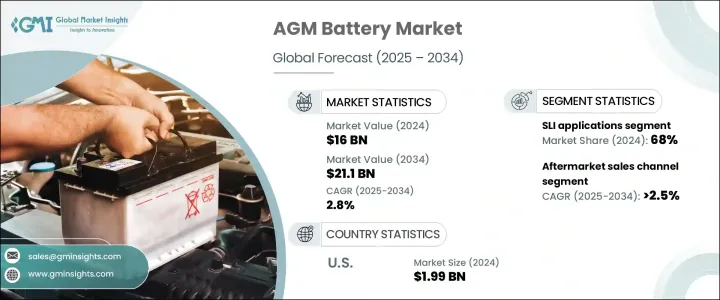
The aftermarket segment is experiencing steady growth, projected to register a CAGR of 2.5% through 2034. The increasing need for dependable replacement batteries in older vehicles, particularly those equipped with start-stop systems, is fueling this demand. Meanwhile, original equipment manufacturers are incorporating AGM batteries at an accelerating pace, using them as standard or optional components in newer car models. As vehicle designs continue to prioritize energy efficiency, AGM batteries align with broader sustainability, performance, and regulatory goals.
| Market Scope | |
|---|---|
| Start Year | 2024 |
| Forecast Year | 2025-2034 |
| Start Value | $16 Billion |
| Forecast Value | $21.1 Billion |
| CAGR | 2.8% |
In 2024, the SLI applications segment accounted for a dominant 68% share. This segment benefits significantly from the widespread adoption of start-stop systems in modern vehicles, which require reliable, long-lasting power. AGM batteries are well-suited for this high-performance need, making them the preferred option in such applications. The stationary application segment is also experiencing consistent growth, driven by the increasing demand for energy storage systems. As renewable energy sources become more prevalent, AGM batteries are being deployed in backup and off-grid power systems, ensuring stability and an uninterrupted energy supply. Their low-maintenance and durable design further supports their growing use across commercial and residential energy infrastructures.
In the U.S., the AGM Battery Market generated USD 1.99 billion in 2024. This growth is bolstered by the rise in popularity of fuel-efficient and hybrid vehicles, as well as the ongoing need for reliable replacement batteries in older vehicles. With a continued focus on reducing carbon footprints and enhancing vehicle performance, AGM batteries are becoming standard in an increasing number of advanced vehicle models. The aftermarket segment remains robust, driven by consistent demand for battery replacements in high-usage regions.
Companies like Exide Technologies, C&D Technologies, EnerSys, GS Yuasa International, Hoppecke Batterien, The Furukawa Battery, Mutlu Battery, Amara Raja Batteries, East Penn Manufacturing, Leoch International Technology, First National Battery, Crown Battery, Clarios, and Shandong Sacred Sun Power Sources are focused on vertical integration, expanding their R&D efforts, and forming strategic alliances. These companies are investing in advanced battery chemistries, enhancing energy density, and improving battery lifecycle performance. Many are also forging OEM partnerships and expanding their global distribution networks while prioritizing sustainability through recycling programs and environmentally conscious manufacturing practices.
Table of Contents
Chapter 1 Methodology & Scope
- 1.1 Market definitions
- 1.2 Base estimates & calculations
- 1.3 Forecast calculation
- 1.4 Data sources
- 1.4.1 Primary
- 1.4.2 Secondary
- 1.4.2.1 Paid
- 1.4.2.2 Public
Chapter 2 Executive Summary
- 2.1 Industry synopsis, 2021 - 2034
Chapter 3 Industry Insights
- 3.1 Industry ecosystem analysis
- 3.2 Regulatory landscape
- 3.3 Industry impact forces
- 3.3.1 Growth drivers
- 3.3.2 Industry pitfalls & challenges
- 3.4 Growth potential analysis
- 3.5 Porter's analysis
- 3.5.1 Bargaining power of suppliers
- 3.5.2 Bargaining power of buyers
- 3.5.3 Threat of new entrants
- 3.5.4 Threat of substitutes
- 3.6 PESTEL analysis
Chapter 4 Competitive Landscape, 2024
- 4.1 Strategic dashboard
- 4.2 Innovation & sustainability landscape
Chapter 5 Market Size and Forecast, By Application, 2021 - 2034 (USD Million, Million Units)
- 5.1 Key trends
- 5.2 Stationary
- 5.2.1 Telecommunications
- 5.2.2 UPS
- 5.2.3 Control & switchgear
- 5.2.4 Others
- 5.3 Motive
- 5.4 SLI
Chapter 6 Market Size and Forecast, By Sales Channel, 2021 - 2034 (USD Million, Million Units)
- 6.1 Key trends
- 6.2 OEM
- 6.3 Aftermarket
Chapter 7 Market Size and Forecast, By Region, 2021 - 2034 (USD Million, Million Units)
- 7.1 Key trends
- 7.2 North America
- 7.2.1 U.S.
- 7.2.2 Canada
- 7.3 Europe
- 7.3.1 Germany
- 7.3.2 UK
- 7.3.3 France
- 7.3.4 Russia
- 7.3.5 Italy
- 7.4 Asia Pacific
- 7.4.1 China
- 7.4.2 Japan
- 7.4.3 India
- 7.4.4 South Korea
- 7.4.5 Indonesia
- 7.5 Middle East & Africa
- 7.5.1 Saudi Arabia
- 7.5.2 UAE
- 7.5.3 Iran
- 7.5.4 Turkey
- 7.6 Latin America
- 7.6.1 Brazil
- 7.6.2 Argentina
- 7.6.3 Mexico
Chapter 8 Company Profiles
- 8.1 Amara Raja Batteries
- 8.2 C&D Technologies
- 8.3 Clarios
- 8.4 Crown Battery
- 8.5 East Penn Manufacturing
- 8.6 EnerSys
- 8.7 Exide Technologies
- 8.8 First National Battery
- 8.9 GS Yuasa International
- 8.10 Hoppecke Batterien
- 8.11 Leoch International Technology
- 8.12 Mutlu Battery
- 8.13 Shandong Sacred Sun Power Sources
- 8.14 The Furukawa Battery

