
PUBLISHER: Global Market Insights Inc. | PRODUCT CODE: 1936628

PUBLISHER: Global Market Insights Inc. | PRODUCT CODE: 1936628
Marine Propulsion Engine Market Opportunity, Growth Drivers, Industry Trend Analysis, and Forecast 2026 - 2035
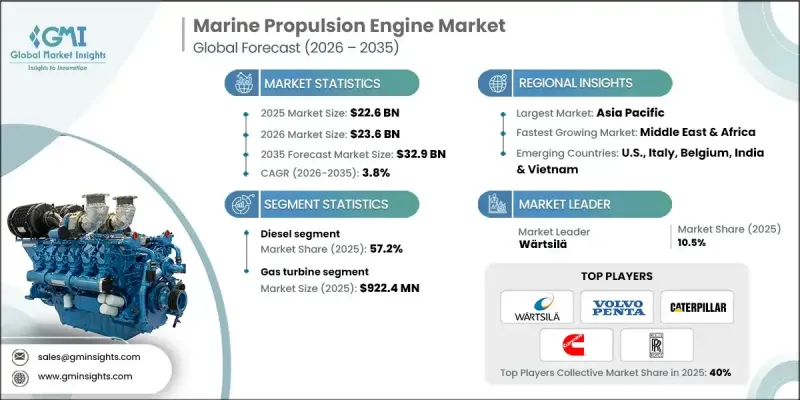
The Global Marine Propulsion Engine Market was valued at USD 22.6 billion in 2025 and is estimated to grow at a CAGR of 3.8% to reach USD 32.9 billion by 2035.
Market growth is shaped by the intensifying global push to lower emissions across maritime operations, prompting fleet operators to reassess propulsion technologies for long-term regulatory alignment. Demand is shifting toward cleaner, more efficient propulsion systems capable of operating on alternative and low-carbon fuels while maintaining reliability and power output. Marine propulsion engines serve as the core mechanical systems that generate thrust for vessel movement by converting energy into controlled motion through integrated propulsion components. Rising global trade volumes and extended shipping routes are reinforcing the need for engines that deliver greater endurance, efficiency, and performance consistency. Fleet renewal programs targeting aging vessels across commercial, offshore, and government segments are driving investment in digitally advanced propulsion platforms. Intelligent engine architectures that incorporate real-time monitoring, data analytics, and predictive maintenance capabilities are increasingly prioritized to improve uptime and lifecycle efficiency. Shipowners are also favoring flexible propulsion configurations that support fuel adaptability without compromising durability or operational stability.
| Market Scope | |
|---|---|
| Start Year | 2025 |
| Forecast Year | 2026-2035 |
| Start Value | $22.6 Billion |
| Forecast Value | $32.9 Billion |
| CAGR | 3.8% |
The wind and solar-based marine propulsion engine segment is projected to reach USD 1.5 billion by 2035. Hybridized propulsion architectures that combine renewable inputs with onboard energy storage and control systems are gaining traction as operators seek to optimize fuel usage during low-demand operating conditions. Advanced energy management frameworks are improving load balancing and emissions performance while supporting more efficient voyage planning.
The fuel cell-based marine propulsion engines segment accounted for a 3.9% share in 2025. Adoption is gradually increasing as vessel operators pursue zero-emission propulsion options aligned with evolving environmental mandates. Scalable system designs and modular integration approaches are enabling gradual deployment while ensuring operational redundancy and adaptability to different vessel requirements.
United States Marine Propulsion Engine Market held a 68.6% share in 2025, generating USD 2.2 billion. This growth is being fueled by increasing domestic maritime activity, including coastal shipping, inland waterways, and offshore operations, which are driving demand for efficient, high-performance propulsion systems. Substantial investments in shipbuilding, particularly for commercial and naval fleets, are further bolstering market expansion, as new vessels are increasingly being equipped with low-emission, digitally enabled engines.
Key participants active in the Global Marine Propulsion Engine Market include Wartsila, Caterpillar, Rolls-Royce, Yanmar Marine International, Cummins, AB Volvo Penta, Mitsubishi Heavy Industries, Scania, Deutz AG, HD Hyundai Heavy Industries Engine & Machinery, Yamaha Motor, Perkins Engines, Anglo Belgian Corporation, Vetus, Nanni, Masson Marine, Ingeteam, Steyr, Deere & Company, and Isuzu Motors Engine Sales. These companies maintain competitive positioning through innovation, portfolio diversification, and global service networks. To strengthen their foothold in pharmaceutical and healthcare-related marine applications, propulsion engine manufacturers are prioritizing reliability, precision control, and low-emission performance. Companies are developing propulsion solutions optimized for vessels supporting medical logistics, offshore healthcare access, and temperature-sensitive cargo transport. Strategic investments focus on noise reduction, vibration control, and stable power delivery to protect sensitive onboard equipment. Manufacturers are also expanding service agreements and remote diagnostics to ensure uninterrupted operations in critical missions.
Table of Contents
Chapter 1 Methodology & Scope
- 1.1 Research approach
- 1.2 Quality commitments
- 1.2.1 GMI AI policy & data integrity commitment
- 1.2.1.1 Source consistency protocol
- 1.2.1 GMI AI policy & data integrity commitment
- 1.3 Research trail & confidence scoring
- 1.3.1 Research trail components
- 1.3.2 Scoring components
- 1.4 Data collection
- 1.4.1 Partial list of primary sources
- 1.5 Data mining sources
- 1.5.1 Paid sources
- 1.5.1.1 Sources, by region
- 1.5.1 Paid sources
- 1.6 Base estimates and calculations
- 1.6.1 Base year calculation for any one approach
- 1.7 Market estimates & forecasts parameters
- 1.8 Forecast model
- 1.8.1 Quantified market impact analysis
- 1.8.1.1 Mathematical impact of growth parameters on forecast
- 1.8.1 Quantified market impact analysis
- 1.9 Research transparency addendum
- 1.9.1 Source attribution framework
- 1.9.2 Quality assurance metrics
- 1.9.3 Our commitment to trust
- 1.10 Market definitions
Chapter 2 Executive Summary
- 2.1 Industry synopsis, 2022 - 2035
- 2.2 Business trends
- 2.3 Product trends
- 2.4 Regional trends
Chapter 3 Industry Insights
- 3.1 Industry ecosystem analysis
- 3.1.1 Raw material availability & sourcing analysis
- 3.1.2 Manufacturing capacity assessment
- 3.1.3 Supply chain resilience & risk factors
- 3.1.4 Distribution network analysis
- 3.2 Regulatory landscape
- 3.3 Industry impact forces
- 3.3.1 Growth drivers
- 3.3.2 Industry pitfalls & challenges
- 3.4 Growth potential analysis
- 3.5 Porter's analysis
- 3.5.1 Bargaining power of suppliers
- 3.5.2 Bargaining power of buyers
- 3.5.3 Threat of new entrants
- 3.5.4 Threat of substitutes
- 3.6 PESTEL analysis
- 3.6.1 Political factors
- 3.6.2 Economic factors
- 3.6.3 Social factors
- 3.6.4 Technological factors
- 3.6.5 Legal factors
- 3.6.6 Environmental factors
- 3.7 Cost structure analysis of marine propulsion engine
- 3.8 Price trend analysis
- 3.8.1 By product
- 3.8.2 By region
- 3.9 Emerging opportunities & trends
- 3.10 Digitalization and IoT integration
Chapter 4 Competitive Landscape, 2026
- 4.1 Introduction
- 4.2 Company market share analysis, by region, 2025
- 4.2.1 North America
- 4.2.2 Europe
- 4.2.3 Asia Pacific
- 4.2.4 Middle East & Africa
- 4.2.5 Latin America
- 4.3 Strategic dashboard
- 4.3.1 Key partnerships & collaborations
- 4.3.2 Major M&A activities
- 4.3.3 Product innovations & launches
- 4.3.4 Market expansion strategies
- 4.4 Strategic initiatives
- 4.5 Competitive benchmarking
- 4.6 Innovation & technology landscape
Chapter 5 Market Size and Forecast, By Product, 2022 - 2035 (USD Million)
- 5.1 Key trends
- 5.2 Diesel
- 5.3 Wind & solar
- 5.4 Gas turbine
- 5.5 Fuel cell
- 5.6 Steam turbine
- 5.7 Natural gas
Chapter 6 Market Size and Forecast, By Region, 2022 - 2035 (USD Million)
- 6.1 Key trends
- 6.2 North America
- 6.2.1 U.S.
- 6.2.2 Canada
- 6.3 Europe
- 6.3.1 Germany
- 6.3.2 UK
- 6.3.3 Italy
- 6.3.4 France
- 6.3.5 Russia
- 6.3.6 Denmark
- 6.3.7 Netherlands
- 6.4 Asia Pacific
- 6.4.1 China
- 6.4.2 Japan
- 6.4.3 India
- 6.4.4 South Korea
- 6.4.5 Australia
- 6.4.6 Vietnam
- 6.4.7 Singapore
- 6.5 Middle East & Africa
- 6.5.1 Saudi Arabia
- 6.5.2 UAE
- 6.5.3 Iran
- 6.5.4 Angola
- 6.5.5 Egypt
- 6.5.6 South Africa
- 6.6 Latin America
- 6.6.1 Brazil
- 6.6.2 Argentina
- 6.6.3 Mexico
Chapter 7 Company Profiles
- 7.1 AB Volvo Penta
- 7.2 Anglo Belgian Corporation
- 7.3 Caterpillar
- 7.4 Cummins
- 7.5 Deere & Company
- 7.6 Deutz AG
- 7.7 HD Hyundai Heavy Industries Engine & Machinery
- 7.8 Ingeteam
- 7.9 Isuzu Motors Engine Sales
- 7.10 Masson Marine
- 7.11 Mitsubishi Heavy Industries
- 7.12 Nanni
- 7.13 Perkins Engines
- 7.14 Rolls-Royce
- 7.15 Scania
- 7.16 Steyr
- 7.17 Vetus
- 7.18 Wartsila
- 7.19 Yamaha Motor
- 7.20 Yanmar Marine International

