
PUBLISHER: Global Market Insights Inc. | PRODUCT CODE: 1721570

PUBLISHER: Global Market Insights Inc. | PRODUCT CODE: 1721570
U.S. Distribution Lines Market Opportunity, Growth Drivers, Industry Trend Analysis, and Forecast 2025 - 2034
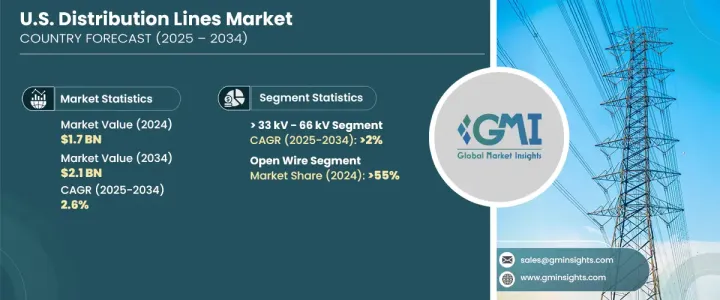
U.S. Distribution Lines Market was valued at USD 1.7 billion in 2024 and is estimated to grow at a CAGR of 2.6% to reach USD 2.1 billion by 2034. The rising demand for efficient, reliable, and sustainable energy infrastructure is fueling investments across the country's power distribution network. With a growing emphasis on energy transition and the decarbonization of the grid, utilities and energy providers are increasingly focusing on strengthening and modernizing distribution systems to meet evolving power requirements. Rapid urbanization, expanding electrification initiatives, and the widespread integration of distributed energy resources like solar and wind power are driving the need for resilient, intelligent, and flexible distribution lines. In the face of growing climate threats and aging infrastructure, the modernization of the electric grid has become a national priority, prompting both public and private sector efforts. Strategic collaborations and increased capital allocation are playing a pivotal role in reshaping how electricity is transmitted and delivered across cities and rural areas alike.
Several key factors are actively supporting the growth of this market, including innovations in grid modernization, the rising share of renewable energy, and the electrification of transportation systems. Automation in grid infrastructure is another transformative force, with utilities adopting AI and IoT-based sensors for predictive maintenance. These advanced technologies enable real-time fault detection and condition monitoring, minimizing the risk of outages and ensuring continuous, safe electricity distribution. By proactively identifying and addressing weak points, utilities are significantly improving the overall reliability and performance of the distribution network.
| Market Scope | |
|---|---|
| Start Year | 2024 |
| Forecast Year | 2025-2034 |
| Start Value | $1.7 Billion |
| Forecast Value | $2.1 Billion |
| CAGR | 2.6% |
Microgrids are gaining ground across the U.S. for their ability to operate autonomously or alongside the main grid, offering dependable backup power during grid failures or natural disasters. Their resilience and scalability make them a vital component of community energy systems, especially in regions frequently impacted by severe weather. Government-backed initiatives at both the state and federal levels are also providing critical support through incentives and funding programs aimed at accelerating grid modernization efforts.
Medium-voltage distribution lines, particularly those in the 11 kV to 33 kV range, are witnessing strong adoption owing to increased urban development, industrial expansion, and renewable energy projects. These lines play a central role in modern power infrastructure by ensuring efficient power transmission over medium distances. Meanwhile, demand for higher-voltage distribution lines, such as those operating between 33 kV and 66 kV, is expected to grow at a CAGR of 2% through 2034, driven by their ability to support long-distance electricity movement and interconnection of large-scale renewable installations.
The industry is also shifting toward insulated cables over traditional open wire systems, thanks to their improved safety, higher energy handling capacity, and reliability in densely populated or high-demand zones. While open wire systems still maintain a strong presence in rural settings due to their low installation cost and simplicity, aerial bundled conductors (ABC) are increasingly favored in urban applications where safety and durability are paramount.
Key players shaping the U.S. Distribution Lines Market include Nexans, Prysmian Group, Siemens Energy, Marmon, Southwire Company, LLC., Sumitomo Electric Industries Ltd., Encore Wire Corporation, Quanta Services, CTC Global Corporation, The Okonite Company, American Wire Group, and Bekaert. These companies are expanding product lines, investing in new technologies, and strengthening manufacturing capabilities to meet the evolving needs of the grid. Strategic partnerships with government agencies and advancements in energy-efficient solutions remain central to their market growth strategies.
Table of Contents
Chapter 1 Methodology & Scope
- 1.1 Market scope & definitions
- 1.2 Market estimates & forecast parameters
- 1.3 Forecast calculation
- 1.4 Data sources
- 1.4.1 Primary
- 1.4.2 Secondary
- 1.4.2.1 Paid
- 1.4.2.2 Public
Chapter 2 Industry Insights
- 2.1 Industry ecosystem analysis
- 2.2 Regulatory landscape
- 2.3 Industry impact forces
- 2.3.1 Growth drivers
- 2.3.2 Industry pitfalls & challenges
- 2.4 Growth potential analysis
- 2.5 Porter's analysis
- 2.5.1 Bargaining power of suppliers
- 2.5.2 Bargaining power of buyers
- 2.5.3 Threat of new entrants
- 2.5.4 Threat of substitutes
- 2.6 PESTEL analysis
Chapter 3 Competitive Landscape, 2024
- 3.1 Introduction
- 3.2 Strategic outlook
- 3.3 Innovation & sustainability landscape
Chapter 4 Market Size and Forecast, By Voltage, 2021 - 2034 (ckm, USD Billion)
- 4.1 Key trends
- 4.2 < 11 kV
- 4.3 11-33 kV
- 4.4 > 33 kV - 66 kV
- 4.5 > 66 kV
Chapter 5 Market Size and Forecast, By Product, 2021 - 2034 (ckm, USD Billion)
- 5.1 Key trends
- 5.2 Open wire
- 5.3 ABC
Chapter 6 Company Profiles
- 6.1 American Wire Group
- 6.2 Bekaert
- 6.3 CTC Global Corporation
- 6.4 Encore Wire Corporation
- 6.5 Nexans
- 6.6 Marmon
- 6.7 Prysmian Group
- 6.8 Quanta Services
- 6.9 Siemens Energy
- 6.10 Southwire Company, LLC.
- 6.11 Sumitomo Electric Industries Ltd.
- 6.12 The Okonite Company

