
PUBLISHER: Global Market Insights Inc. | PRODUCT CODE: 1667059

PUBLISHER: Global Market Insights Inc. | PRODUCT CODE: 1667059
U.S. Generator Sets Market Opportunity, Growth Drivers, Industry Trend Analysis, and Forecast 2025 - 2034
U.S. Generator Sets Market reached USD 8.7 billion in 2024 and is expected to grow at a strong CAGR of 6.9% from 2025 to 2034. This impressive growth is driven by a combination of factors, with a rising demand for cleaner, more sustainable energy solutions at the forefront. Technological advancements in generator efficiency, emissions reduction, and automation have made these systems more appealing to industries focused on eco-friendly practices. As businesses aim to reduce their carbon footprint, there has been a clear shift toward energy-efficient, emission-compliant generator sets that offer enhanced performance and environmental responsibility. Furthermore, the integration of cutting-edge Internet of Things (IoT) technologies, such as predictive maintenance, remote monitoring, and diagnostics, is revolutionizing the market. These smart capabilities are transforming various industries, particularly construction, where reliable power solutions are critical for seamless operations and on-the-job efficiency.
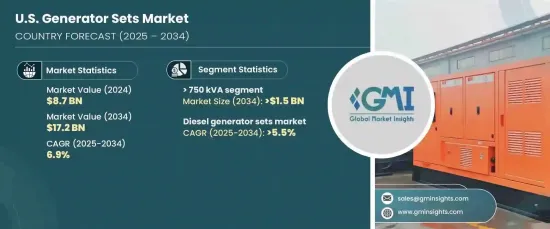
A growing trend in the market is the increasing demand for high-capacity generator sets. The market for generator sets with capacities exceeding 750 kVA is projected to reach USD 1.5 billion by 2034. This growth is primarily driven by industries with substantial power needs, such as large manufacturing plants and commercial facilities. High-capacity generators are essential in meeting the substantial energy requirements of energy-intensive industries. The demand for advanced technologies, such as enhanced security features and support for operations in remote locations, is expected to further boost the expansion of this segment.
| Market Scope | |
|---|---|
| Start Year | 2024 |
| Forecast Year | 2025-2034 |
| Start Value | $8.7 Billion |
| Forecast Value | $17.2 Billion |
| CAGR | 6.9% |
The diesel generator sets segment remains a significant portion of the market, with a growth rate of 5.5% through 2034. Diesel-powered gensets continue to be a go-to choice due to their reliability and cost-effectiveness. As demand for consistent, uninterrupted power continues to rise, especially for emergency applications, the appeal of diesel generators in critical sectors strengthens. Innovations in diesel technology, such as improved fuel efficiency, emissions compliance, hybrid solutions, and the incorporation of alternative fuels, are increasing the appeal of these units across various industries. These generators excel at handling fluctuating power demands and are particularly useful during grid failures when immediate backup power is essential.
The U.S. generator sets market is projected to reach USD 17.2 billion by 2034, fueled by their capability to deliver scalable, uninterrupted power combined with advanced emission control technologies. As the strain on utility power supplies grows, alongside more frequent and severe weather disruptions, the need for reliable backup power solutions is becoming increasingly urgent. Government regulations aimed at reducing emissions will continue to influence the deployment of advanced generator sets, ensuring the market remains robust as industries seek solutions that meet both performance and environmental standards.
Table of Contents
Chapter 1 Methodology & Scope
- 1.1 Market scope & definitions
- 1.2 Market estimates & forecast parameters
- 1.3 Forecast calculation
- 1.4 Data sources
- 1.4.1 Primary
- 1.4.2 Secondary
- 1.4.2.1 Paid
- 1.4.2.2 Public
Chapter 2 Industry Insights
- 2.1 Industry ecosystem analysis
- 2.2 Regulatory landscape
- 2.3 Industry impact forces
- 2.3.1 Growth drivers
- 2.3.2 Industry pitfalls & challenges
- 2.4 Growth potential analysis
- 2.5 Porter's analysis
- 2.5.1 Bargaining power of suppliers
- 2.5.2 Bargaining power of buyers
- 2.5.3 Threat of new entrants
- 2.5.4 Threat of substitutes
- 2.6 PESTEL analysis
Chapter 3 Competitive Landscape, 2024
- 3.1 Introduction
- 3.2 Strategic outlook
- 3.3 Innovation & sustainability landscape
Chapter 4 Market Size and Forecast, By Power Rating, 2021 – 2034 ('000 Units & USD Million)
- 4.1 Key trends
- 4.2 ≤ 50 kVA
- 4.3 > 50 kVA - 125 kVA
- 4.4 > 125 kVA - 200 kVA
- 4.5 > 200 kVA - 330 kVA
- 4.6 > 330 kVA - 750 kVA
- 4.7 > 750 kVA
Chapter 5 Market Size and Forecast, By Fuel, 2021 – 2034 ('000 Units & USD Million)
- 5.1 Key trends
- 5.2 Diesel
- 5.3 Gas
- 5.4 Hybrid & others
Chapter 6 Market Size and Forecast, By End Use, 2021 – 2034 ('000 Units & USD Million)
- 6.1 Key trends
- 6.2 Residential
- 6.3 Commercial
- 6.3.1 Telecom
- 6.3.2 Healthcare
- 6.3.3 Data centers
- 6.3.4 Educational institutions
- 6.3.5 Government centers
- 6.3.6 Hospitality
- 6.3.7 Retail sales
- 6.3.8 Real estate
- 6.3.9 Commercial complex
- 6.3.10 Infrastructure
- 6.3.11 Others
- 6.4 Industrial
- 6.4.1 Oil & gas
- 6.4.2 Manufacturing
- 6.4.3 Construction
- 6.4.4 Electric utilities
- 6.4.5 Mining
- 6.4.6 Transportation & logistics
- 6.4.7 Others
Chapter 7 Market Size and Forecast, By Application, 2021 – 2034 ('000 Units & USD Million)
- 7.1 Key trends
- 7.2 Standby
- 7.3 Peak shaving
- 7.4 Prime/continuous
Chapter 8 Company Profiles
- 8.1 American Honda Motor
- 8.2 Atlas Copco
- 8.3 Briggs & Stratton
- 8.4 Caterpillar
- 8.5 Cummins
- 8.6 Deere & Company
- 8.7 Generac Power Systems
- 8.8 Himoinsa
- 8.9 Kohler
- 8.10 Kirloskar
- 8.11 Mitsubishi Heavy Industries
- 8.12 Rapid Power Generation
- 8.13 Rolls-Royce
- 8.14 Sterling & Wilson
- 8.15 Wartsila
- 8.16 Yamaha Motor

