
PUBLISHER: Global Market Insights Inc. | PRODUCT CODE: 1684867

PUBLISHER: Global Market Insights Inc. | PRODUCT CODE: 1684867
Fuel Grade Petcoke Market Opportunity, Growth Drivers, Industry Trend Analysis, and Forecast 2025 - 2034
The Global Fuel Grade Petcoke Market was valued at USD 14.3 billion in 2024 and is projected to grow at a CAGR of 5.6% between 2025 and 2034. This growth is driven by the increasing demand for high-calorific energy sources across various industrial sectors. Fuel-grade petcoke, a byproduct of the oil refining process, has become a critical component in industries such as power generation, cement production, and aluminum manufacturing. These industries rely heavily on cost-effective and high-energy fuels to meet their substantial energy requirements. Additionally, the rising focus on industrial efficiency and cost optimization has further amplified the adoption of fuel-grade petcoke. The market is also benefiting from advancements in refining technologies and the expansion of refining capacities, particularly in emerging economies. As global energy demands continue to rise, fuel-grade petcoke is expected to play a pivotal role in addressing the energy needs of heavy industries.
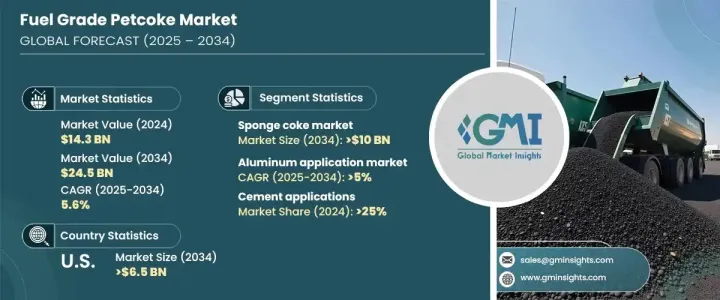
The sponge coke segment is anticipated to generate USD 10 billion by 2034, driven by its extensive use in the power and cement industries. Industries are increasingly seeking affordable fuels with higher energy content, which has significantly boosted the demand for sponge coke. Its application as an anode material in aluminum smelting further contributes to its growing market share. The sector is witnessing intensified competition due to increased investments in refining capacity and technological advancements, particularly in developing regions. These factors are expected to sustain the growth of the sponge coke segment over the forecast period.
| Market Scope | |
|---|---|
| Start Year | 2024 |
| Forecast Year | 2025-2034 |
| Start Value | $14.3 Billion |
| Forecast Value | $24.5 Billion |
| CAGR | 5.6% |
The fuel-grade petcoke market for aluminum applications is projected to grow at a CAGR of 5% until 2034. This growth is attributed to the aluminum industry's shift toward recyclable materials, fluctuating price trends, and growing environmental concerns. Aluminum's versatile properties and widespread applications in sectors such as automotive, construction, packaging, and aerospace continue to drive its global demand. Fuel-grade petcoke plays a vital role in aluminum production, particularly in the manufacturing of anodic-grade aluminum, which further fuels its market growth. The consistent demand for aluminum across various industries ensures a steady requirement for petcoke in this application.
U.S. fuel-grade petcoke market is expected to reach USD 6.5 billion by 2034, supported by strong demand from energy-intensive industries such as power generation, cement, and steel. The affordability and high energy content of petcoke makes it a preferred choice for refineries and industrial plants. As the U.S. industrial base continues to expand, particularly in the cement and petrochemical sectors, fuel-grade petcoke remains a critical energy source. Its cost-effectiveness compared to other fossil fuels further solidifies its position in the market, ensuring sustained growth over the forecast period.
Table of Contents
Chapter 1 Methodology & Scope
- 1.1 Market scope & definitions
- 1.2 Market estimates & forecast parameters
- 1.3 Forecast calculation
- 1.4 Data sources
- 1.4.1 Primary
- 1.4.2 Secondary
- 1.4.2.1 Paid
- 1.4.2.2 Public
Chapter 2 Executive Summary
- 2.1 Industry synopsis, 2021 - 2034
Chapter 3 Industry Insights
- 3.1 Industry ecosystem analysis
- 3.2 Regulatory landscape
- 3.3 Industry impact forces
- 3.3.1 Growth drivers
- 3.3.2 Industry pitfalls & challenges
- 3.4 Growth potential analysis
- 3.5 Porter's analysis
- 3.5.1 Bargaining power of suppliers
- 3.5.2 Bargaining power of buyers
- 3.5.3 Threat of new entrants
- 3.5.4 Threat of substitutes
- 3.6 PESTEL analysis
Chapter 4 Competitive Landscape, 2024
- 4.1 Introduction
- 4.2 Strategic outlook
- 4.3 Innovation & sustainability landscape
Chapter 5 Market Size and Forecast, By Physical Form, 2021 – 2034 (MT, USD Billion)
- 5.1 Key trends
- 5.2 Sponge coke
- 5.3 Purge coke
- 5.4 Shot coke
- 5.5 Needle coke
- 5.6 Others
Chapter 6 Market Size and Forecast, By Application, 2021 – 2034 (MT, USD Billion)
- 6.1 Key trends
- 6.2 Power plants
- 6.3 Cement industry
- 6.4 Steel industry
- 6.5 Aluminum industry
- 6.6 Others
Chapter 7 Market Size and Forecast, By Region, 2021 – 2034 (MT, USD Billion)
- 7.1 Key trends
- 7.2 North America
- 7.2.1 U.S.
- 7.2.2 Canada
- 7.3 Europe
- 7.3.1 UK
- 7.3.2 Spain
- 7.3.3 Italy
- 7.3.4 France
- 7.3.5 Germany
- 7.4 Asia Pacific
- 7.4.1 China
- 7.4.2 India
- 7.4.3 Japan
- 7.4.4 Australia
- 7.5 Middle East & Africa
- 7.5.1 Saudi Arabia
- 7.5.2 Turkey
- 7.5.3 Morocco
- 7.6 Latin America
- 7.6.1 Brazil
- 7.6.2 Argentina
Chapter 8 Company Profiles
- 8.1 Aminco Resources
- 8.2 Bharat Petroleum
- 8.3 BP
- 8.4 Cenovus
- 8.5 Chevron
- 8.6 Cocan Graphite
- 8.7 Exxon Mobil
- 8.8 Indian Oil
- 8.9 Marathon Petroleum
- 8.10 Oxbow
- 8.11 Reliance Industries
- 8.12 Saudi Aramco
- 8.13 Shamokin Carbons
- 8.14 Shell
- 8.15 Valero

