
PUBLISHER: Global Market Insights Inc. | PRODUCT CODE: 1666927

PUBLISHER: Global Market Insights Inc. | PRODUCT CODE: 1666927
High Voltage Electric Insulators Market Opportunity, Growth Drivers, Industry Trend Analysis, and Forecast 2025 - 2034
The Global High Voltage Electric Insulators Market was valued at USD 2 billion in 2024 and is projected to grow at a robust CAGR of 6.2% from 2024 to 2034. This growth is primarily driven by rising investments in grid infrastructure and an increasing global demand for reliable electricity supply.
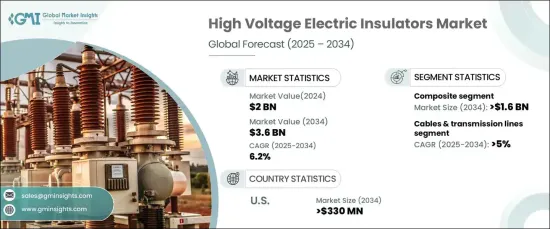
The composite insulators segment is set to generate USD 1.6 billion by 2034. The expansion of power generation facilities and ongoing grid modernization efforts are fueling the growing demand for composite insulators. These insulators are specifically designed to meet the high voltage needs of modern electrical systems. Their enhanced durability and superior performance make them ideal for meeting the evolving demands of energy infrastructure. Regulatory bodies are increasingly focused on expanding transmission and distribution (T&D) networks to ensure grid stability. Simultaneously, significant investments in research and development are spurring innovations in materials and design, leading to improved performance and efficiency of composite insulators, further driving their widespread adoption.
| Market Scope | |
|---|---|
| Start Year | 2024 |
| Forecast Year | 2025-2034 |
| Start Value | $2 billion |
| Forecast Value | $3.6 Billion |
| CAGR | 6.2% |
The cable and transmission line segment is anticipated to grow at a steady CAGR of 5% through 2034. As global demand for reliable electricity continues to rise, there is a heightened focus on improving the capacity and efficiency of transmission lines. Governments worldwide have introduced policies aimed at expanding power generation capabilities and upgrading aging infrastructure. The shift toward building high-capacity transmission lines and improving grid system reliability is expected to drive the market's expansion in the coming years.
The U.S. high voltage electric insulators market is projected to generate USD 330 million by 2034. The country's increasing emphasis on modernizing its power generation infrastructure and strengthening its electrical grid will significantly boost demand for high voltage insulators. Efforts to enhance the resilience of the energy system, along with the implementation of policies promoting sustainable energy development, will further propel the market. Moreover, continuous investments from both the public and private sectors in supporting energy infrastructure growth will complement the overall positive market outlook.
Table of Contents
Chapter 1 Methodology & Scope
- 1.1 Market definitions
- 1.2 Base estimates & calculations
- 1.3 Forecast calculation
- 1.4 Data sources
- 1.4.1 Primary
- 1.4.2 Secondary
- 1.4.2.1 Paid
- 1.4.2.2 Public
Chapter 2 Executive Summary
- 2.1 Industry 360° synopsis, 2021 - 2034
Chapter 3 Industry Insights
- 3.1 Industry ecosystem analysis
- 3.2 Regulatory landscape
- 3.3 Industry impact forces
- 3.3.1 Growth drivers
- 3.3.2 Industry pitfalls & challenges
- 3.4 Growth potential analysis
- 3.5 Porter's analysis
- 3.5.1 Bargaining power of suppliers
- 3.5.2 Bargaining power of buyers
- 3.5.3 Threat of new entrants
- 3.5.4 Threat of substitutes
- 3.6 PESTEL analysis
Chapter 4 Competitive Landscape, 2024
- 4.1 Introduction
- 4.2 Strategic dashboard
- 4.3 Innovation & sustainability landscape
Chapter 5 Market Size and Forecast, By Material, 2021 – 2034 (USD Million)
- 5.1 Key trends
- 5.2 Ceramic/porcelain
- 5.3 Glass
- 5.4 Composite
Chapter 6 Market Size and Forecast, By Application, 2021 – 2034 (USD Million)
- 6.1 Key trends
- 6.2 Cables and transmission lines
- 6.3 Switchgears
- 6.4 Transformer
- 6.5 Bus Bars
- 6.6 Others
Chapter 7 Market Size and Forecast, By End-Use, 2021 – 2034 (USD Million)
- 7.1 Key trends
- 7.2 Commercial & industrial
- 7.3 Utilities
Chapter 8 Market Size and Forecast, By Rating, 2021 – 2034 (USD Million)
- 8.1 Key trends
- 8.2 > 145 kV to ≤ 220 kV
- 8.3 > 220 kV to ≤ 400 kV
- 8.4 > 400 kV to ≤ 800 kV
- 8.5 > 800 kV to ≤ 1,200 kV
- 8.6 > 1,200 kV
Chapter 9 Market Size and Forecast, By Installation, 2021 – 2034 (USD Million)
- 9.1 Key trends
- 9.2 Distribution
- 9.3 Transmission
- 9.4 Substation
- 9.5 Railways
- 9.6 Others
Chapter 10 Market Size and Forecast, By Region, 2021 – 2034 (USD Million)
- 10.1 Key trends
- 10.2 North America
- 10.2.1 U.S
- 10.2.2 Canada
- 10.2.3 Mexico
- 10.3 Europe
- 10.3.1 UK
- 10.3.2 Germany
- 10.3.3 France
- 10.3.4 Spain
- 10.3.5 Italy
- 10.3.6 Russia
- 10.4 Asia Pacific
- 10.4.1 China
- 10.4.2 Japan
- 10.4.3 India
- 10.4.4 Australia
- 10.4.5 South Korea
- 10.5 Middle East & Africa
- 10.5.1 Saudi Arabia
- 10.5.2 UAE
- 10.5.3 South Africa
- 10.6 Latin America
- 10.6.1 Brazil
- 10.6.2 Argentina
Chapter 11 Company Profiles
- 11.1 Aditya Birla Insulators
- 11.2 CYG Insulator
- 11.3 Deccan Enterprises
- 11.4 Doubletree Systems
- 11.5 Gamma Insulators
- 11.6 GIPRO
- 11.7 Hubbell
- 11.8 Hitachi Energy
- 11.9 LAPP Insulators
- 11.10 Meister International
- 11.11 NGK Insulators
- 11.12 Newell Porcelain
- 11.13 Olectra Greentech
- 11.14 Pioneer Pultrutech Engineering
- 11.15 PFISTERER
- 11.16 Siemens Energy
- 11.17 Sediver
- 11.18 SAA Grid Technology
- 11.19 Wanxie Power Technology

