
PUBLISHER: Global Market Insights Inc. | PRODUCT CODE: 1667070

PUBLISHER: Global Market Insights Inc. | PRODUCT CODE: 1667070
Carbon Management System Market Opportunity, Growth Drivers, Industry Trend Analysis, and Forecast 2025 - 2034
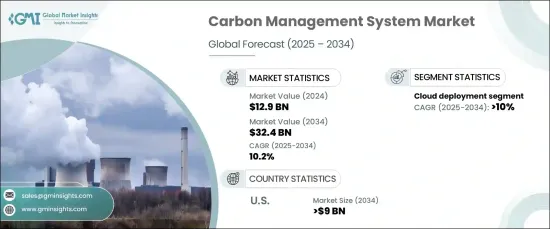
The Global Carbon Management System Market was valued at USD 12.9 billion in 2024 and is projected to experience robust growth with a CAGR of 10.2% between 2025 and 2034. This growth is fueled by a heightened awareness of climate change, a widespread push for sustainability, and the urgent need to reduce carbon footprints across industries. Organizations worldwide are aligning their operations with a low-carbon economy to meet stringent environmental regulations and satisfy consumer demands for eco-friendly practices. The shift towards sustainable operations is creating immense opportunities for the adoption of advanced carbon management solutions that address both environmental and operational challenges. Furthermore, government incentives and corporate social responsibility initiatives are encouraging businesses to invest in tools that monitor and manage emissions effectively, making carbon management systems a critical element of their sustainability strategies.
The carbon management services sector is expected to generate USD 13 billion by 2034, driven by the diverse needs of industries such as energy, manufacturing, and transportation. These sectors face unique challenges in managing emissions and are increasingly implementing tailored solutions to achieve their sustainability goals. As organizations collect and analyze carbon data and energy emissions, concerns about data security and privacy have become paramount. The integration of robust security features within carbon management systems ensures the protection of sensitive information, particularly in the context of emissions tracking and regulatory compliance.
| Market Scope | |
|---|---|
| Start Year | 2024 |
| Forecast Year | 2025-2034 |
| Start Value | $12.9 Billion |
| Forecast Value | $32.4 Billion |
| CAGR | 10.2% |
Cloud-based carbon management systems are emerging as a game-changer in the market, with a projected CAGR of 10% through 2034. These solutions empower businesses to adapt quickly and scale their carbon data management capabilities as needed. Real-time data collection and analysis allow organizations to monitor emissions, track sustainability metrics, and make data-driven decisions instantly. This level of adaptability not only streamlines the path to achieving sustainability goals but also ensures compliance with evolving environmental regulations. The increasing demand for flexible, scalable, and efficient carbon management solutions is significantly boosting the adoption of cloud-based platforms.
The US carbon management system market is poised to generate USD 9 billion by 2034, reflecting rapid growth fueled by technological advancements and supportive policy frameworks. The development of innovative carbon management tools, combined with domestic and international emissions reduction policies, is driving market expansion. Additionally, the integration of alternative energy sources, such as wind and hydropower, supports businesses in meeting ambitious emission reduction targets. These trends underscore the critical role that carbon management systems play in shaping a sustainable future, solidifying their position as indispensable tools for modern organizations.
Table of Contents
Chapter 1 Methodology & Scope
- 1.1 Market scope & definitions
- 1.2 Market estimates & forecast parameters
- 1.3 Forecast calculation
- 1.4 Data sources
- 1.4.1 Primary
- 1.4.2 Secondary
- 1.4.2.1 Paid
- 1.4.2.2 Public
Chapter 2 Executive Summary
- 2.1 Industry synopsis, 2021 - 2034
Chapter 3 Industry Insights
- 3.1 Industry ecosystem analysis
- 3.2 Regulatory landscape
- 3.3 Industry impact forces
- 3.3.1 Growth drivers
- 3.3.2 Industry pitfalls & challenges
- 3.4 Growth potential analysis
- 3.5 Porter's Analysis
- 3.5.1 Bargaining power of suppliers
- 3.5.2 Bargaining power of buyers
- 3.5.3 Threat of new entrants
- 3.5.4 Threat of substitutes
- 3.6 PESTEL Analysis
Chapter 4 Competitive Landscape, 2024
- 4.1 Introduction
- 4.2 Strategic outlook
- 4.3 Innovation & sustainability landscape
Chapter 5 Market Size and Forecast, By Component, 2021 – 2034 (USD Billion)
- 5.1 Key trends
- 5.2 Solutions
- 5.3 Services
Chapter 6 Market Size and Forecast, By Deployment, 2021 – 2034 (USD Billion)
- 6.1 Key trends
- 6.2 Cloud
- 6.3 On-premises
Chapter 7 Market Size and Forecast, By Industry, 2021 – 2034 (USD Billion)
- 7.1 Key trends
- 7.2 Energy & Utilities
- 7.3 Manufacturing
- 7.4 Residential & Commercial Building
- 7.5 Transportation & Logistics
- 7.6 IT & Telecom
- 7.7 Others
Chapter 8 Market Size and Forecast, By Region, 2021 – 2034 (USD Billion)
- 8.1 Key trends
- 8.2 North America
- 8.2.1 U.S.
- 8.2.2 Canada
- 8.3 Europe
- 8.3.1 Germany
- 8.3.2 France
- 8.3.3 UK
- 8.3.4 Spain
- 8.3.5 Italy
- 8.4 Asia Pacific
- 8.4.1 China
- 8.4.2 India
- 8.4.3 Japan
- 8.4.4 Australia
- 8.4.5 South Korea
- 8.5 Middle East & Africa
- 8.5.1 UAE
- 8.5.2 Saudi Arabia
- 8.5.3 South Africa
- 8.6 Latin America
- 8.6.1 Brazil
- 8.6.2 Argentina
Chapter 9 Company Profiles
- 9.1 Accuvio
- 9.2 Carbon Footprint Ltd.
- 9.3 Dakota Software
- 9.4 Engie
- 9.5 Enablon
- 9.6 EnergyCap
- 9.7 Enviance
- 9.8 Envirosoft
- 9.9 ESP
- 9.10 IBM
- 9.11 Intelex
- 9.12 Isometrix
- 9.13 Locus Technologies
- 9.14 NativeEnergy
- 9.15 Salesforce
- 9.16 SAP
- 9.17 Schneider Electric
- 9.18 Trinity Consultants

